blogs
30 Topics
What caught you off guard when onboarding Sentinel to the Defender portal?
Following on from a previous discussion around what actually changes versus what doesn't in the Sentinel to Defender portal migration, I wanted to open a more specific conversation around the onboarding moment itself. One thing I have been writing about is how much happens automatically the moment you connect your workspace. The Defender XDR connector enables on its own, a bi-directional sync starts immediately, and if your Microsoft incident creation rules are still active across Defender for Endpoint, Identity, Office 365, Cloud Apps, and Entra ID Protection, you are going to see duplicate incidents before you have had a chance to do anything about it. That is one of the reasons I keep coming back to the inventory phase as the most underestimated part of this migration. Most of the painful post-migration experiences I hear about trace back to things that could have been caught in a pre-migration audit: analytics rules with incident title dependencies, automation conditions that assumed stable incident naming, RBAC gaps that only become visible when someone tries to access the data lake for the first time. A few things I would genuinely love to hear from practitioners who have been through this: - When you onboarded, what was the first thing that behaved unexpectedly that you had not anticipated from the documentation? - For those who have reviewed automation rules post-onboarding: did you find conditions relying on incident title matching that broke, and how did you remediate them? - For anyone managing access across multiple tenants: how are you currently handling the GDAP gap while Microsoft completes that capability? I am writing up a detailed pre-migration inventory framework covering all four areas and the community experience here is genuinely useful for making sure the practitioner angle covers the right ground. Happy to discuss anything above in more detail.Solved450Views2likes3CommentsThe Sentinel migration mental model question: what's actually retiring vs what isn't?
Something I keep seeing come up in conversations with other Sentinel operators lately, and I think it's worth surfacing here as a proper discussion. There's a consistent gap in how the migration to the Defender portal is being understood, and I think it's causing some teams to either over-scope their effort or under-prepare. The gap is this: the Microsoft comms have consistently told us *what* is happening (Azure portal experience retires March 31, 2027), but the question that actually drives migration planning, what is architecturally changing versus what is just moving to a different screen, doesn't have a clean answer anywhere in the community right now. The framing I've been working with, which I'd genuinely like to get other practitioners to poke holes in: What's retiring: The Azure portal UI experience for Sentinel operations. Incident management, analytics rule configuration, hunting, automation management: all of that moves to the Defender portal. What isn't changing: The Log Analytics workspace, all ingested data, your KQL rules, connectors, retention config, billing. None of that moves. The Defender XDR data lake is a separate Microsoft-managed layer, not a replacement for your workspace. Where it gets genuinely complex: MSSP/multi-tenant setups, teams with meaningful SOAR investments, and anyone who's built tooling against the SecurityInsights API for incident management (which now needs to shift to Microsoft Graph for unified incidents). The deadline extension from July 2026 to March 2027 tells its own story. Microsoft acknowledged that scale operators needed more time and capabilities. If you're in that camp, that extra runway is for proper planning, not deferral. A few questions I'd genuinely love to hear about from people who've started the migration or are actively scoping it: For those who've done the onboarding already: what was the thing that caught you most off guard that isn't well-documented? For anyone running Sentinel across multiple tenants: how are you approaching the GDAP gap while Microsoft completes that capability? Are you using B2B authentication as the interim path, or Azure Lighthouse for cross-workspace querying? I've been writing up a more detailed breakdown of this, covering the RBAC transition, automation review, and the MSSP-specific path, and the community discussion here is genuinely useful for making sure the practitioner perspective covers the right edge cases. Happy to share more context on anything above if useful.Solved731Views2likes7CommentsNew Blog Post | Automated Detection and Response for Azure WAF with Sentinel
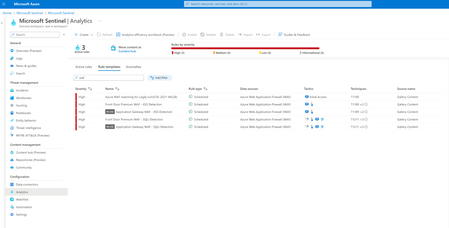
Full article: Automated Detection and Response for Azure WAF with Sentinel - Microsoft Community Hub Web applications are increasingly targeted by malicious attacks that exploit commonly known vulnerabilities. SQL injection and Cross-site scripting are among the most common attacks. Preventing such attacks in application code is challenging. It can require rigorous maintenance, patching, and monitoring at multiple layers of the application topology. A WAF solution can react to a security threat faster by centrally patching a known vulnerability, instead of securing each individual web application. Azure Web Application Firewall (WAF) is a cloud-native service that protects web apps from common web-hacking techniques. This service can be deployed in a matter of minutes to get complete visibility into the web application traffic and block malicious web attacks. Integrating Azure WAF with Microsoft Sentinel (Cloud Native SIEM/SOAR solution) for automated detection and response to threats/incidents/alerts would be an added advantage and reduces the manual intervention needed to update the WAF policy. In this blog, we will discuss about WAF detection templates in Sentinel, deploying a Playbook, and configuring the detection and response in Sentinel using these templates and the Playbook. Original Post: New Blog Post | Automated Detection and Response for Azure WAF with Sentinel - Microsoft Community Hub1.5KViews1like0Comments
Sentinel Cost Optimization Series - Part 1 - Data prioritization
* There are graphs in this post, but I can't seem to upload/insert them; please visit the link in each part to see the picture. Problem statement Data prioritization is an issue that any SIEM or data gathering and analysis solution must consider. The log that we collect to SIEM is typically security-related and capable of directly creating alerts based on the event of that log, such as EDR alerts. However, not all logs are equally weighted. For example, the proxy log only contains the connections of internal users, which is very useful for investigation, but it does not directly create alerts and has a very high volume. To demonstrate this, we categorize the log into the primary log and secondary log based on its security value and volume. https://i.ibb.co/d4CzxCH/sentinel-cost-optimize-p1-1.png The metadata and context of what was discovered are frequently contained in the primary log sources used for detection. However, secondary log sources are sometimes required to present a complete picture of a security incident or breach. Unfortunately, many of these secondary log sources are high-volume verbose logs with little relevance for security detection. They aren’t useful unless a security issue or threat search requires them. On the current traditional on-premise solution, we will use SIEM alongside a data lake to store secondary logs for later use. https://i.ibb.co/kyc96Dx/sentinel-cost-optimize-p1-architect-onpremise.png Because we have complete control over everything, we can use any technology or solution, making it simple to set up (Eg. Qradar for SIEM and ELK for data lake). However, for cloud-naive SIEM, this becomes more difficult, particularly with https://azure.microsoft.com/en-gb/products/microsoft-sentinel/. Microsoft Sentinel is a cloud-native security information and event manager (SIEM) platform that includes artificial intelligence (AI) to help with data analysis across an enterprise. To store and analyze everything for Sentinel, we typically use Log Analytics with the Analytics Logs data plan. However, this is prohibitively expensive, costing between $2.00 and $2.50 per GB ingested per day depending on the Azure region used. Current Solution Storage Account (Blob Storage) To store these secondary data, the present approach uses https://docs.microsoft.com/en-us/azure/storage/blobs/storage-blobs-introduction. Blob storage is designed to hold large volumes of unstructured data, which implies it does not follow a certain data model or specification, such as text or binary data. This is a low-cost option for storing large amounts of data. The architecture for this solution is as follows: https://i.ibb.co/YhDJvJ8/sentinel-cost-optimize-p1-architect-blob.png However, Blob Storage has a limitation that is hard to ignore. The data in Blob Storage is not searchable. We can circumvent this by using as demonstrated in https://docs.microsoft.com/en-us/azure/search/search-blob-storage-integration, but this adds another layer of complexity and pricing that we would prefer to avoid. The alternative option is to use https://docs.microsoft.com/en-us/azure/data-explorer/kusto/query/externaldata-operator?pivots=azuredataexplorer, but this is designed to obtain small amounts of data (up to 100 MB) from an external storage device, not massive amounts of data. Our Solution High-Level Architecture Our solution used Basic Logs to tackle this problem. https://docs.microsoft.com/en-us/azure/azure-monitor/logs/log-analytics-workspace-overview#log-data-plans-preview is a less expensive option for importing large amounts of verbose log data into your Log Analytics workspace. The Basic log also supports a subset of KQL, making it searchable. To get the log into the Basic Log, We need to use a Custom table generated with the Data Collection Rule (DCR)-based logs ingestion API. The structure is as follows: https://i.ibb.co/2hZ6Gpx/sentinel-cost-optimize-p1-architect.png Our Experiment In our experiment, we use the following component for the architecture: Component Solution Description Source Data VMware Carbon Black EDR Carbon Black EDR is an endpoint activity data capture and retention solution that allows security professionals to chase attacks in real-time and observe the whole attack kill chain. This means that it captures not only data for alerting, but also data that is informative, such as binary or host information. Data Processor Cribl Stream Cribl helps process machine data in real-time - logs, instrumentation data, application data, metrics, and so on - and delivers it to a preferred analysis platform. It supports sending logs to Log Analytics, but only with the Analytics plan. To send the log to the Basic plan, we need to set up a data collection endpoint and rule, please see Logs ingestion API in https://learn.microsoft.com/en-us/azure/azure-monitor/logs/logs-ingestion-api-overview for additional information on how to set this up. And we also use a Logic App as a webhook to collect the log and send it to the Data collection endpoint. The environment we use for log generation is as follows: Number of hosts: 2 Operation System: Windows Server 2019 Number of days demo: 7 The number of logs we collected for our test environment are: Basic Log generated: 30.2 MB Alerts generated: 16.6 MB https://i.ibb.co/HYXyDYL/sentinel-cost-optimize-p1-2.png The cost is based on the East US region, the currency is the USD, and the Pay-As-You-Go Tier was used to determine the number saved using the generated data with 1000 hosts and 30 days retention period. The calculation using only Analytic Log Table Ingestion Volume (GB) Cost per GB (USD) Total cost per day (USD) Total cost per retention period (USD) Host number Retention (Days) Cb_logs_Raw_CL 2.16 2.3 4.96 148.84 1000 30 Cb_logs_alert_CL 1.19 2.3 2.73 81.81 1000 30 Total 7.69 230.66 If we use Analytic Log with Storage Account Table Ingestion Volume (GB) Cost per GB (USD) Total cost per day (USD) Total cost per retention period (USD) Host number Retention (Days) Cb_logs_Raw_CL 2.16 0.02 0.04 1.29 1000 30 Cb_logs_alert_CL 1.19 2.3 2.73 81.81 1000 30 Total 2.77 83.11 If we use Analytic Log with Basic Log Table Ingestion Volume (GB) Cost per GB (USD) Total cost per day (USD) Total cost per retention period (USD) Host number Retention (Days) Cb_logs_Raw_CL 2.16 0.5 1.08 32.36 1000 30 Cb_logs_alert_CL 1.19 2.3 2.73 81.81 1000 30 Total 3.81 114.17 Now let’s compare these 3 solutions together and get an overall look altogether. Only Analytic Log Analytic Log with Storage Account Analytic Log with Basic Log Cost calculated $230.66 $83.11 $114.17 Searchable Yes No Yes but cost $0.005 per GB Retention Up to 2,556 days (7 years) 146,000 days (400 years) Up to 2,556 days (7 years) Limitation Even though the Basic Log is an excellent choice for ingesting hot data, it does have some limitations that are difficult to overlook: The retention period is only 8 days, and this retention can’t be increased, after that, it will either be deleted or archived KQL language access is limited, for a list of what operators can be used, please see https://learn.microsoft.com/en-us/azure/azure-monitor/logs/basic-logs-query?tabs=portal-1#kql-language-limits There is a charge for interactive queries ($0.005/GB-scanned) This is the first post in this Sentinel Cost Optimization series. I hope this helps you have another choice to consider when setting up and sending your custom log to Sentinel.2.7KViews1like0Comments