azure
8204 Topics
Confirming a Marketplace purchase counts toward an Azure commitment
Hi everyone, is there a way for us as the reseller to confirm that a Marketplace purchase will count toward the customer’s Azure commitment? We can check whether the product is Azure benefit eligible, but is there anything else we should check before sending the offer? And once the customer buys, can we see whether it counted, or can only the customer see that?56Views0likes3Comments
Is it possible to import CSV into Azure Test Plans using Azure CLI.
Hello All, I have prepared test cases and exported them into a CSV format following the Azure Test Plan import template. I would like to know whether it is possible to import this CSV into Azure Test Plans using Azure CLI. I have "BASIC + TEST PLAN" access5Views0likes0CommentsSQL developer tools at SQL Modernization Day
SQL developers can now do most of their database work without leaving VS Code. The MSSQL extension ships updates every month, GitHub Copilot understands your schema, and the Microsoft SQL drivers keep pace with SQL Server 2025. And new Microsoft SQL skills, now in public preview, let your coding agent assess and migrate SQL Server to Azure SQL. Here's what's new across the toolchain, and where to see it in action at SQL Modernization Day on October 20. What's new in the MSSQL extension for VS Code The MSSQL extension connects to SQL Server, Azure SQL and SQL database in Fabric from the editor you already use. It now covers far more than connecting and running queries. Versions 1.40 and 1.41 added the following. Generally available Database management. Backup and restore, plus dialogs to create, rename and drop databases. View and edit data directly in the table view. DACPAC and BACPAC extract, deploy, import and export for moving databases between environments. Fabric integration to browse workspaces and provision SQL databases in Fabric. SQL database projects with a publish dialog and code analysis. Azure Data Studio migration toolkit that brings over your connections, settings and key bindings. Public preview Query Profiler for real-time activity monitoring with Extended Events. Flat file import to turn a CSV or TXT file into a new table. Database object search across tables, views, stored procedures and more, with scripting options. SQL Notebooks that mix SQL and Python kernels in one notebook. Schema Designer and data API design with GitHub Copilot, plus an application quickstart. Need a local database? The extension can spin up a SQL Server 2025 container in a few clicks. It checks prerequisites, sets up the container and adds the connection to Object Explorer for you. Build with GitHub Copilot and your schema GitHub Copilot is built into the MSSQL extension. In agent mode it reads your actual tables, columns and relationships, along with your workspace and open files. It uses the same connection and permissions as the extension, and it asks you to approve tool actions before they run. Here's some of what you can hand off: Chat with the mssql participant for SQL guidance, or let agent mode connect, list servers and run queries. Generate tables and relationships, then review them as a diff before anything reaches the database. Write T-SQL or ORM queries from plain language, and get explanations of stored procedures, views and complex joins. Generate realistic test data from your current schema. Configure Data API builder in natural language to expose tables as REST, GraphQL or MCP endpoints. Try it: from idea to an AI-ready app The library app sample walks through a full build in three steps: Spin it up. Create a local SQL Server 2025 container from the extension and seed the database. Wire it up. Have Copilot turn hardcoded app data into new tables and relationships, generate test data, and stand up a read-only REST API with Data API builder. Light it up. Add a native VECTOR column, generate embeddings, and use VECTOR_DISTANCE for semantic search behind a RAG chatbot. The repo includes a PRD and GitHub Copilot custom instructions, so Copilot follows your naming conventions and targets SQL Server without repeating yourself in every prompt. Coming next: Azure SQL Developer runs the Azure SQL Database engine locally for development, so you can build in your inner loop and deploy to Azure with no code changes. It's in gated preview, and you can sign up at aka.ms/azuresql-developer. Assess and migrate with Microsoft SQL skills Microsoft SQL skills, now in public preview, bring SQL Server migration expertise to the coding agent you already use. Skills are packaged instructions and scripts that an agent loads when a task calls for them. You ask for an assessment or a migration in plain language, and the agent picks the right skill for each step. The skills live in one central library, so they work the same way in GitHub Copilot, VS Code, Claude and Cursor. They cover the whole journey: Assess readiness, blockers and dependencies. Recommend a target, SKU and cost. Plan prerequisites and remediation. Migrate with BACPAC, or with Log Replay Service (LRS) and managed identity. Validate with post-move checks and guided fixes. You stay in control the whole way. The agent asks before it runs commands, and you approve its recommendation before anything moves. An assessment you can act on The assessment skills look at your estate through four lenses and turn discovery data into an Azure SQL recommendation you can defend. Lens Question What it checks Compatibility Can the workload move? Feature support, breaking changes, blockers and the remediation path Assessability Is there enough evidence? Inventory coverage, assessment status, data freshness and confidence gaps Sizing What capacity does it need? CPU, memory, I/O and storage demand, mapped to a compute tier with headroom Pricing What will it cost? SKU and service tier, region, licensing including Azure Hybrid Benefit, and a monthly estimate Here's how that plays out. Ask GitHub Copilot in VS Code to assess a SQL Server 2016 instance for Azure SQL Database Hyperscale. The agent checks that the Azure CLI and its data migration extension are installed, runs the assessment and reports readiness database by database. A database that uses Service Broker gets flagged, since Azure SQL Database doesn't support it, along with the fix. You also get an HTML report that compares Hyperscale, Azure SQL Managed Instance and SQL Server on Azure VMs, with a monthly cost estimate and a SKU recommendation for each database. A migration that picks up where it left off Next, ask the agent to migrate one of those databases. It confirms SqlPackage is installed, checks that the source is online and builds a migration plan. The plan names the source and target servers and the method, an offline BACPAC export and import. It creates a new database and never overwrites an existing one, and the source isn't modified. If the export fails, the agent saves a checkpoint and diagnostics. Once you fix the source, it retries only the failed step instead of starting over, then validates the result. Explore the skills at aka.ms/microsoftsql-skills. For the full set of migration tools, including Azure Migrate, Azure Database Migration Service and migration through Azure Arc, see the database migration guide. Microsoft SQL skills are in public preview. Preview features are provided without a service level agreement and aren't recommended for production workloads. Put your database under source control with SQL projects SDK-style SQL projects (Microsoft.Build.Sql) treat your database like any other codebase. A build produces a .dacpac you can deploy to new or existing databases across SQL Server, Azure SQL and SQL database in Fabric. You can work with SQL projects in VS Code, SSMS and Visual Studio. Cross-platform builds with plain dotnet build. Every .sql file in the folder is included by default. Code analysis on build with 14 default rules. Add custom rule sets as package references, and promote any rule to a build error. Package references for shared objects and cross-database references, so objects that rarely change don't slow down every build. Extract an existing database into a SQL project with SqlPackage, installed as a dotnet tool. Schema compare across databases, SQL projects and .dacpac files. A typical pipeline looks like this: A developer proposes a change in a pull request. CI builds the project and runs code analysis. The team approves and merges to main. The pipeline calculates a deployment plan against staging or production. Someone reviews the plan as a script or deploy report and approves the release. GitHub environments and Azure DevOps approvals handle that last gate. SQL projects also help as AI agents write more of your code. Every database change lands as a reviewable diff, and changes from several agents or teammates merge like any other code. Get started at aka.ms/sqlprojects or work through the SQL DevOps workshop. What's new in the Microsoft SQL drivers The Microsoft SQL drivers all shipped new releases, including several of the fixes the community asked for most. Driver Release Highlights Microsoft.Data.SqlClient (.NET) 7.0 The core package drops its Azure dependencies. Entra auth moves to Microsoft.Data.SqlClient.Extensions.Azure with no code changes. New pluggable SSPI auth, .NET 10 support, and ActiveDirectoryPassword marked obsolete. JDBC 13.4 FLOAT16 vector support for embeddings, a new performance logger, Java 25 LTS and SQL Server 2025 support. mssql-python 1.4 A public bulk copy API with a Rust-powered core, spatial types, and type hints for mypy and Pyright. mssql-django 1.7 Django 6.0 and Python 3.14, composite primary keys, SQL Server 2025, and ODBC Driver 18 as the default. PHP (sqlsrv, pdo_sqlsrv) 5.13 PHP 8.4 and 8.5, SQL Server 2025, newer Linux and macOS platforms, and a fix for a Fabric connectivity crash. New to the Python driver? Start with the mssql-python quickstart. See it live at SQL Modernization Day Amit Khandelwal's session, Migrate to Azure SQL. Then Build Something New., puts these tools together at 10:00 AM PT on Tuesday, October 20. He covers the path off on-premises SQL Server, then builds on Azure SQL Database with VS Code, GitHub Copilot, the latest drivers and the SQL MCP Server. Expect demos of the developer workflow, not only the migration. SQL Modernization Day is a free livestream on Microsoft Reactor with eight sessions from the Microsoft SQL team. Register at aka.ms/SQLModernizationDay2026.Migrating Azure Cosmos DB Across Regions
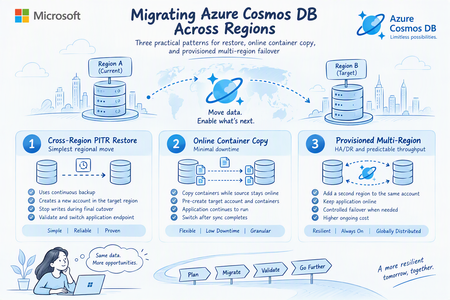
What this article delivers? A decision-oriented, implementation-ready walkthrough based on a hands-on Azure Cosmos DB for NoSQL lab. It corrects the online copy sequence, includes the required Azure CLI snippets, and separates migration duration from application cutover downtime. Regional migration in Azure Cosmos DB is not a single operation. The correct pattern depends on whether the priority is the simplest supported move, the smallest application outage, or a durable multi-region architecture. The Three Migration Patterns at a Glance Pattern Best fit App impact Destination Primary caution 1. Cross-Region PITR restore Simplest regional move Stop writes during final cutover New account created by restore Target-region capacity and restore-point readiness 2. Online copy Minimal downtime Source stays online until cutover Pre-created account and empty target containers Preview prerequisites, RBAC, RU limits, one job per container 3. Provisioned multi-region HA/DR and predictable throughput Online while adding region; controlled failover Same account, second region Higher ongoing cost; conversion back to serverless is not a standard self-service path Before you migrate: establish the decision inputs A reliable migration plan starts by separating total data-movement time from business downtime. Online copy can run for hours or days without requiring the application to stop. Restore may complete quickly, but the application still needs a controlled write freeze, validation, endpoint change, and restart. Define both measures explicitly. Capacity is a migration dependency: A restore that creates a new account still requires the target region to accept the deployment. Validate region availability early, keep an escalation path ready, and avoid treating a successful small-environment test as a capacity guarantee for production. Current Environment Setup Cosmos DB Environment with Capacity Mode= Serverless: Current CosmoDB Topology: Data Count in current database pre-migration: Approach 1: Cross-region point-in-time restore This is the preferred first option when the customer can accept a short write outage and is comfortable moving to a new Cosmos DB account. The restore operation creates the target account; you do not pre-create the destination account as you do for online container copy. Conceptual Plan: Execution flow Confirm the source account uses continuous backup and that the required restore point is available. Validate target-region readiness and prepare the target account name, resource group, networking, identity, and application configuration plan. Schedule the cutover and stop application writes. Start the restore into the target region. Azure creates the new account. Validate account state, databases, containers, policies, item counts, networking, private endpoints, and data-plane RBAC. Update the application endpoint and credentials or managed-identity assignments. Start the application and validate reads and writes. Keep the source account unchanged for an agreed rollback window, then retire it after sign-off. Pre-checks and validation snippets RG="CosmoDB_Demo" SRC_ACCOUNT="demotestingenvironment" az cosmosdb show \ --resource-group "$RG" \ --name "$SRC_ACCOUNT" \ --query "{Account:name,BackupPolicy:backupPolicy.type,Locations:locations[].locationName,State:provisioningState}" \ -o json Review BackupPolicy Type: Note Follow Restore an Account That Uses Continuous Backup Mode - Azure Cosmos DB | Microsoft Learn to update to restore option In the Azure Portal: Cosmos DB → testingenvironmentfordemo → Backup & Restore. Periodic → Continuous Referesh the page and fill in Restore requirements. Cross region restore incurs additional charges on top of the normal point-in-time restores, the price depends on the regions that you are restore from and to. Learn more New Account is created, with data: Testing and Validation Check if the deployment is successful: Count of data across both databases are the same: Approach 2: Online container copy with minimal downtime Online container copy is a container-by-container migration. The application continues reading and writing to the source during the initial copy and incremental synchronization. At cutover, the team stops source writes, waits for the job to catch up, calls the completion operation, validates the target, and then switches the application. The Azure CLI command group and the feature are preview capabilities, so production adoption should include preview acceptance, current limitation review, and a tested fallback. Reference topology used in the lab Component Source Destination Account demotestingenvironment demotestingenvironmentrestore Database demotestingDB demotestingDB Container demotestingDBID demotestingDBID-copy Partition key /category /category Mode Serverless Serverless in the lab Step 1: Define reusable variables RG="CosmoDB_Demo" SRC_ACCOUNT="demotestingenvironment" DEST_ACCOUNT="demotestingenvironmentrestore" SRC_DB="demotestingDB" SRC_CONTAINER="demotestingDBID" DEST_DB="demotestingDB" DEST_CONTAINER="demotestingDBID-copy" JOB="online-copy-hls-final-04" Install the copy extension az extension add --name cosmosdb-preview --upgrade Step 2: Verify source az cosmosdb show -g "$RG" -n "$SRC_ACCOUNT" --query "{Backup:backupPolicy.type,Capabilities:capabilities[].name,State:provisioningState}" -o json Confirm that Backup is Continuous. Confirm that the source has All Versions and Deletes change feed enabled, and review compatibility limitations before applying the capability to an existing production account. Step 3: Create the empty destination container az cosmosdb sql container create -g "$RG" -a "$DEST_ACCOUNT" -d "$DEST_DB" -n "$DEST_CONTAINER" -p "/category" Configure source identity and destination access az cosmosdb identity assign -g "$RG" -n "$SRC_ACCOUNT" SRC_PRINCIPAL=$(az cosmosdb show -g "$RG" -n "$SRC_ACCOUNT" --query "identity.principalId" -o tsv) az cosmosdb update -g "$RG" -n "$SRC_ACCOUNT" --default-identity "SystemAssignedIdentity" az cosmosdb sql role assignment create -g "$RG" -a "$DEST_ACCOUNT" --role-definition-id "00000000-0000-0000-0000-000000000002" --principal-id "$SRC_PRINCIPAL" --scope "/" Step 4: Start Online Copy az cosmosdb copy create --resource-group "$RG" --job-name "$JOB" --src-account "$SRC_ACCOUNT" --dest-account "$DEST_ACCOUNT" --src-nosql database="$SRC_DB" container="$SRC_CONTAINER" --dest-nosql database="$DEST_DB" container="$DEST_CONTAINER" --mode Online Monitor az cosmosdb copy show -g "$RG" -a "$DEST_ACCOUNT" -n "$JOB" --query "{Status:status,Processed:processedCount,Total:totalCount,Error:error}" -o table Query the destination container SELECT * FROM c WHERE c.id = "HLS-ONLINE-COPY-001" Also review via CLI The record appearing in the destination proves both the initial copy and the incremental-change path. Also compare source and target counts, but do not rely on count equality alone; validate representative documents, partition-key values, updates, deletes, TTL behavior, and application queries. Note: Perform the production cutover correctly Stop all writes to the source container. Wait for the online job to catch up and confirm Error is null. Run the complete operation to finalize the online copy job. Validate target counts, representative records, updates/deletes, indexing behavior, networking, identity, and application connectivity. Switch the application endpoint to the destination account and container. Run read/write smoke tests and monitor 429s, 403s, latency, and error rates. Keep the source unchanged for the approved rollback window, then retire it. Approach 3: Convert to provisioned throughput and use multi-region replication This pattern changes the question from “How do I copy data into a second account?” to “How do I extend the existing account into a second region and fail over?” It is appropriate when the workload needs predictable throughput, stronger regional resiliency, or serverless limits make copy-based approaches impractical. Convert the existing serverless account to provisioned throughput. Review and right-size the initial manual throughput assigned to each container or database. Add the target region as an additional region on the same account. Wait for replication and validate application connectivity. Change failover priority or initiate the approved failover method so the target region becomes the write region. Decide whether to retain the original region for HA/DR or remove it after validation. Convert: Azure Portal → Cosmos DB → demotestingenvironment → Overview → Change capacity mode to provisioned throughput and confirm. Refresh and the capacity mode should change. Under Settings, select Replicate data globally, Select West US 2 as the existing region and under Additional regions, select North Central US. Change the write region: Validate current write region Decision framework Decision question Restore Online copy Provisioned multi-region Can the app stop writes briefly? Best fit Not required during bulk copy Not required while adding region Must the target be an existing account? No; restore creates a new account Yes; pre-create target account/container Same account Need to remain serverless? Supported if target deployment is accepted Possible, but throughput can slow copy No; account becomes provisioned Need built-in regional HA after migration? Single target account unless redesigned Single target account unless redesigned Best fit Main production risk Target capacity and cutover validation Preview prerequisites, RBAC, 429s, copy duration Cost, throughput sizing, irreversible architecture choice References Container Copy Jobs - Azure Cosmos DB Azure CLI: az cosmosdb copy Restore an Azure Cosmos DB account using continuous backup Migrate an account to continuous backup mode Configure data-plane role-based access control Change from serverless to provisioned throughput Compare provisioned throughput and serverless Azure Cosmos DB pricing92Views1like0CommentsOptimizing Oracle-to-Power BI Performance and the Path to Modern Analytics
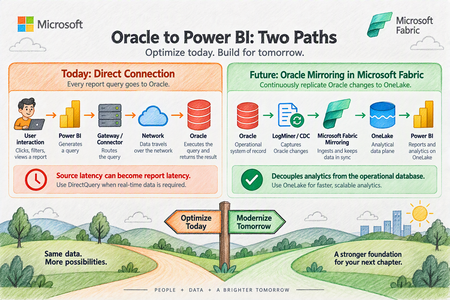
Organizations frequently rely on Oracle databases for large-scale operational workloads while using Microsoft Power BI as their enterprise analytics and visualization platform. Although connecting Power BI directly to Oracle is fully supported, performance can become challenging as datasets grow into the millions of rows. A recent enterprise scenario involving millions of Oracle records illustrates an important principle: Oracle-to-Power BI performance should not be attributed to a single component without first isolating the entire retrieval path. This article provides a practical framework for optimizing that architecture today, while also examining how Microsoft Fabric Mirroring can provide a different data-access pattern for future analytics workloads. The Performance Challenge Consider an Oracle environment containing approximately 15 million records. Testing showed substantially different behavior depending on the client used to retrieve the same Oracle data: A direct Oracle query executed through TOAD returned millions of rows in about eight minutes. Tableau connected to the same Oracle table from the same laptop and refreshed millions of rows in 20 to 30 minutes. Power BI Desktop, however, continued processing for multiple hours before the operation was terminated by network or database controls. Importantly, the Power BI query did not contain additional Power Query transformations. The customer was directly executing SQL and loading the resulting data. This is an extremely useful diagnostic comparison because it demonstrates that Oracle is capable of returning the underlying dataset considerably faster than the Power BI test. It does not, however, prove that the Power BI Oracle connector itself is the single root cause. Performance Is a Pipeline, Not a Single Component Oracle-to-Power BI performance involves several layers: A bottleneck at any one of these layers can affect overall refresh or query performance. Therefore, the first architectural principle is: Measure every layer before attempting to tune the entire solution. A troubleshooting exercise should evaluate: Oracle server-side execution time SQL execution plan Oracle provider/client behavior FetchSize behavior Network transfer Power Query evaluation Query folding Power BI model processing Report design Gateway behavior when the Power BI Service is introduced This approach avoids prematurely concluding that Oracle, Power BI, the gateway, or the connector is inherently responsible for the slowdown. Start With the Oracle Provider Power BI currently provides two important approaches for Oracle connectivity. Built-in Oracle provider Modern versions of Power BI Desktop include Microsoft's bundled Oracle Managed ODP.NET provider. This reduces the dependency on separately installing Oracle client software. For environments using the built-in provider, testing should be performed with a current Power BI Desktop release because provider behavior and defaults can change between releases. Oracle Client for Microsoft Tools Oracle Client for Microsoft Tools, or OCMT, remains another supported option. OCMT configures Oracle Data Provider for .NET and can therefore be tested independently from the built-in provider. This gives architects a useful isolation mechanism: Test A: Built-in Oracle provider vs. Test B: OCMT provider. Use the same: workstation SQL statement Oracle database table credentials network path expected row count Changing several variables simultaneously makes the results considerably harder to interpret. Understand FetchSize One of the most important areas identified during troubleshooting is FetchSize. FetchSize controls how much data the Oracle provider retrieves during each fetch operation. For large datasets, a small FetchSize can require many retrieval operations, increasing overhead. Increasing FetchSize allows the provider to retrieve more data at a time and may improve throughput. However, FetchSize tuning should be tested independently from the choice of Oracle provider. Switching to OCMT, for example, does not by itself demonstrate whether FetchSize tuning improves performance. Benchmark the same SQL and dataset using consistent test conditions and compare elapsed time and throughput. FetchSize controls how much Oracle data the provider pulls back in each retrieval batch. Think of FetchSize like the size of a delivery truck. Imagine Power BI needs to retrieve a very large dataset from Oracle. Small FetchSize: Oracle → 📦 → Power BI Oracle → 📦 → Power BI Oracle → 📦 → Power BI Oracle → 📦 → Power BI ...many retrieval operations Larger FetchSize: Oracle → 📦📦📦📦📦 → Power BI Oracle → 📦📦📦📦📦 → Power BI ...fewer retrieval operations The idea is simple: FetchSize determines how much data the Oracle provider fetches at a time. Examine Oracle Data Types FetchSize is not the only provider consideration. Schema matters. A troubleshooting package should include the table DDL rather than only a list of column names. Pay particular attention to large-object types such as: BLOB CLOB Large-object columns may materially change retrieval behavior and can make simply increasing FetchSize insufficient. Therefore capture: complete table DDL column names Oracle data types row width presence of BLOB/CLOB columns expected total result size Do not optimize FetchSize without understanding the shape of the data being transferred. Filter Rows and Columns as Early as Possible Probably the most universally applicable Power Query optimization is also one of the simplest: Do not retrieve data you do not need. Instead of retrieving every row and column and filtering afterward, reduce the dataset at Oracle whenever possible. Good Oracle SQL should therefore: select only required columns apply restrictive predicates at the source aggregate at Oracle where appropriate avoid unnecessary data transfer This matters substantially when Power BI and Oracle are separated by a network boundary. Preserve Query Folding Power Query query folding allows Power BI transformations to be translated back into SQL executed by the relational source. For relational sources such as Oracle, maintaining folding can substantially reduce the amount of work performed by the Power Query mashup engine. The preferred pattern is: Where practical: filter early remove unnecessary columns early avoid transformations that unexpectedly break folding inspect where folding stops push relational operations back into Oracle For DirectQuery, folding is particularly important because the source remains part of the interactive report-query path. Be Careful With Native SQL and Incremental Refresh Native SQL can be extremely valuable for troubleshooting. Running the same targeted SELECT statement through Power BI that is executed directly against Oracle creates a useful A/B test. It helps isolate questions such as: Is Oracle itself taking a long time? Is Power BI generating a different query? Is additional processing happening after Oracle returns the data? Is the retrieval/provider layer adding significant latency? However, architecture matters. Power BI guidance warns that later Power Query steps cannot necessarily fold after a native SQL query, and native SQL has important implications for incremental refresh. Therefore, native SQL is useful both as an optimization technique in some architectures and as a diagnostic isolation technique, but it should not automatically be substituted for a well-folded Power Query design. Prefer Import for Traditional Oracle BI Workloads If the business does not require near-real-time data, Import should generally be evaluated before DirectQuery for large Oracle analytical workloads. With Import: The latency of Oracle, networking, and the provider is mostly experienced during refresh rather than repeatedly during user interaction. This usually provides a more predictable interactive experience. DirectQuery produces a different dependency chain: As a result, source latency can become report latency. Use DirectQuery when its architectural benefits are required, rather than simply because the source database supports it. Make Incremental Refresh Truly Incremental Import does not necessarily mean repeatedly loading the entire Oracle dataset. For large fact tables, incremental refresh should be evaluated so that only required partitions are refreshed. However, there is an important condition: RangeStart and RangeEnd filtering needs to be pushed back to Oracle. If partition filters do not fold, Power BI can end up retrieving considerably more source data than expected before applying the filtering. Therefore incremental refresh testing should verify that the Oracle query generated by Power BI contains the expected predicates. Treat the Gateway as Its Own Performance Layer Once the workload moves into the Power BI Service, however, the on-premises data gateway becomes another measurable component. For production deployments examine: gateway version Oracle provider/client version CPU memory network proximity to Oracle refresh concurrency DirectQuery concurrency competing workloads Where necessary, large refresh workloads and latency-sensitive DirectQuery workloads can be isolated onto different gateway resources. Do not diagnose gateway performance from a Power BI Desktop test where the gateway is not involved. Optimize DirectQuery If It Cannot Be Avoided Sometimes Import is not viable because users require data with very low latency. If Oracle must remain behind DirectQuery, reduce unnecessary work at every level. At Oracle index frequently filtered columns appropriately review execution plans select only necessary columns reduce returned rows avoid unnecessarily expensive calculations In Power Query maintain query folding push filtering to Oracle minimize transformations requiring local evaluation In the semantic model use efficient dimensional modeling avoid unnecessary high-cardinality columns consider aggregation strategies where appropriate In reports limit visual density use selective filters avoid generating unnecessary simultaneous source queries test with realistic user concurrency DirectQuery performance needs to be assessed as an end-to-end architecture, rather than as an individual SQL benchmark. Collect Diagnostics Before Declaring a Root Cause For difficult Oracle performance cases, establish a repeatable diagnostic package. Capture: Oracle database version execution plan SQL execution duration table DDL data types row count approximate returned data size Provider built-in provider versus OCMT provider/client version FetchSize configuration Power BI Power BI Desktop version generated SQL Query Diagnostics Mashup traces Applied Steps or M code total execution time Network Oracle-to-client path throughput latency connection interruptions or timeouts Comparison clients If Tableau or another Oracle client appears dramatically faster, reproduce the same SQL, same columns, same records, same database and preferably the same machine. Only then does the comparison become a useful engineering benchmark. Future Architecture: Oracle Mirroring in Microsoft Fabric Optimizing the direct Oracle connection solves one class of problem. Microsoft Fabric Mirroring provides a different architecture altogether. Instead of repeatedly placing Oracle in the analytical query path, Fabric can continuously replicate Oracle changes into OneLake. Conceptually: Fabric Mirroring uses Oracle LogMiner to capture changes and maintain an analytical copy in OneLake. This separates many downstream analytical reads from the operational Oracle database. The key architectural advantage isn't simply "a faster connector." The advantage is decoupling analytics from the operational database. Recommended Architecture Decision Tree Requirement: traditional BI with scheduled freshness Use: Oracle → Import → Power BI semantic model. Then optimize: FetchSize provider query folding source-side filtering incremental refresh Requirement: operational or near-real-time reporting where Oracle must remain the source Evaluate: Oracle → DirectQuery → Power BI. But aggressively optimize: Oracle SQL execution plans query folding visual density provider configuration concurrency gateway architecture Requirement: enterprise analytics with frequent Oracle changes and growing BI/AI requirements Evaluate: Oracle → Fabric Mirroring → OneLake → Fabric / Power BI. This reduces repeated analytical pressure against the operational Oracle environment and creates a reusable analytical data foundation for additional workloads. A Practical Troubleshooting Sequence A useful Oracle-to-Power BI performance investigation can be organized into five phases. Phase 1: Establish the Oracle baseline Execute exactly the same query directly against Oracle. Record: SQL → rows → bytes → execution time Phase 2: Isolate the provider Run the same dataset through: Built-in Oracle provider and OCMT. Record the results independently. Phase 3: Test FetchSize Test controlled FetchSize values while holding every other variable constant. Measure throughput rather than relying on subjective impressions. Phase 4: Optimize Power Query Validate: query folding source filtering column projection transformations incremental refresh behavior Phase 5: Decide whether the architecture itself should change If extremely large Oracle datasets must continually feed analytical workloads, consider whether repeatedly querying Oracle remains the appropriate long-term design. At that point, Fabric Mirroring becomes an architectural discussion rather than simply another troubleshooting step. Final Takeaway Oracle-to-Power BI performance problems should not immediately be categorized as an Oracle problem, a Power BI problem, or a gateway problem. They are usually best investigated as a data retrieval pipeline. For existing Power BI architectures, the strongest optimization sequence is: Efficient Oracle SQL For the longer term, Microsoft Fabric Mirroring changes the architecture: Oracle becomes the operational system of record while OneLake becomes the analytical data plane. That separation can be particularly valuable as organizations expand from traditional Power BI reporting into broader Fabric analytics, data engineering and AI workloads.196Views1like0Comments
TLS 1.0 and 1.1 support will be removed for new & existing Azure storage accounts starting Feb 2026
Update on October 13, 2026: Starting on October 14, 2026, changes will start rolling out to block existing storage accounts from downgrading their minimum TLS version to 1.0 or 1.1. Update in September 2025: This post was edited to reflect the retirement date change from November 1, 2025 to February 3, 2026. To meet evolving technology and regulatory needs and align with security best practices, we are removing support for Transport Layer Security (TLS) 1.0 and 1.1 for both existing and new storage accounts in all clouds. TLS 1.2 will be the minimum supported TLS version for Azure Storage starting February 3, 2026. Azure Storage currently supports TLS 1.0 and 1.1 (for backward compatibility) and TLS 1.2 on public HTTPS endpoints. TLS 1.2 is more secure and faster than older TLS versions. TLS 1.0 and 1.1 do not support modern cryptographic algorithms and cipher suites. Many of the Azure storage customers are already using TLS 1.2 and we are sharing this guidance to expedite the transition for customers currently on TLS 1.0 and 1.1. Customers must secure their infrastructure by using TLS 1.2+ with Azure Storage by February 2, 2026. The older TLS versions (1.0 and 1.1) are being deprecated and removed to meet evolving standards (FedRAMP, NIST), and provide improved security for our customers. This change will impact both existing and new storage accounts using TLS 1.0 and 1.1. To avoid disruptions to your applications connecting to Azure Storage, you must migrate to TLS 1.2 and remove dependencies on TLS version 1.0 and 1.1, by February 2, 2026. Learn more about how to migrate to TLS1.2. As best practice, we also recommend using Azure policy to enforce a minimum TLS version. Learn more here about how to enforce a minimum TLS version for all incoming requests. If you already use Azure Policy to enforce TLS version, minimum supported version after this change rolls out will be TLS 1.2. Help and Support If you have questions, get answers from community experts in Microsoft Q&A. If you have a support plan and you need technical help, create a support request: For Issue type, select Technical. For Subscription, select your subscription. For Service, select My services. For Service type, select Blob Storage. For Resource, select the Azure resource you are creating a support request for. For Summary, type a description of your issue. For Problem type, select Connectivity For Problem subtype, select Issues using TLS.124KViews3likes5CommentsError: The provided client secret keys are expired
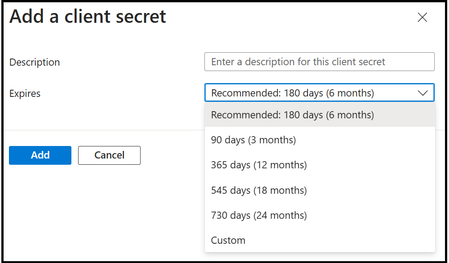
If you have been using Microsoft Graph Data Connect for a while, you might have configured a recurring pipeline that has been running for several months. In that case, you might run into this error: Operation on target task_name failed: ErrorCode=UserErrorOffice365SinkValidationError, 'Type=Microsoft.DataTransfer.Common.Shared.HybridDeliveryException, Message=Office365 data loading job failed to validate the sink data store. Possible causes are the name of the data store or its folder path is invalid, or the provided credentials do not have enough permission to access the folder. Detailed error: ADLS Gen2 operation failed for: Failed to get access token by using service principal. Error: invalid_client, Error Message: A configuration issue is preventing authentication – check the error message from the server for details. You can modify the configuration in the application registration portal. See https://aka.ms/msal-net-invalid-client for details. Original exception: AADSTS7000222: The provided client secret keys for app 'xxxxxxxx-xxxx-xxxx-xxxx-xxxxxxxxxxxx' are expired. Visit the Azure portal to create new keys for your app: https://aka.ms/NewClientSecret, or consider using certificate credentials for added security: https://aka.ms/certCreds. Trace ID: xxxxxxxx-xxxx-xxxx-xxxx-xxxxxxxxxxxx Correlation ID: xxxxxxxx-xxxx-xxxx-xxxx-xxxxxxxxxxxx Timestamp: 2024-11-26 18:35:23Z. Account: 'account_name'. FileSystem: 'container_name'. Path: 'folder_name'., Source=Microsoft.DataTransfer.ClientLibrary,' The main error is really "The provided client secret keys for app 'x' are expired." The solution is simple. Go back to Azure Entra ID to configure a new secret for the App Registration. You can follow the instructions at step 1b in our Synapse step-by-step instructions to add a new secret. Finally, be sure to add the new secret to the link services of the pipeline (you need to update both the source (Source/MGDC) and the destination (Sink/Storage). You avoid this issue completely by keeping track of the secret expiration date and creating a new one (and updating the pipeline) ahead of time. You can have multiple secrets in place, allowing for this secret rotation to be done proactively.