azure sql database
326 TopicsAzure SQL Database is retiring Always Encrypted with Intel SGX enclaves
On October 31, 2027, Azure SQL Database will retire Intel Software Guard Extensions (SGX) enclave functionality for Always Encrypted. Workloads that still depend on Intel SGX enclaves after that date will no longer work as configured. The path forward is Virtualization-Based Security (VBS) enclaves, a hardware-independent option that does not require attestation. To retain secure-enclave capabilities, move databases from DC-series compute to a supported standard-series, non-DC tier and update affected applications for VBS enclave mode. What is changing? Intel SGX enclaves are tied to DC-series compute. After October 31, 2027, databases on these tiers must move to supported compute to retain enclave-enabled capabilities. Applications configured for Intel SGX enclaves may also need driver and connection-string updates. For workloads that do not require isolation from the host operating system, VBS enclaves offer a straightforward migration within Azure SQL Database. If your threat model requires Intel SGX-equivalent host isolation, evaluate SQL Server on Azure Confidential VMs instead. Choose the right migration path Use the migration guide to identify databases and elastic pools on DC-series compute, choose the target architecture that matches your threat model, update application connectivity and attestation settings, and validate the workload before production cutover. Move to VBS enclaves in Azure SQL Database Choose VBS enclaves when you need to protect sensitive data from unauthorized users or malicious insiders but do not require isolation from the host operating system. VBS enclaves run on supported non-DC compute tiers and eliminate attestation requirements. Consider SQL Server on Azure Confidential VMs If your threat model requires stronger isolation from the host operating system, assess SQL Server on Azure Confidential VMs. Compare architecture, operations, compatibility, and cost with the Azure SQL Database option. Start planning early Start now. Discovery, compute-tier changes, application updates, security review, and production validation all take time. Complete the migration before October 31, 2027, to keep enclave-enabled workloads running without interruption. Help and support Have questions? Ask community experts in Microsoft Q&A. If you have an Azure support plan and need technical help, create a support request. Review service retirements that may affect your resources in the Azure Retirement Workbook. For more ways to find impacted resources, see the retirement guidance. Retirement information may take up to two weeks to appear.86Views1like1CommentDatabase Hub in Fabric: Now in Public Preview -Turn Database Signals into Guided Action
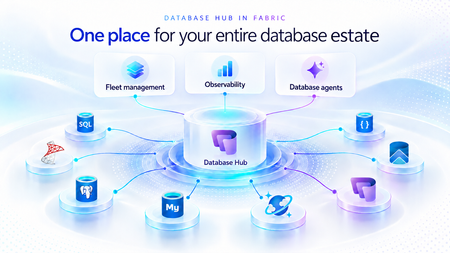
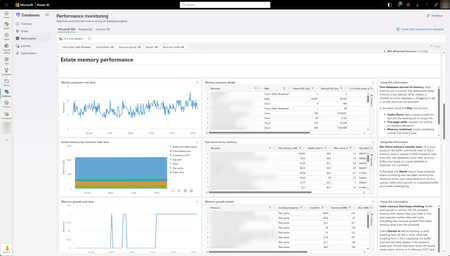
As applications grow, so does the database estate behind them. What starts with a handful of databases can become hundreds or thousands of resources spread across services, subscriptions, and environments. For the teams responsible for keeping them healthy, the challenge is no longer just collecting signals. It is knowing what needs attention, why it matters, and what to do next. Now in public preview, Database Hub in Microsoft Fabric brings inventory, health, performance, security, and optimization insights into one connected experience. It helps administrators and developers see the bigger picture, identify affected resources, and move from estate-wide visibility to focused investigation, without losing the context that brought them there. The preview brings together supported resources across Azure SQL Database, SQL Server enabled by Azure Arc, Azure Database for PostgreSQL, Azure Cosmos DB, and SQL database in Fabric. Available capabilities and signals vary by service and preview configuration. Database Hub Overview brings together estate-wide findings and cross-engine performance trends to help you prioritize what needs attention. Start with what needs your attention When you manage a large database estate, another dashboard is only useful if it helps you decide where to spend your time. The Overview page provides that starting point, bringing together findings across security, performance, and optimization. It distinguishes Issues, which require timely attention, from Suggestions, which highlight opportunities to improve your estate over time. You might begin with a security configuration that needs review or a performance signal that warrants investigation. Selecting a finding opens Estate with the relevant filters already applied, so you can see the affected resources rather than search for them again. The result is a more direct path from “something needs attention” to “these are the resources I should investigate.” Overview highlights issues across Security, Performance, and Optimization, with affected-resource counts and direct links to investigate further. Bring your estate into one view, and make it relevant to you The Estate experience brings supported resources into a unified inventory, scoped to your existing permissions. Search and filters help you narrow that inventory to the service, subscription, or resource group you manage. This is especially useful when your responsibilities span database engines. You can begin with a broader view, then focus on Azure SQL databases, Arc-enabled SQL Server resources, or Azure Database for PostgreSQL flexible servers without rebuilding the resource list in separate portals. Each resource brings its associated Issues and Suggestions into context. Open a finding to review the affected resource, supporting information, and recommended next step. The inventory also respects the resource model of each service. For example, the PostgreSQL view represents flexible server instances, rather than every database hosted within them. A unified view does not mean moving your databases. Your Azure resources remain in their existing subscriptions, and on-premises SQL Server instances remain on-premises, connected through Azure Arc. Database Hub brings operational context together; it does not require relocating or mirroring your application data into Fabric. Estate brings resource inventory, Issues, and Suggestions into one view, with quick actions to continue investigation in the Azure portal, VS Code, or SSMS. Understand security posture and performance in context Database Hub helps you identify configurations worth reviewing and resources that need a closer look. For security, supported signals can include Microsoft Entra authentication, customer-managed keys, and auditing coverage, depending on the database service. These findings provide a starting point for investigation, not a blanket judgment that every flagged resource is insecure or noncompliant. For example, a suggestion to review customer-managed keys should be evaluated against your organization’s requirements. A resource using service-managed keys is still encrypted at rest. For performance, built-in dashboards bring supported utilization and activity signals into view, including CPU, memory, storage, I/O, and connections. Review trends across your estate, then narrow the scope and time range to investigate individual resources. Metric availability varies by engine and monitoring configuration; missing data should not be interpreted as good health. For supported SQL monitoring scenarios, you can also create a custom monitoring dashboard from a template and tailor its charts and layout to the resources your team follows regularly. Together, these experiences help answer two practical questions: Where is pressure building, and where is there an opportunity to improve? Performance summaries highlight recent capacity signals and trends across Microsoft SQL, PostgreSQL, and Cosmos DB. The Security dashboard summarizes Microsoft Entra authentication, audit logging, and customer-managed key coverage, helping you identify configurations that warrant review across your estate. The Performance monitoring dashboard combines memory-pressure trends, resource-level details, and interpretation guidance to help focus your investigation. Move from a finding to an informed next step Estate-wide visibility is the beginning of an investigation, not a replacement for database expertise. When a finding needs deeper analysis, Database Hub helps you review the evidence and continue in the appropriate native experience, such as the Azure portal or SQL Server Management Studio (SSMS). Engine-specific diagnostics and configuration changes remain in the tools designed for that work. Consider a performance issue that occurred before an administrator could inspect it. In supported agent-assisted scenarios, captured incident evidence can help establish what happened, when it happened, and which queries or sessions were involved. That context gives the administrator a more informed starting point for investigation. The operator remains in control: review the evidence, evaluate the recommendation, and apply authorized changes through the appropriate service tools. The preview investigation workflow does not automatically remediate issues, and existing permissions and approval requirements continue to apply. Bring database expertise into agent-assisted workflows We are also making database operational intelligence available through agent skills: reusable capabilities that agents can call to support observability, monitoring, diagnostics, optimization, and other database operations. Database Hub provides estate context; skills provide a way to bring database expertise into an agent-assisted investigation. This creates a foundation for helping teams move from identifying an affected resource to understanding its signals and evaluating the next step. We’re building toward making this expertise available in the AI companions and development tools teams already use, with recommendations grounded in evidence, the specific database, and your organization’s operational controls. If we take a step back, our broader vision brings together a free, extensible Database Hub experience, agentic observability, and OneLake integration, all within Microsoft Fabric. It’s a foundation for connecting database operations with analytics and AI and helping teams turn signals into informed action. Get started with Database Hub Start with the Database Hub documentation to review preview availability, supported services, and setup requirements. Ask your Fabric administrator to enable the preview where required, confirm that you have the appropriate resource permissions, and complete any service-specific monitoring prerequisites. Then open Microsoft Fabric, select Databases in the left navigation, and begin with Overview. Choose a finding, explore the affected resources in Estate, and follow the evidence into your next investigation. For more details on supported services and getting set up, the Database Hub documentation is also available on Microsoft Learn. Learn more What is Database Hub in Fabric? Enable performance monitoring for Microsoft SQL Performance Monitoring for Azure SQL in Database Hub519Views4likes1CommentMI link support for multiple databases in an Always On availability group for SQL Server (Preview)
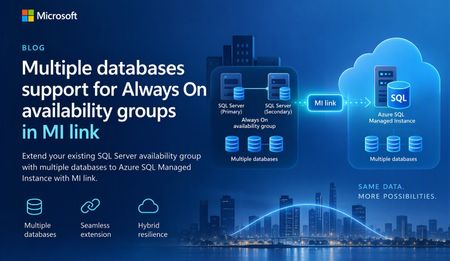
A simpler way to extend availability groups to Azure We are pleased to announce the preview of multi-database mode for Managed Instance link. The new mode lets you replicate multiple databases from an existing Always On availability group through a single link between SQL Server and Azure SQL Managed Instance. Managed Instance link uses distributed availability group technology to provide near-real-time replication between SQL Server and Azure SQL Managed Instance. It supports hybrid architectures, online migration, disaster recovery, and read-only workload offload. The link can be configured and managed through SQL Server Management Studio (SSMS), PowerShell, Azure CLI, and Azure APIs. Previously, each link supported one database. Customers with multi-database availability groups therefore had to split databases into separate availability groups and create a link for each database. Multi-database mode removes that limitation for supported SQL Server versions and editions, while the existing single-database mode remains available for earlier versions and other supported configurations. What you can do with multi-database link mode Migrate multiple databases to Azure SQL Managed Instance with minimal cutover downtime. Offload read-only workloads, including reporting and analytics, to the secondary replica. Use Azure SQL Managed Instance as a disaster recovery target for supported SQL Server versions. Start replication in either direction when the SQL Server version and Azure SQL Managed Instance update policy support that direction. Reverse primary and secondary roles through a planned failover. Build hybrid and multicloud topologies that place database groups where they are most useful. One link for an existing multi-database availability group If you already use an Always On availability group, multi-database link mode lets you extend the complete database group to Azure SQL Managed Instance without creating a separate availability group for every database. All databases in the link move together as one managed group. Databases on the primary are read-write, while their copies on the secondary are read-only. Use of your existing Always On AG listener endpoint is supported with multi-database mode MI link, allowing the link to remain operational after a local AG failover. Image 1: A multi-database Always On availability group replicated to Azure SQL Managed Instance through one Managed Instance link. The diagram illustrates the availability group relationship rather than a specific Azure SQL Managed Instance service-tier replica count. Managed Instance link is supported across all Azure SQL Managed Instance service tiers. Run multiple links in different directions A single SQL Server instance can participate in multiple links. Each link can carry a different availability group, and supported links can replicate in different directions at the same time. In the following example, AG1 (containing DB1, DB2, and DB3) replicates from SQL Server to Azure SQL Managed Instance through MI link 1. AG2 (containing DB4, DB5, and DB6) replicates from Azure SQL Managed Instance to SQL Server through MI link 2. Both links can operate at the same time between the two instances. Image 2: Two multi-database availability groups using separate links with opposite replication directions. Important: Database names must be unique in this configuration. A database cannot be renamed on the secondary while it is participating in replication to resolve a naming conflict. Replicate one availability group to multiple managed instances Multi-database mode also supports fan-out topologies. You can replicate multiple availability groups to one managed instance, or replicate the same availability group to different managed instances. For example, separate links can target managed instances in different Azure regions. Image 3: One multi-database availability group replicated through separate links to two Azure SQL managed instances. Preview requirements Requirement Details SQL Server SQL Server 2022 with CU27 or SQL Server 2025 with CU9 and above. Edition Enterprise or Developer edition. Standard edition supports basic availability groups with one database and is not supported for multi-database mode. Azure SQL Managed Instance Use a compatible update policy (2022 or 2025) matching your SQL Server version. SSMS SSMS 22.10.2 or later for the multi-database link capability. Automation Az module 16.3.0 or later and Az.Sql 7.1.0 or later, or the corresponding Azure APIs. Get started To evaluate multi-database mode during preview: Confirm that the SQL Server version, edition, servicing level, and Azure SQL Managed Instance update policy meet the preview requirements. Upgrade to SSMS 22.10.2 or later, or use a supported automation interface. Enable multi-database mode before creating a multi-database link. Create the link from the existing Always On availability group and validate synchronization for every database. Review the Azure documentation for multi-database Managed Instance link configuration, limitations, monitoring, failover, and cleanup guidance. Share your feedback We would love to hear about your experience with multi-database mode. Please share questions, feedback, and feature suggestions through the Managed Instance link feedback form.261Views0likes0CommentsSQLCon is Back: 5 Reasons to Attend the European Microsoft Fabric + SQL Community Conference
5 Reasons to Attend the European Microsoft Fabric + SQL Community Conference This year the SQL community joins Fabric in Europe for the first time at the Microsoft Fabric + SQL Community Conference happening September 28th - October 1st in Barcelona, Spain. Hear the latest announcements and roadmap directly from Microsoft leaders. With a full week of deep technical sessions and workshops covering the topics you care about most across and see how we’re helping solve your most pressing data challenges, from strengthening data sovereignty to powering agentic AI and unlocking trusted, actionable intelligence. And while there’s no shortage of topics, here are a couple of things we’re the most excited about heading to Barcelona: Unify your data (conference) experience With one registration, this event doubles your opportunity to sharpen your skillset with 130+ expert led sessions, workshops, and keynotes coming together in one high- impact week. Mix and match sessions to best meet your learning goals while you move seamlessly across tracks, visit the shared expo, and connect with peers in the community hub, all under one roof. The ultimate SQL experience, like only Microsoft can deliver With more than 25 dedicated SQL sessions, whether you’re a DBA or, a developer building AI apps, you can create your custom agenda with the topics you care about most. Pre-day programming is for the builders; bring your laptop and start your week with any of our full- day SQL workshops for the demos, practical guidance, and repeatable patterns you can start using immediately. Tuesday kicks off the official event with our opening keynote, three corenotes, and general sessions focused on SQL Server 2025, Azure SQL, and SQL in Fabric. Learn the latest in performance, tuning and tools like SSMS and VS Code delivered directly from SQL experts, MVPs, and community leaders. Ready to start building your agenda? Try our new session planner to curate your schedule based on your interests. The backdrop: Barcelona This year’s conference takes place in the historic, vibrant city of Barcelona, set along the Mediterranean Sea, the ideal setting for the first European SQLCon. When you’re ready for a break, you’re only a 15-minute ride away from the city center, perfect for exploring Gaudí’s iconic architecture or enjoying some local bites. Don’t miss the wrap- up celebration taking place in Barcelona’s exclusive Sutton Club. Community Connection SQLCon is more than just sessions; we’re bringing together more than 4,000 of the most dedicated Microsoft community members together for a week of endless connection opportunities. The Community Hub will bring some of our most popular experiences to life, from in-person meetups and user group connections to hands-on learning and certification opportunities all designed to help you grow your skills and expand your network. Launching Soon: SQLCon TV Enjoyed catching all the behind-the-scenes action on FabCon TV? In Barcelona we’ll bring SQLCon TV to the stage, with the content, demos, and interviews every SQL fan will want to see. Save your spot today. The earlier you register, the more opportunities you have to take advantage of early pricing specials. See you in Barcelona!365Views0likes2Comments
Public Preview: Performance monitoring for Azure SQL in Database Hub
We're excited to announce the public preview of performance monitoring for Azure SQL in Database Hub in Fabric. Performance monitoring brings the health and performance of your SQL estate into Database Hub. You see every supported database in one place and quickly spot the ones that need attention. It works across: Azure SQL Database Azure SQL Managed Instance (coming soon) SQL Server on Azure Virtual Machines SQL Server enabled by Azure Arc Microsoft collects performance-related telemetry, runs the pipeline, and stores the data for you. There's nothing you need to deploy and nothing to operate. Turn it on, and your SQL resources show up on the Performance page in Database Hub, which is free. This post is a deep dive on the performance part of Database Hub. For the full tour, including the Overview, Estate, and Security pages, read Database Hub in Fabric: Now in Public Preview. Get started in three steps Open Database Hub in Fabric. During the preview, a Fabric administrator needs to turn on the Database Hub tenant setting. See the prerequisites. Turn on performance monitoring for your SQL resources. See Enable performance monitoring for Microsoft SQL. Go to the Performance page to see which databases need your attention. See your entire database estate in Database Hub Performance monitoring powers the Performance page in Database Hub. Database Hub is built for when you need to look across all your databases, not just one at a time. It brings your database estate across Azure, on-premises, and other clouds into one place, including: Azure SQL and SQL Server enabled by Azure Arc Azure Database for PostgreSQL Azure Cosmos DB The Performance page comes with prebuilt dashboards, so you can see performance at a glance without building anything yourself. The dashboards are designed to quickly answer two questions: Are my databases healthy? Which ones need my attention? From there, you can drill into resource usage, waits, and session activity to understand what's driving a change in performance. With Database Hub, you can: Get estate-wide visibility into health and performance across database types Investigate the root cause of performance issues across many databases Use AI-assisted analysis to find and explain issues faster To learn more, see What is Database Hub in Fabric? Why we built this Monitoring SQL performance at scale often meant building and running your own monitoring stack. Before you could effectively answer, "Which of my databases need attention right now?" you typically had to: Deploy and configure a collection resource, such as a watcher or an agent Build a telemetry pipeline to move the data Provision a data store, and then pay for it, secure it, and keep it running Build dashboards on top of all of it Repeat for every new server, database, or region That's a lot of work before you see your first chart. And every step is another thing that can break, drift, or quietly stop collecting data. Customers are also turning to AI to make sense of their database estate. They want an AI agent that can spot a performance problem, explain what's causing it, and recommend a fix. But an AI agent is only as good as the data it can reach. It operates best with one consistent source of performance data across every database, not a patchwork of tools and data stores. We heard this feedback loud and clear from customers. You told us you love having at-scale dashboards and ownership of your performance data. You also told us that setting up a telemetry stack was time-consuming, scale limits got in the way, and running the data store added operational burden and cost overhead. One customer put it simply: they wanted to spend less time managing their telemetry infrastructure and more time managing and improving their databases. Performance monitoring keeps the parts you valued and removes the infrastructure you had to manage. That's why it feeds Database Hub directly. You get one place to see your whole estate, and your AI agents get one consistent source of performance data. No infrastructure to manage (or pay for) With performance monitoring, there's no monitoring infrastructure for you to deploy, size, or run. It's all managed by Microsoft, with no scale limits on how many targets you can monitor. Telemetry is collected close to the database engine and sent to a Microsoft-managed telemetry pipeline and data store. Access to that data is governed by Azure role-based access control (RBAC), so people only see telemetry for the resources they already have access to. Consistent telemetry across your SQL estate Performance monitoring collects the same core set of performance data across every supported SQL deployment, whether it runs in Azure, on-premises, or in another cloud. That means one mental model and one set of dashboards in Database Hub, instead of a different tool for every flavor of SQL. The preview collects performance-related telemetry, including: CPU and memory utilization Wait statistics Active sessions Storage I/O and database storage utilization Performance counters Client connections Database properties Availability group, replica, and database replica health Go beyond Database Hub with KQL Database Hub covers the most common performance questions. When you need a view that Database Hub doesn't show, you can query the same telemetry directly with Kusto Query Language (KQL). The telemetry is available through a Microsoft-managed, RBAC-governed endpoint, so you don't need to create or pay for your own Azure Data Explorer cluster. Use it to: Build your own Real-Time Dashboards and reports Connect tools you already use, such as Grafana or Power BI Give an AI agent access to investigate performance across your estate To get started, see Query performance monitoring telemetry. It includes the schema, connection steps, and ready-to-run starter queries. Turn on performance monitoring How you turn on performance monitoring depends on the resource type. For all of the steps in one place, see Enable performance monitoring for Microsoft SQL. Resource type How monitoring is enabled in preview Step-by-step guidance Azure SQL Database Add an extended property to each database you want to monitor. You can also select Enable Performance Monitoring in Database Hub. Azure SQL Database Azure SQL Managed Instance (coming soon) Coming soon Coming soon SQL Server on Azure VMs Turn on a feature flag in the SQL IaaS Agent extension. SQL Server on Azure VMs SQL Server enabled by Azure Arc On by default once the server is connected to Azure Arc. SQL Server enabled by Azure Arc To view performance monitoring data, you need: The Reader role, or a role with higher privileges, on each subscription that contains the resources you want to view. The Microsoft.AzureArcData resource provider registered on each subscription. For steps, see Register the Azure resource provider. Availability Performance monitoring is available in public preview in select Azure regions. For the current list of supported regions, see Regional availability and data handling. Learn more Database Hub in Fabric: Now in Public Preview What is Database Hub in Fabric? Enable performance monitoring for Microsoft SQL Query performance monitoring telemetry Supplemental Terms of Use for Microsoft Azure Previews1.1KViews2likes5CommentsStop defragmenting and start living: auto index compaction is now generally available
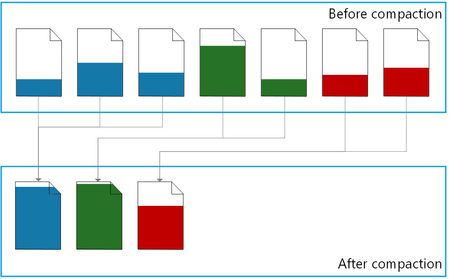
Executive summary Automatic index compaction is a built-in MSSQL database engine feature that compacts indexes in background and with minimal overhead. Now you can: Stop using scheduled index maintenance jobs. Reduce storage space consumption and save costs. Improve performance by reducing CPU, memory, and disk I/O consumption. Automatic index compaction is now generally available in Azure SQL Database, Azure SQL Managed Instance with the always-up-to-date update policy, and SQL database in Fabric. Index maintenance without maintenance jobs Enable automatic index compaction for a database with a single T-SQL command: ALTER DATABASE [database-name] SET AUTOMATIC_INDEX_COMPACTION = ON; Once enabled, you no longer need to set up, maintain, and monitor resource intensive index maintenance jobs, a time-consuming operational task for many DBA teams today. As the data in the database changes, a background process consolidates rows from partially filled data pages into a smaller number of filled up pages, and then removes the empty pages. Index bloat is eliminated – the same amount of data now uses a minimal amount of storage space. Resource consumption is reduced because the database engine needs fewer disk IOs and less CPU and memory to process the same amount of data. By design, the background compaction process acts on the recently modified pages only. This means that its own resource consumption is much lower compared to the traditional index maintenance operations (index rebuild and reorganize), which process all pages in an index or its partition. For a detailed description of how the feature works, a comparison between automatic index compaction and the traditional index maintenance operations, and the ways to monitor the compaction process, see automatic index compaction in documentation. Let the numbers speak As auto index compaction becomes generally available, it is already enabled in more than 6 million databases worldwide, most of them from Microsoft internal customers who helped validate the feature during preview. Hundreds of external customers also enabled auto compaction during preview and have been enjoying the benefits, with zero issues reported. Looking at our worldwide telemetry data for a 28-day window, automatic index compaction freed up approximately 14.3 petabytes of space in data files by consolidating 547.5 trillion rows on fewer pages, saving resources and improving query performance. Looking at the space freed up per database, the benefits range from a few megabytes per day for databases with already dense pages, to more than 500 gigabytes per day for databases that have gone through one-time extensive data modifications. Compaction in action To see the effects of automatic index compaction, we wrote a stored procedure that simulates a write-intensive OLTP workload. Each execution of the procedure inserts, updates, deletes, or selects a random number of rows, from 1 to 100, in a 50,000-row table with a clustered index. We executed this stored procedure using a popular SQLQueryStress tool, with 30 threads and 400 iterations on each thread. We measured the page density, the number pages in the leaf level of the table’s clustered index, and the number of logical reads (pages) used by a test query reading 1,000 rows, at three points in time: After initially inserting the data and before running the workload. Once the workload stopped running. Several minutes later, once the background process completed index compaction. Here are the results: Before workload After workload After compaction Logical reads 25 🟢 1,610 🔴⬆️ 35 🟢⬇️ Page density 99.51% 🟢 52.71% 🔴⬇️ 96.11% 🟢⬆️ Pages 962 🟢 4,394 🔴⬆️ 1,065 🟢⬇️ Before the workload starts, page density is high because nearly all pages are full. The number of logical reads required by the test query is minimal, and so is its resource consumption. The workload leaves a lot of empty space on pages and increases the number of pages because of row updates and deletions, and because of page splits. As a result, immediately after workload completion, the number of logical reads required for the same test query increases more than 60 times, which translates into a higher CPU and memory usage. But then within a few minutes, automatic index compaction removes the empty space from the index, increasing page density back to nearly 100%, reducing logical reads by about 98% and getting the index very close to its initial compact state. Less logical reads means that the query is faster and uses less CPU. All of this without any user action. With continuous workloads, index compaction is continuous as well, maintaining higher average page density and reducing resource usage by the workload over time. The T-SQL code we used in this demo is available in the Appendix. Conclusion Automatic index compaction delegates a routine database maintenance operation to the database engine itself, letting administrators and engineers focus on more important work without worrying about index maintenance. Making this feature generally available doesn’t mean that we stop working on it. Your feedback during preview helped us find new opportunities to fine-tune the compaction process. We thank you for that feedback and look forward to announcing new improvements in auto index compaction in the future. Appendix Here is the T-SQL code we used to demonstrate automatic index compaction. The type of executed statements and the number of affected rows is randomized to better represent an OLTP workload. While the results demonstrate the effectiveness of automatic index compaction, exact measurements may vary from one execution to the next. /* Enable automatic index compaction */ ALTER DATABASE CURRENT SET AUTOMATIC_INDEX_COMPACTION = ON; /* Reset to the initial state */ DROP TABLE IF EXISTS dbo.t; DROP SEQUENCE IF EXISTS dbo.s_id; DROP PROCEDURE IF EXISTS dbo.churn; /* Create a sequence to generate clustered index keys */ CREATE SEQUENCE dbo.s_id AS int START WITH 1 INCREMENT BY 1; /* Create a test table */ CREATE TABLE dbo.t ( id int NOT NULL CONSTRAINT df_t_id DEFAULT (NEXT VALUE FOR dbo.s_id), dt datetime2 NOT NULL CONSTRAINT df_t_dt DEFAULT (SYSDATETIME()), u uniqueidentifier NOT NULL CONSTRAINT df_t_uid DEFAULT (NEWID()), s nvarchar(100) NOT NULL CONSTRAINT df_t_s DEFAULT (REPLICATE('c', 1 + 100 * RAND())), CONSTRAINT pk_t PRIMARY KEY (id) ); /* Insert 50,000 rows */ INSERT INTO dbo.t (s) SELECT REPLICATE('c', 50) AS s FROM GENERATE_SERIES(1, 50000); GO /* Create a stored procedure that simulates a write-intensive OLTP workload. */ CREATE OR ALTER PROCEDURE dbo.churn AS SET NOCOUNT, XACT_ABORT ON; DECLARE @r float = RAND(CAST(CAST(NEWID() AS varbinary(4)) AS int)); /* Get the type of statement to execute */ DECLARE @StatementType char(6) = CASE WHEN @r <= 0.15 THEN 'insert' WHEN @r <= 0.30 THEN 'delete' WHEN @r <= 0.65 THEN 'update' WHEN @r <= 1 THEN 'select' ELSE NULL END; /* Get the maximum key value for the clustered index */ DECLARE @MaxKey int = ( SELECT CAST(current_value AS int) FROM sys.sequences WHERE name = 's_id' AND SCHEMA_NAME(schema_id) = 'dbo' ); /* Get a random key value within the key range */ DECLARE @StartKey int = 1 + RAND() * @MaxKey; /* Get a random number of rows, between 1 and 100, to modify or read */ DECLARE @RowCount int = 1 + RAND() * 99; /* Execute a statement */ IF @StatementType = 'insert' INSERT INTO dbo.t (id) SELECT NEXT VALUE FOR dbo.s_id FROM GENERATE_SERIES(1, @RowCount); IF @StatementType = 'delete' DELETE TOP (@RowCount) dbo.t WHERE id >= @StartKey; IF @StatementType = 'update' UPDATE TOP (@RowCount) dbo.t SET dt = DEFAULT, u = DEFAULT, s = DEFAULT WHERE id >= @StartKey; IF @StatementType = 'select' SELECT TOP (@RowCount) id, dt, u, s FROM dbo.t WHERE id >= @StartKey; GO /* The remainder of this script is executed three times: 1. Before running the workload using SQLQueryStress. 2. Immediately after the workload stops running. 3. Once automatic index compaction completes several minutes later. */ /* Monitor page density and the number of pages and records in the leaf level of the clustered index. */ SELECT avg_page_space_used_in_percent AS page_density, page_count, record_count FROM sys.dm_db_index_physical_stats(DB_ID(), OBJECT_ID('dbo.t'), 1, 1, 'DETAILED') WHERE index_level = 0; /* Run a test query and measure its logical reads. */ DROP TABLE IF EXISTS #t; SET STATISTICS IO ON; SELECT TOP (1000) id, dt, u, s INTO #t FROM dbo.t WHERE id >= 10000 SET STATISTICS IO OFF;7.2KViews3likes5CommentsSQL Data Sync – the final phase of retirement
SQL Data Sync has served customers well for many years, and we recognize that many teams rely on it. As operational, security, and compliance requirements have continued to evolve, we are progressing through the previously announced retirement in a way that gives customers time and guidance to transition. In 2024, we announced that SQL Data Sync will retire on September 30, 2027. As we enter the final year before retirement, we are moving to the next phase to help customers avoid new dependencies and focus on the transition. What is changing Starting on September 9, 2026, new SQL Data Sync deployments can no longer be created in Azure subscriptions that have not previously used the service. This change affects only Azure subscriptions that have never used SQL Data Sync. If your subscription already uses the service, nothing changes for you: you can continue to create, modify, and manage sync groups and member databases throughout the remaining retirement period. One year remains to complete transition We announced SQL Data Sync retirement three years in advance to provide customers with time to assess their dependencies, select an appropriate alternative, and complete the transition before the service is retired. With approximately one year remaining, we encourage customers who still rely on SQL Data Sync to begin or continue the transition work. We recognize that transitioning takes effort, and we are committed to helping you find the right fit. Depending on your topology, data volume, synchronization direction, and availability requirements, the transition can involve architectural evaluation, testing, and carefully planned execution. How to check whether you are using SQL Data Sync SQL Data Sync is organized around sync groups. Each sync group has an Azure SQL Database that serves as its hub database and one or more member databases. Member databases can be databases in Azure SQL Database or SQL Server instances. To check an individual Azure SQL Database in the Azure portal, assuming you have a handful of them: Sign in to the Azure portal. Type “Azure SQL Database” in the search field and select the service Select SQL databases from the menu Open listed Azure SQL Databases one by one. Under Data management, select Sync to other databases. Any related sync groups will be listed. If sync groups are listed, the database is configured as a SQL Data Sync hub. Review each sync group to identify its member databases, synchronization direction, schedule, and status. Organizations with many subscriptions, logical servers, or databases can perform a broader inventory across their Azure SQL Database estate. Azure PowerShell and Azure SQL management REST API can help automate discovery of sync groups by iterating through Azure SQL Database resources in subscriptions of a tenant. Choose an alternative based on your scenario SQL Data Sync was built on an earlier generation of synchronization technology. Newer Azure capabilities support a broader range of security, performance, and operational characteristics, so retirement is a good opportunity to reassess your use cases, reduce legacy dependencies, and adopt a modern solution aligned with latest security practices and your workload's current requirements. SQL Data Sync supports several scenarios, including synchronization between SQL Server and Azure SQL Database, distribution of data for reporting, and synchronization across regions. There is no single replacement that maps to every SQL Data Sync configuration, and the scenario-based guidance below maps each common configuration to a recommended path to help customers identify optimal path for each deployment. The appropriate replacement depends on several factors: Source and destination platforms One-way or bidirectional synchronization Acceptable synchronization latency Number of databases and synchronization topology Availability and disaster recovery requirements Data transformation and orchestration needs Data volume and throughput Depending on your scenario, alternatives may include: Azure Data Factory for scheduled, incremental, or orchestrated data movement. Transactional replication for one-way data distribution from SQL Server to Azure SQL Database. Always On availability groups or Managed Instance link for the reporting replicas of the entire database in SQL Server in Azure VM or Azure SQL Managed Instance, respectively. Active geo-replication or read replicas for read-scale and regional availability scenarios. Azure SQL trigger for Azure Functions for application-specific synchronization logic leveraging SQL binding. Mirroring in Fabric for analytics scenarios that require continuous replication of operational data in Microsoft Fabric. For detailed guidance organized by scenario and source and destination platform, see SQL Data Sync retirement: Migrate to alternative solutions. There are two more recommended reads with detailed description of ADF-based alternative solutions: Azure SQL Database Data Sync retirement: Migration scenarios and recommended alternatives Azure SQL Data Sync Retirement: Migration Insights and Modern Alternatives Recommended next steps If your organization currently uses SQL Data Sync: Inventory all SQL Data Sync deployments across your Azure subscriptions, including sync groups that are inactive. Identify the hub databases, member databases, on-premises sync agents, and dependent applications associated with each deployment. Document the business scenario, data flow direction, synchronization frequency, data throughput, latency and observability requirements, if you have not already done so. Use the guidance to identify suitable alternatives for each deployment. Configure and validate the replacement solution in a non-production environment. Temporarily disable Automatic Sync option for sync group during validation. Fully remove SQL Data Sync resources after confirming that the replacement solution is operating successfully and that applications no longer depend on the existing sync groups. If you have questions and have an Azure support plan, you can create a support request through the Azure portal. You can also ask questions through the Azure SQL Database community on Microsoft Q&A. Summary The SQL Data Sync retirement process is entering its final year. New SQL Data Sync deployments can no longer be created in Azure subscriptions that have not previously used the service. For subscriptions already using the service, functionality is unchanged, and sync groups can continue operating until the end of the retirement period. SQL Data Sync will retire on September 30, 2027. If your organization still depends on the service, now is a good time to identify your deployments, finalize your replacement architecture, and complete the transition.528Views0likes1Comment
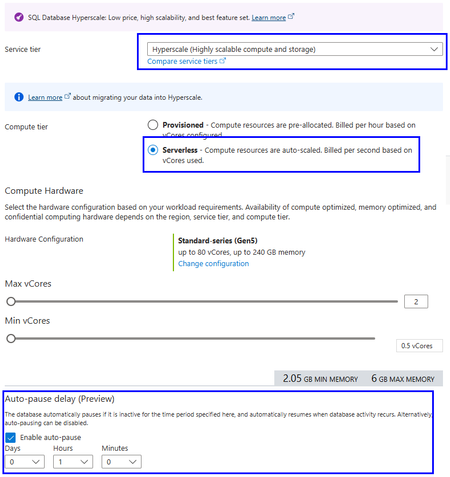
Public Preview: Auto-pause and auto-resume for Azure SQL Database Hyperscale Serverless
Auto-pause and auto-resume are now available in public preview for Azure SQL Database Hyperscale Serverless. You can now combine Hyperscale's independent scaling of compute and storage with the ability to automatically pause inactive databases, helping reduce compute costs for workloads with extended or predictable idle periods.266Views0likes0Comments
Announcing the public preview of Local Time Zone Support in Azure SQL Database
We are excited to announce the public preview of local time zone support in Azure SQL Database. You can now configure a time zone at the database level and override it for an individual session using T-SQL.172Views0likes0CommentsUnderstanding DevOps Auditing API Migration Behavior in Azure SQL Database
Background Historically, DevOps Auditing could be configured through the server-level auditing API using the isDevopsAuditEnabled property under: Microsoft.Sql/servers/auditingSettings As Azure SQL auditing capabilities evolved, a dedicated resource was introduced specifically for DevOps Auditing: Microsoft.Sql/servers/devOpsAuditingSettings This dedicated API is now the supported approach for configuring DevOps Auditing. The Question Customers occasionally observe that setting isDevopsAuditEnabled=true continues to work on some servers but not on others. A recent customer engagement highlighted this scenario where the same deployment was able to enable DevOps Auditing on most servers, while a smaller subset of servers ignored the setting even though the ARM operation completed successfully. At first glance, this appears inconsistent. However, the behavior is expected. How Backward Compatibility Works Today, Azure SQL maintains backward compatibility for customers who still use the legacy auditing API. The behavior is as follows: The recommended and supported approach is to use the dedicated DevOps Auditing resource: Microsoft.Sql/servers/devOpsAuditingSettings 2. The isDevopsAuditEnabled property under: Microsoft.Sql/servers/auditingSettings is no longer recommended for new implementations. 3. To preserve backward compatibility, the legacy property may continue to work for servers that have never been migrated to the new model. 4. Once the dedicated DevOps Auditing API is used on a server for the first time, that server is permanently marked as migrated. 5. After migration, the legacy isDevopsAuditEnabled property is no longer honoured for that server, even if it is supplied in subsequent requests. Why Some Servers Behave Differently Consider an environment with hundreds of Azure SQL servers managed through ARM templates or Azure Policy. The deployment may successfully update: { "type": "Microsoft.Sql/servers/auditingSettings", "properties": { "isDevopsAuditEnabled": true } } For servers that have never used the new DevOps Auditing resource, the setting may still take effect. For servers that were previously configured through: Microsoft.Sql/servers/devOpsAuditingSettings the server is already considered migrated. In these cases, the request can complete successfully, but the legacy property is ignored and DevOps Auditing remains unchanged. Recommended Action Customers should migrate all automation, ARM templates, Bicep templates, Terraform deployments, and Azure Policies to use the dedicated DevOps Auditing resource: Microsoft.Sql/servers/devOpsAuditingSettings and avoid relying on the legacy isDevopsAuditEnabled property going forward. Key Takeaway If isDevopsAuditEnabled appears to work for some servers but not others, it is usually due to the server's migration state: Not yet migrated → legacy flag may still work. Already migrated → legacy flag is ignored. Use Microsoft.SQL/servers/devOpsAuditingSettings for all future configurations. This behavior allows Azure SQL to maintain backward compatibility while providing a clear migration path to the dedicated DevOps Auditing configuration model. For the new API, refer documentation Server DevOps Audit Settings - Create Or Update - REST API (Azure SQL Database) | Microsoft Learn Server DevOps Audit Settings - Get - REST API (Azure SQL Database) | Microsoft Learn Microsoft.Sql/servers/devOpsAuditingSettings - Bicep, ARM template & Terraform AzAPI reference | Microsoft Learn322Views0likes0Comments