azure service fabric
52 TopicsMonitoring Azure Service Fabric with Azure Managed Grafana
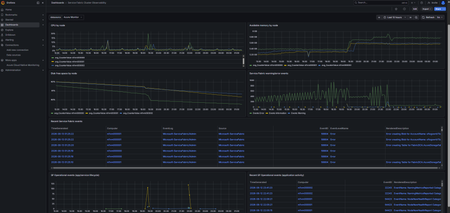
1. Why integrate Grafana with Service Fabric? Scope: this walkthrough covers a classic, VMSS-backed Service Fabric cluster running Windows. Service Fabric managed clusters (SFMC) use managed node types instead of VM scale sets, but the same AMA + DCR + Grafana pattern applies once AMA is installed on the managed node type. Linux node types use a different AMA data collection path (syslog instead of Windows Event Log channels) and aren't covered here. Grafana is valuable for Service Fabric customers who want a single operational view across cluster nodes, VM infrastructure, and Service Fabric platform events. Position Grafana as the visualization layer, while Azure Monitor and Log Analytics are the telemetry backbone. Grafana does not “monitor Service Fabric” by itself but it visualizes telemetry collected by Azure Monitor Agent (AMA) and stored in Log Analytics. Customer need Why Grafana helps Unified monitoring One dashboard for VM health, guest-OS counters, and Service Fabric platform events. Operations wallboard Easier to display and share with NOC/SRE teams than SFX that needs certificates and the team can mistakenly take actions from if they have admin permissions. Cross-service observability Teams already using Grafana for AKS/VMs/SQL can add Service Fabric beside them. Reusable dashboards Dashboard JSON can be exported, versioned, and reused across environments. Note: Small clusters with basic operations may be fine with Service Fabric Explorer (SFX) + the Azure portal. Also, Grafana is not a replacement for SFX, SF PowerShell, or the SF REST APIs, it's for observability, not cluster management. 2. Reference architecture The telemetry flow used in this repro: Service Fabric cluster nodes run on a Windows Virtual Machine scaleset (VMSS). Azure Monitor Agent (AMA) on the VMSS collects Windows performance counters and Service Fabric event channels. A Data Collection Rule (DCR) routes that telemetry to a Log Analytics workspace. Azure Managed Grafana queries Azure Monitor / Log Analytics through its managed identity (MI). A single dashboard combines infrastructure, guest-OS, and Service Fabric event views. 3. Prerequisites Install add-ons to your local Azure CLI so it understands commands specific to Grafana and Azure Monitor. Add the Azure Managed Grafana (AMG) extension. This allows you to run az grafana commands to create and configure your Grafana workspace. az extension add --name amg --only-show-errors 2. Add the extension for Data Collection Rules (DCRs) and endpoints. You need this to configure how telemetry data flows from your Service Fabric cluster to Azure Monitor. az extension add --name monitor-control-service --only-show-errors 3. Registering Resource Providers By default, Azure subscriptions do not have every possible service enabled. The az provider register commands tell Azure: "I am going to use these specific services in this subscription, so enable them." az provider register --namespace Microsoft.ServiceFabric --wait az provider register --namespace Microsoft.Insights --wait az provider register --namespace Microsoft.OperationalInsights --wait az provider register --namespace Microsoft.Dashboard --wait For this repro, I created a small Service Fabric cluster with 3 nodes that has a running app: 3 instances Running / provisioning Succeeded 4. Enable telemetry collection (AMA + DCR) Install Azure Monitor Agent on the VM scale set, then create and associate a Data Collection Rule. az vmss extension set -g rg-sf-grafana-repro --vmss-name nt1vm --name AzureMonitorWindowsAgent --publisher Microsoft.Azure.Monitor --enable-auto-upgrade true Important Note: the VMSS MUST have a managed identity (MI), or the AMA won't authenticate and no data flows. Note: both system-assigned and user-assigned managed identities are supported – assign the identity before installing the AMA extension, as done below. See the Azure Monitor Agent requirements. az vmss identity assign -g rg-sf-grafana-repro -n nt1vm The DCR collects CPU/memory/disk/network counters, Windows Application/System warnings and errors, and the Service Fabric Admin + Operational event channels. This next block is where the actual monitoring pipeline gets wired up. It configures AMA to start capturing the specific metrics and logs you care about from your SF nodes. az monitor data-collection rule create -g rg-sf-grafana-repro --location westus2 --name dcr-sfg08120632 --rule-file dcr-servicefabric-windows.json The full dcr-servicefabric-windows.json used in this repro, along with the dashboard JSON, ARM template, and all deployment scripts, is available in this GitHub repo so this is reproducible: https://github.com/AhmedKhaledAbdalla/Azure-Service-Fabric-Grafana-Integration --rule-file dcr-servicefabric-windows.json: This is the most critical part. Azure CLI reads this local JSON file, which contains the actual configuration you mentioned. It defines exactly what to collect (the CPU/memory counters, Windows Event logs, and Service Fabric Admin/Operational channels) and where to send that data (your Log Analytics Workspace). az monitor data-collection rule association create --resource <vmss-resource-id> --name assoc-dcr --rule-id <dcr-resource-id> Creating a rule doesn't do anything on its own until you apply it to a resource. This command creates a Data Collection Rule Association (DCRA). What happens behind the scenes: When you create this association, the Azure Monitor Agent running on your Service Fabric VMSS nodes detects the new rule. The agents download the dcr-servicefabric-windows.json instructions, begin collecting the specified performance counters and the selected Windows Event Log channels, and start streaming that data into Azure Monitor. The event channels collected (XPath queries in the DCR). These XPath queries are the exact filtering rules your Data Collection Rule (DCR) uses to tell the Azure Monitor Agent which Windows Event Logs to capture and which ones to ignore. By filtering at the source (on the VM itself), you save on ingestion costs and reduce noise in your Log Analytics workspace. Application!*[System[(Level=1 or Level=2 or Level=3)]] System!*[System[(Level=1 or Level=2 or Level=3)]] Microsoft-ServiceFabric/Admin!*[System[(Level=1 or Level=2 or Level=3 or Level=4)]] Microsoft-ServiceFabric/Operational!*[System[(Level=1 or Level=2 or Level=3 or Level=4)]] Here is a breakdown of what those specific queries are collecting: Standard Windows Logs: Application!*[System[(Level=1 or Level=2 or Level=3)]]: Captures events from the Windows Application log, but only if they are Critical (Level 1), Error (Level 2), or Warning (Level 3). System!*[System[(Level=1 or Level=2 or Level=3)]]: Captures events from the Windows System log, applying the same filter for Critical, Error, and Warning events. Notice that these exclude Level 4 (Information) and Level 5 (Verbose) events, which happen constantly and would unnecessarily bloat your log storage. Service Fabric Specific Logs: Microsoft-ServiceFabric/Admin!*[System[(Level=1 or Level=2 or Level=3 or Level=4)]]: Captures Admin channel events for Service Fabric. Because these are critical to understanding cluster health, it includes Information (Level 4) events alongside Warnings, Errors, and Criticals. Microsoft-ServiceFabric/Operational!*[System[(Level=1 or Level=2 or Level=3 or Level=4)]]: Captures Operational channel events (like node up/down, application deployment success/failure) using the same Level 1-4 filter. 5. Deploy Grafana and grant access This step represents the final infrastructure deployment for your repro: provisioning the visualization layer (AMG) and securely connecting it to the data we started collecting in the previous steps. 1- Provisioning Azure Managed Grafana (AMG): az grafana create -g rg-sf-grafana-repro --location westus2 --name amg-sfg08120632 --zone-redundancy Disabled 2- Wiring Up Permissions (The Manual Workaround) When you create an Azure Managed Grafana instance, Azure automatically creates a System-Assigned Managed Identity for it. Think of this as a "service account" that Grafana uses to talk to other Azure resources securely without needing passwords. The next commands grant the necessary permissions for the data to flow and for you to log in. Role 1: Monitoring Reader (Grafana's Identity) az role assignment create --assignee <grafana-mi-principal-id> --role "Monitoring Reader" --scope <resource-group-id> Note: by default, Azure Managed Grafana already gets Monitoring Reader on creation, and that single role is sufficient to query both Azure Monitor metrics and Log Analytics logs (Grafana permissions docs). A separate Log Analytics Reader assignment is normally redundant; we recreated Monitoring Reader manually above because the automatic role assignment failed in this repro (see below), scoped to the resource group. For teammates who only need to view the dashboard, assign the built-in Grafana Viewer role instead of Grafana Admin. Role 2: Grafana Admin (Your User Identity) az role assignment create --assignee <your-user-id> --role "Grafana Admin" --scope <grafana-resource-id> This one is for you, not the Grafana service. Even if you are the Subscription Owner who created the resource, Azure Managed Grafana has its own internal data plane authorization. This command guarantees that when you navigate to the Grafana URL in your web browser, you have full administrative rights to build dashboards, add data sources, and manage the workspace. 6. Import the dashboard az grafana dashboard import -g rg-sf-grafana-repro -n amg-sfg08120632 --definition dashboard-servicefabric-grafana.json --overwrite true Now that the data is being collected and Grafana has the permissions to read it, this command actually builds the visualization layer. Instead of manually clicking through the Grafana UI to create graphs, panels, and queries one by one, this command automates the deployment of a pre-built dashboard. --definition @dashboard-servicefabric-grafana.json: This is the payload. The @ symbol is critical here. it tells the Azure CLI, "Do not treat this as a string; open this local file and read its contents." This JSON file contains the entire blueprint for your dashboard, including the layout of the panels, the KQL queries used to fetch those Service Fabric Admin/Operational events, and the formatting rules. See the same GitHub repo for dashboard-servicefabric-grafana.json . Dashboard panels: Panel Source Purpose CPU by node Perf Detect overloaded nodes. Available memory by node Perf Spot memory pressure affecting replicas/services. Disk free space by node Perf Watch capacity before disks fill. SF warning/error events Event Trend platform warnings and errors. Recent SF events Event Troubleshoot recent cluster/node issues. SF Operational events Event Application/service lifecycle activity. First capture immediately after import, panels show ‘No data’ because AMA telemetry takes ~10–15 mins to appear (and only after the managed-identity fix) Once telemetry flows, the same dashboard populates with data across all three nodes: Dashboard with live data: CPU, memory, disk, and SF events per node If you have a deployed app in your cluster, the application appears in the portal and its lifecycle events flow through the Operational channel into Log Analytics and onto the dashboard: 7. Useful KQL queries 1. Tracking CPU Utilization per Node Perf | where ObjectName == "Processor" and CounterName == "% Processor Time" and InstanceName == "_Total" | summarize AvgCpu = avg(CounterValue) by bin(TimeGenerated, 5m), Computer This query targets the standard Windows performance counters collected by the Azure Monitor Agent. 2. Auditing Service Fabric Lifecycle Events Event | where EventLog == "Microsoft-ServiceFabric/Operational" | project TimeGenerated, Computer, EventID, RenderedDescription | order by TimeGenerated desc 3. Visualizing Cluster Health and Error Spikes Event | where EventLog startswith "Microsoft-ServiceFabric" | summarize count() by bin(TimeGenerated, 5m), EventLevelName 8. Validate the pipeline Before trusting the dashboard, confirm each stage of the pipeline in order as a broken step upstream will silently make the dashboard look "empty" for the wrong reason. 1- AMA extension is installed on the VMSS. In the portal, open the VM scale set → Settings (Extensions + applications), and confirm AzureMonitorWindowsAgent shows Provisioning succeeded. Or from CLI: az vmss extension list -g rg-sf-grafana-repro --vmss-name nt1vm --query "[].{Name:name, State:provisioningState}" 2- DCR is associated with the VMSS. The Data Collection Rule must have exactly one connected resource (the VMSS). In the portal, open the DCR → Resources: az monitor data-collection rule association list --resource <vmss-resource-id> 3- Telemetry is actually landing in Log Analytics. Open the workspace → Logs, and run each of these and you should see rows within the last hour: Heartbeat | where TimeGenerated > ago(1h) | summarize count() by Computer Perf | where TimeGenerated > ago(1h) | summarize count() by ObjectName Event | where TimeGenerated > ago(1h) | summarize count() by EventLog If Heartbeat is empty, AMA isn't authenticating (usually the missing managed identity). If Heartbeat is fine but Perf/Event is empty, the DCR isn't matching what you expect. 4- Grafana's managed identity has the right role. In the portal, open the Managed Grafana instance → Access control (IAM) → Role assignments, and confirm the system-assigned identity has Monitoring Reader at the subscription/RG/workspace scope you expect. 5- Dashboard time range is wide enough. Set the dashboard to Last 1 hour (or wider), the default "Last 5 minutes" will look empty even when everything is working, since AMA batches data. The ~10–15-minute figure elsewhere in this article is latency observed in this repro after fixing the managed-identity issue, not a guaranteed SLA. In practice, first data lands anywhere from a couple of minutes to ~15 minutes after AMA authenticates. 9. Real failures encountered (and fixes) Empty Grafana panels: missing VMSS managed identity After AMA + DCR were correctly configured, panels stayed empty and no Perf/Event/Heartbeat rows appeared in Log Analytics. Root cause: the template-created VM scale set had NO managed identity, so Azure Monitor Agent could not authenticate to Azure Monitor. Fix: az vmss identity assign -g <rg> -n <vmss> Data started flowing ~10–15 minutes later. Grafana CLI role-assignment API error 'az grafana create' created the instance but then crashed with 'APIVersion 2022-04-01 is not available' while auto-creating role assignments. The instance is fine; create the role assignments manually (Monitoring Reader, Log Analytics Reader, Grafana Admin). We hit this with Azure CLI 2.40.0 and amg extension version 1.3.6, run: az extension update --name amg first, as this may already be fixed in a newer release. So, when you run the manual az role assignment create commands, you are bypassing that specific auto-assignment code path in the amg extension. Instead, you are using the core Azure CLI's role assignment engine directly, which is a reliable workaround regardless of the root cause. 10. Cost and cleanup This repro uses paid Azure services, and leaving it running has an ongoing cost. Two components dominate: Log Analytics bills for data ingestion (GB ingested per day) and data retention (GB stored beyond the free 30-day window). Verbose event channels and short bin intervals both push ingestion up quickly. See Log Analytics pricing. Azure Managed Grafana has two tiers: Essential (lower cost, fewer active users, no zone redundancy) and Standard (per-instance hourly rate + per-active-user fee). See Azure Managed Grafana pricing. Check the current pricing in your region before enabling this in production, and delete the whole repro resource group when you're done: az group delete --name rg-sf-grafana-repro --yes --no-wait References: Service Fabric diagnostics with AMA and DCRs Azure Monitor Agent requirements Azure Managed Grafana permissions Import a Grafana dashboard245Views0likes0Comments
How Do You Handle Multiple Server Certificate Thumbprints in Azure Service Fabric Managed Clusters?
Hi everyone, I wanted to share a common challenge we’ve encountered in DevOps pipelines when working with Azure Service Fabric Managed Clusters (SFMC) — and open it up for discussion to hear how others are handling it. 🔍 The Issue When retrieving the cluster certificate thumbprints using PowerShell: (Get-AzResource -ResourceId "/subscriptions/<SUBSCRIPTION_ID>/resourceGroups/<RG_NAME>/providers/Microsoft.ServiceFabric/managedclusters/<CLUSTER_NAME>").Properties.clusterCertificateThumbprints …it often returns multiple thumbprints. This typically happens due to certificate renewals or rollovers. Including all of them in your DevOps configuration isn’t practical. ✅ What Worked for Us We’ve had success using the last thumbprint in the list, assuming it’s the most recently active certificate: (Get-AzResource -ResourceId "/subscriptions/<SUBSCRIPTION_ID>/resourceGroups/<RG_NAME>/providers/Microsoft.ServiceFabric/managedclusters/<CLUSTER_NAME>").Properties.clusterCertificateThumbprints | Select-Object -Last 1 This approach has helped us maintain stable and secure connections in our pipelines. 🔍 Solution 2: Get current Server Certificate You can also verify the active certificate using OpenSSL: openssl s_client -connect <MyCluster>.<REGION>.cloudapp.azure.com:19080 -servername <MyCluster>.<REGION>.cloudapp.azure.com | openssl x509 -noout -fingerprint -sha1 🛠️ Tip for New Deployments If you're deploying a new SFMC, consider setting the following property in your ARM or Bicep template: "autoGeneratedDomainNameLabelScope": "ResourceGroupReuse" This ensures the domain name is reused within the resource group, which helps reduce certificate churn and keeps the thumbprint list clean and manageable. ⚠️ Note: This setting only applies during initial deployment and cannot be retroactively applied to existing clusters.141Views0likes0CommentsGuidance for Certificate Use in CI/CD Pipelines for Service Fabric
In non-interactive CI/CD scenarios where certificates are used to authenticate with Azure Service Fabric, consider the following best practices: Use Admin Certificates Instead of Cluster Certificates Cluster certificates are used for node-to-node and cluster-level authentication and are highly privileged. For CI/CD pipelines, prefer using a dedicated Admin client certificate: Grants administrative access only at the client level. Limits the blast radius in case of exposure. Easier to rotate or revoke without impacting cluster internals. Best practices to protect your service fabric certificates: - Provision a dedicated Service Fabric Admin certificate specifically for the CI/CD pipeline instead of cluster certificate. This certificate should not be reused across other services or users. - Restrict access to this certificate strictly to the pipeline environment. It should never be distributed beyond what is necessary. - Secure the pipeline itself, as it is part of the cluster’s supply chain and a high-value target for attackers. - Implement telemetry and monitoring to detect potential exposure—such as unauthorized access to the CI/CD machine or unexpected distribution of the certificate. - Establish a revocation and rotation plan to quickly respond if the certificate is compromised.162Views0likes0CommentsPreserve Disk space in ImageStore for Service Fabric Managed Clusters
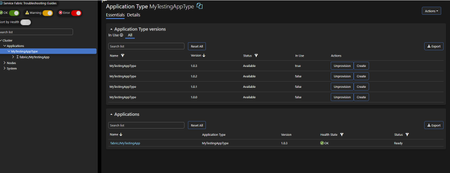
As mentioned in this article: Service Fabric: Best Practices to preserve disk space in Image Store ImageStore keeps copied packages and provisioned packages. In this article, we will discuss how can you configure cleaning up the copied application package for Service Fabric Managed Cluster 'SFMC'. The mitigation is to set "AllowRuntimeCleanupUnusedApplicationTypesPolicy": "true". For properties, specify the following tags: ... "applicationTypeVersionsCleanupPolicy": { "maxUnusedVersionsToKeep": 3 } Let me show you a step-by-step guide to automatically remove the unwanted application versions in your Service Fabric Managed cluster below: Scenario: - I have deployed 4 versions of my app (1 InUse - 3 UnUsed) to my managed cluster as the following: Symptom: I need Service Fabric to do automatic cleanup for the Application Unused Versions and keep only the last 3 so as not to fill the disk space. Mitigation Steps: From https://resources.azure.com/ open your managed cluster resource and open the read/write mode. Add the tag "AllowRuntimeCleanupUnusedApplicationTypesPolicy": "true" Under fabricsettings, add the param "name": "CleanupUnusedApplicationTypes", "value": "true" under fabricsettings and set the "maxUnusedVersionsToKeep": 3 Click on PUT to save the changes, and I deployed the 5th version (1.0.4) to the cluster, which should make the cleaning happens for the oldest version (1.0.0) Note: The automatic clean-up should be effective after 24 hours of making those changes. Then I tried to deploy a new version, and I could see that the oldest version was also cleaned up. For manual cleanup of the ImageStoreService: You can use PowerShell commands to delete copied packages and unregister application types as needed. This includes using Get-ServiceFabricImageStoreContent to retrieve content and Remove-ServiceFabricApplicationPackage to delete it, as well as Unregister-ServiceFabricApplicationType to remove application packages from the image store and image cache on nodes.2.3KViews0likes0Comments
Azure Logic Apps : HTTP Request OR Custom Connector
Hello, As far as I know, We use HTTP requests while consuming the First-party/third-party API, then when should we use a custom connector? What are those business cases where one should use an HTTP request in PowerAutomate and use in PowerApps Or use a custom connector and use in PowerApps and Power Automate? What are the pros and cons of HTTP Request OR Custom Connector? Thanks and Regards, -Sri965Views0likes1Comment
Installing AzureMonitoringAgent and linking it to your Log Analytics Workspace
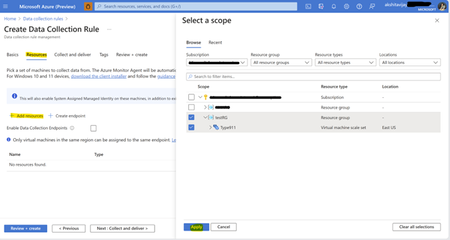
The current Service Fabric clusters are currently equipped with the MicrosoftMonitoringAgent (MMA) as the default installation. However, it is essential to note that MMA will be deprecated in August 2024, for more details refer- We're retiring the Log Analytics agent in Azure Monitor on 31 August 2024 | Azure updates | Microsoft Azure. Therefore, if you are currently utilizing MMA, it is imperative to initiate the migration process to AzureMonitoringAgent (AMA). Installation and Linking of AzureMonitoringAgent to a Log Analytics Workspace: Create a Log Analytics Workspace (if not already established): Access the Azure portal and search for "Log Analytics Workspace." Proceed to create a new Log Analytics Workspace. Ensure that you select the identical resource group and geographical region where your cluster is located. Detailed explanation: Create Log Analytics workspaces - Azure Monitor | Microsoft Learn Create Data Collection Rules: Access the Azure portal and search for "Data Collection Rules (DCR)”. Select the same resource group and region as of your cluster. In Platform type, select the type of instance you have like Windows, Linux or both. You can leave data collection endpoint as blank. In the resources section, add the Virtual machine Scale Set (VMSS) resource which is attached to the Service fabric cluster. In the "Collect and deliver" section, click on Add data source and add both Performance Counters and Windows Event Logs one by one. Choose the destination for both the data sources as Azure Monitor Logs and in the Account or namespace dropdown, select the name of the Log Analytics workspace that we have created in step 1 and click on Add data source. Next click on review and create. Note: - For more detailed explanation on how to create DCR and various ways of creating it, you can follow - Collect events and performance counters from virtual machines with Azure Monitor Agent - Azure Monitor | Microsoft Learn Adding the VMSS instances resource with DCR: Once the DCR is created, in the left panel, click on Resources. Check if you can see the VMSS resource that we have added while creating DCR or not. If not then, click on "Add" and navigate to the VMSS attached to service fabric cluster and click on Apply. Refresh the resources tab to see whether you can see VMSS in the resources section or not. If not, try adding a couple of times if needed. Querying Logs and Verifying AzureMonitoringAgent Setup: Please allow for 10-15 minutes waiting period before proceeding. After this time has elapsed, navigate to your Log Analytics workspace, and access the 'Logs' section by scrolling through the left panel. Run your queries to see the logs. For example, query to check the heartbeat of all instances:Heartbeat | where Category contains "Azure Monitor Agent" | where OSType contains "Windows" You will see the logs there in the bottom panel as shown in the above screenshot. Also, you can modify the query as per your requirement. For more details related to Log Analytics queries, you can refer- Log Analytics tutorial - Azure Monitor | Microsoft Learn Perform the uninstallation of the MicrosoftMonitoringAgent (MMA): Once you have verified that the logs are getting generated, you can go to Virtual Machine Scale Set and then to the "Extensions + applications" section and delete the old MMA extension from VMSS.5.8KViews4likes2Comments
Service Fabric Explorer (SFX) web client CVE-2023-23383 spoofing vulnerability
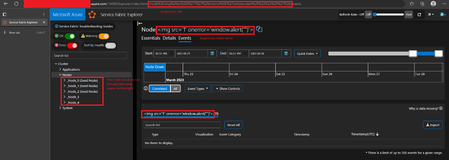
Service Fabric Explorer (SFX) is the web client used when accessing a Service Fabric (SF) cluster from a web browser. The version of SFX used is determined by the version of your SF cluster. We are providing this blog to make customers aware that running Service Fabric versions 9.1.1436.9590 and below are affected. These versions could potentially allow unwanted code execution in the cluster if an attacker can successfully convince a victim to click a malicious link and perform additional actions in the Service Fabric Explorer interface. This issue has been resolved in Service Fabric 9.1.1583.9589 released on March 14th, 2023, as CVE-2023-23383 which had a score of CVSS: 8.2 / 7.1. See the Technical Details section for more information.6.1KViews1like0Comments
Common causes of SSL/TLS connection issues and solutions
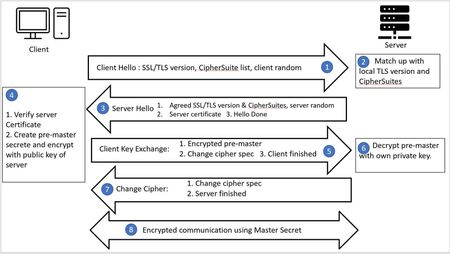
In the TLS connection common causes and troubleshooting guide (microsoft.com) and TLS connection common causes and troubleshooting guide (microsoft.com), the mechanism of establishing SSL/TLS and tools to troubleshoot SSL/TLS connection were introduced. In this article, I would like to introduce 3 common issues that may occur when establishing SSL/TLS connection and corresponding solutions for windows, Linux, .NET and Java. TLS version mismatch Cipher suite mismatch TLS certificate is not trusted TLS version mismatch Before we jump into solutions, let me introduce how TLS version is determined. As the dataflow introduced in the first session(https://techcommunity.microsoft.com/t5/azure-paas-blog/ssl-tls-connection-issue-troubleshooting-guide/ba-p/2108065), TLS connection is always started from client end, so it is client proposes a TLS version and server only finds out if server itself supports the client's TLS version. If the server supports the TLS version, then they can continue the conversation, if server does not support, the conversation is ended. Detection You may test with the tools introduced in this blog(TLS connection common causes and troubleshooting guide (microsoft.com)) to verify if TLS connection issue was caused by TLS version mismatch. If capturing network packet, you can also view TLS version specified in Client Hello. If connection terminated without Server Hello, it could be either TLS version mismatch or Ciphersuite mismatch. Solution Different types of clients have their own mechanism to determine TLS version. For example, Web browsers - IE, Edge, Chrome, Firefox have their own set of TLS versions. Applications have their own library to define TLS version. Operating system level like windows also supports to define TLS version. Web browser In the latest Edge and Chrome, TLS 1.0 and TLS 1.1 are deprecated. TLS 1.2 is the default TLS version for these 2 browsers. Below are the steps of setting TLS version in Internet Explorer and Firefox and are working in Window 10. Internet Explorer Search Internet Options Find the setting in the Advanced tab. Firefox Open Firefox, type about:config in the address bar. Type tls in the search bar, find the setting of security.tls.version.min and security.tls.version.max. The value is the range of supported tls version. 1 is for tls 1.0, 2 is for tls 1.1, 3 is for tls 1.2, 4 is for tls 1.3. Windows System Different windows OS versions have different default TLS versions. The default TLS version can be override by adding/editing DWORD registry values ‘Enabled’ and ‘DisabledByDefault’. These registry values are configured separately for the protocol client and server roles under the registry subkeys named using the following format: <SSL/TLS/DTLS> <major version number>.<minor version number><Client\Server> For example, below is the registry paths with version-specific subkeys: Computer\HKEY_LOCAL_MACHINE\SYSTEM\CurrentControlSet\Control\SecurityProviders\SCHANNEL\Protocols\TLS 1.2\Client For the details, please refer to Transport Layer Security (TLS) registry settings | Microsoft Learn. Application that running with .NET framework The application uses OS level configuration by default. For a quick test for http requests, you can add the below line to specify the TLS version in your application before TLS connection is established. To be on a safer end, you may define it in the beginning of the project. ServicePointManager.SecurityProtocol = SecurityProtocolType.Tls12 Above can be used as a quick test to verify the problem, it is always recommended to follow below document for best practices. https://docs.microsoft.com/en-us/dotnet/framework/network-programming/tls Java Application For the Java application which uses Apache HttpClient to communicate with HTTP server, you may check link How to Set TLS Version in Apache HttpClient | Baeldung about how to set TLS version in code. Cipher suite mismatch Like TLS version mismatch, CipherSuite mismatch can also be tested with the tools that introduced in previous article. Detection In the network packet, the connection is terminated after Client Hello, so if you do not see a Server Hello packet, that indicates either TLS version mismatch or ciphersuite mismatch. If server is supported public access, you can also test using SSLLab(https://www.ssllabs.com/ssltest/analyze.html) to detect all supported CipherSuite. Solution From the process of establishing SSL/TLS connections, the server has final decision of choosing which CipherSuite in the communication. Different Windows OS versions support different TLS CipherSuite and priority order. For the supported CipherSuite, please refer to Cipher Suites in TLS/SSL (Schannel SSP) - Win32 apps | Microsoft Learn for details. If a service is hosted in Windows OS. the default order could be override by below group policy to affect the logic of choosing CipherSuite to communicate. The steps are working in the Windows Server 2019. Edit group policy -> Computer Configuration > Administrative Templates > Network > SSL Configuration Settings -> SSL Cipher Suite Order. Enable the configured with the priority list for all cipher suites you want. The CipherSuites can be manipulated by command as well. Please refer to TLS Module | Microsoft Learn for details. TLS certificate is not trusted Detection Access the url from web browser. It does not matter if the page can be loaded or not. Before loading anything from the remote server, web browser tries to establish TLS connection. If you see the error below returned, it means certificate is not trusted on current machine. Solution To resolve this issue, we need to add the CA certificate into client trusted root store. The CA certificate can be got from web browser. Click warning icon -> the warning of ‘isn’t secure’ in the browser. Click ‘show certificate’ button. Export the certificate. Import the exported crt file into client system. Windows Manage computer certificates. Trusted Root Certification Authorities -> Certificates -> All Tasks -> Import. Select the exported crt file with other default setting. Ubuntu Below command is used to check current trust CA information in the system. awk -v cmd='openssl x509 -noout -subject' ' /BEGIN/{close(cmd)};{print | cmd}' < /etc/ssl/certs/ca-certificates.crt If you did not see desired CA in the result, the commands below are used to add new CA certificates. $ sudo cp <exported crt file> /usr/local/share/ca-certificates $ sudo update-ca-certificates RedHat/CentOS Below command is used to check current trust CA information in the system. awk -v cmd='openssl x509 -noout -subject' ' /BEGIN/{close(cmd)};{print | cmd}' < /etc/pki/ca-trust/extracted/pem/tls-ca-bundle.pem If you did not see desired CA in the result, the commands below are used to add new CA certificates. sudo cp <exported crt file> /etc/pki/ca-trust/source/anchors/ sudo update-ca-trust Java The JVM uses a trust store which contains certificates of well-known certification authorities. The trust store on the machine may not contain the new certificates that we recently started using. If this is the case, then the Java application would receive SSL failures when trying to access the storage endpoint. The errors would look like the following: Exception in thread "main" java.lang.RuntimeException: javax.net.ssl.SSLHandshakeException: PKIX path building failed: sun.security.provider.certpath.SunCertPathBuilderException: unable to find valid certification path to requested target at org.example.App.main(App.java:54) Caused by: javax.net.ssl.SSLHandshakeException: PKIX path building failed: sun.security.provider.certpath.SunCertPathBuilderException: unable to find valid certification path to requested target at java.base/sun.security.ssl.Alert.createSSLException(Alert.java:130) at java.base/sun.security.ssl.TransportContext.fatal(TransportContext.java:371) at java.base/sun.security.ssl.TransportContext.fatal(TransportContext.java:314) at java.base/sun.security.ssl.TransportContext.fatal(TransportContext.java:309) Run the below command to import the crt file to JVM cert store. The command is working in the JDK 19.0.2. keytool -importcert -alias <alias> -keystore "<JAVA_HOME>/lib/security/cacerts" -storepass changeit -file <crt_file> Below command is used to export current certificates information in the JVM cert store. keytool -keystore " <JAVA_HOME>\lib\security\cacerts" -list -storepass changeit > cert.txt The certificate will be displayed in the cert.txt file if it was imported successfully.58KViews4likes0Comments