An end-to-end, repro-backed guide: from a 3-node windows cluster to a live observability dashboard
1. Why integrate Grafana with Service Fabric?
Scope: this walkthrough covers a classic, VMSS-backed Service Fabric cluster running Windows. Service Fabric managed clusters (SFMC) use managed node types instead of VM scale sets, but the same AMA + DCR + Grafana pattern applies once AMA is installed on the managed node type. Linux node types use a different AMA data collection path (syslog instead of Windows Event Log channels) and aren't covered here.
Grafana is valuable for Service Fabric customers who want a single operational view across cluster nodes, VM infrastructure, and Service Fabric platform events. Position Grafana as the visualization layer, while Azure Monitor and Log Analytics are the telemetry backbone. Grafana does not “monitor Service Fabric” by itself but it visualizes telemetry collected by Azure Monitor Agent (AMA) and stored in Log Analytics.
|
Customer need |
Why Grafana helps |
|
Unified monitoring |
One dashboard for VM health, guest-OS counters, and Service Fabric platform events. |
|
Operations wallboard |
Easier to display and share with NOC/SRE teams than SFX that needs certificates and the team can mistakenly take actions from if they have admin permissions. |
|
Cross-service observability |
Teams already using Grafana for AKS/VMs/SQL can add Service Fabric beside them. |
|
Reusable dashboards |
Dashboard JSON can be exported, versioned, and reused across environments. |
Note: Small clusters with basic operations may be fine with Service Fabric Explorer (SFX) + the Azure portal. Also, Grafana is not a replacement for SFX, SF PowerShell, or the SF REST APIs, it's for observability, not cluster management.
2. Reference architecture
The telemetry flow used in this repro:
- Service Fabric cluster nodes run on a Windows Virtual Machine scaleset (VMSS).
- Azure Monitor Agent (AMA) on the VMSS collects Windows performance counters and Service Fabric event channels.
- A Data Collection Rule (DCR) routes that telemetry to a Log Analytics workspace.
- Azure Managed Grafana queries Azure Monitor / Log Analytics through its managed identity (MI).
- A single dashboard combines infrastructure, guest-OS, and Service Fabric event views.
3. Prerequisites
- Install add-ons to your local Azure CLI so it understands commands specific to Grafana and Azure Monitor.
Add the Azure Managed Grafana (AMG) extension. This allows you to run az grafana commands to create and configure your Grafana workspace.
az extension add --name amg --only-show-errors 2. Add the extension for Data Collection Rules (DCRs) and endpoints. You need this to configure how telemetry data flows from your Service Fabric cluster to Azure Monitor.
az extension add --name monitor-control-service --only-show-errors3. Registering Resource Providers
By default, Azure subscriptions do not have every possible service enabled. The az provider register commands tell Azure: "I am going to use these specific services in this subscription, so enable them."
az provider register --namespace Microsoft.ServiceFabric --wait
az provider register --namespace Microsoft.Insights --wait
az provider register --namespace Microsoft.OperationalInsights --wait
az provider register --namespace Microsoft.Dashboard --wait
For this repro, I created a small Service Fabric cluster with 3 nodes that has a running app:
Service Fabric Cluster with 3 nodes and a running appVMSS with 3 instances Running / provisioning Succeeded4. Enable telemetry collection (AMA + DCR)
Install Azure Monitor Agent on the VM scale set, then create and associate a Data Collection Rule.
az vmss extension set -g rg-sf-grafana-repro --vmss-name nt1vm --name AzureMonitorWindowsAgent --publisher Microsoft.Azure.Monitor --enable-auto-upgrade trueImportant Note: the VMSS MUST have a managed identity (MI), or the AMA won't authenticate and no data flows.
Note: both system-assigned and user-assigned managed identities are supported – assign the identity before installing the AMA extension, as done below. See the Azure Monitor Agent requirements.
az vmss identity assign -g rg-sf-grafana-repro -n nt1vmThe DCR collects CPU/memory/disk/network counters, Windows Application/System warnings and errors, and the Service Fabric Admin + Operational event channels.
This next block is where the actual monitoring pipeline gets wired up. It configures AMA to start capturing the specific metrics and logs you care about from your SF nodes.
az monitor data-collection rule create -g rg-sf-grafana-repro --location westus2 --name dcr-sfg08120632 --rule-file dcr-servicefabric-windows.jsonThe full dcr-servicefabric-windows.json used in this repro, along with the dashboard JSON, ARM template, and all deployment scripts, is available in this GitHub repo so this is reproducible: https://github.com/AhmedKhaledAbdalla/Azure-Service-Fabric-Grafana-Integration
--rule-file dcr-servicefabric-windows.json: This is the most critical part. Azure CLI reads this local JSON file, which contains the actual configuration you mentioned. It defines exactly what to collect (the CPU/memory counters, Windows Event logs, and Service Fabric Admin/Operational channels) and where to send that data (your Log Analytics Workspace).
az monitor data-collection rule association create --resource <vmss-resource-id> --name assoc-dcr --rule-id <dcr-resource-id>Creating a rule doesn't do anything on its own until you apply it to a resource. This command creates a Data Collection Rule Association (DCRA).
What happens behind the scenes:
When you create this association, the Azure Monitor Agent running on your Service Fabric VMSS nodes detects the new rule. The agents download the dcr-servicefabric-windows.json instructions, begin collecting the specified performance counters and the selected Windows Event Log channels, and start streaming that data into Azure Monitor.
The event channels collected (XPath queries in the DCR). These XPath queries are the exact filtering rules your Data Collection Rule (DCR) uses to tell the Azure Monitor Agent which Windows Event Logs to capture and which ones to ignore. By filtering at the source (on the VM itself), you save on ingestion costs and reduce noise in your Log Analytics workspace.
Application!*[System[(Level=1 or Level=2 or Level=3)]]
System!*[System[(Level=1 or Level=2 or Level=3)]]
Microsoft-ServiceFabric/Admin!*[System[(Level=1 or Level=2 or Level=3 or Level=4)]]
Microsoft-ServiceFabric/Operational!*[System[(Level=1 or Level=2 or Level=3 or Level=4)]]
Here is a breakdown of what those specific queries are collecting:
Standard Windows Logs:
- Application!*[System[(Level=1 or Level=2 or Level=3)]]: Captures events from the Windows Application log, but only if they are Critical (Level 1), Error (Level 2), or Warning (Level 3).
- System!*[System[(Level=1 or Level=2 or Level=3)]]: Captures events from the Windows System log, applying the same filter for Critical, Error, and Warning events.
Notice that these exclude Level 4 (Information) and Level 5 (Verbose) events, which happen constantly and would unnecessarily bloat your log storage.
Service Fabric Specific Logs:
- Microsoft-ServiceFabric/Admin!*[System[(Level=1 or Level=2 or Level=3 or Level=4)]]: Captures Admin channel events for Service Fabric. Because these are critical to understanding cluster health, it includes Information (Level 4) events alongside Warnings, Errors, and Criticals.
- Microsoft-ServiceFabric/Operational!*[System[(Level=1 or Level=2 or Level=3 or Level=4)]]: Captures Operational channel events (like node up/down, application deployment success/failure) using the same Level 1-4 filter.
5. Deploy Grafana and grant access
This step represents the final infrastructure deployment for your repro: provisioning the visualization layer (AMG) and securely connecting it to the data we started collecting in the previous steps.
1- Provisioning Azure Managed Grafana (AMG):
az grafana create -g rg-sf-grafana-repro --location westus2 --name amg-sfg08120632 --zone-redundancy Disabled2- Wiring Up Permissions (The Manual Workaround)
When you create an Azure Managed Grafana instance, Azure automatically creates a System-Assigned Managed Identity for it. Think of this as a "service account" that Grafana uses to talk to other Azure resources securely without needing passwords.
The next commands grant the necessary permissions for the data to flow and for you to log in.
Role 1: Monitoring Reader (Grafana's Identity)
az role assignment create --assignee <grafana-mi-principal-id> --role "Monitoring Reader" --scope <resource-group-id>Note: by default, Azure Managed Grafana already gets Monitoring Reader on creation, and that single role is sufficient to query both Azure Monitor metrics and Log Analytics logs (Grafana permissions docs). A separate Log Analytics Reader assignment is normally redundant; we recreated Monitoring Reader manually above because the automatic role assignment failed in this repro (see below), scoped to the resource group.
For teammates who only need to view the dashboard, assign the built-in Grafana Viewer role instead of Grafana Admin.
Role 2: Grafana Admin (Your User Identity)
az role assignment create --assignee <your-user-id> --role "Grafana Admin" --scope <grafana-resource-id>This one is for you, not the Grafana service. Even if you are the Subscription Owner who created the resource, Azure Managed Grafana has its own internal data plane authorization. This command guarantees that when you navigate to the Grafana URL in your web browser, you have full administrative rights to build dashboards, add data sources, and manage the workspace.AMG instance overviewAzure Monitor is auto-provisioned as the default Grafana data source
6. Import the dashboard
az grafana dashboard import -g rg-sf-grafana-repro -n amg-sfg08120632 --definition dashboard-servicefabric-grafana.json --overwrite trueNow that the data is being collected and Grafana has the permissions to read it, this command actually builds the visualization layer.
Instead of manually clicking through the Grafana UI to create graphs, panels, and queries one by one, this command automates the deployment of a pre-built dashboard.
--definition @dashboard-servicefabric-grafana.json: This is the payload. The @ symbol is critical here. it tells the Azure CLI, "Do not treat this as a string; open this local file and read its contents." This JSON file contains the entire blueprint for your dashboard, including the layout of the panels, the KQL queries used to fetch those Service Fabric Admin/Operational events, and the formatting rules.
See the same GitHub repo for dashboard-servicefabric-grafana.json.
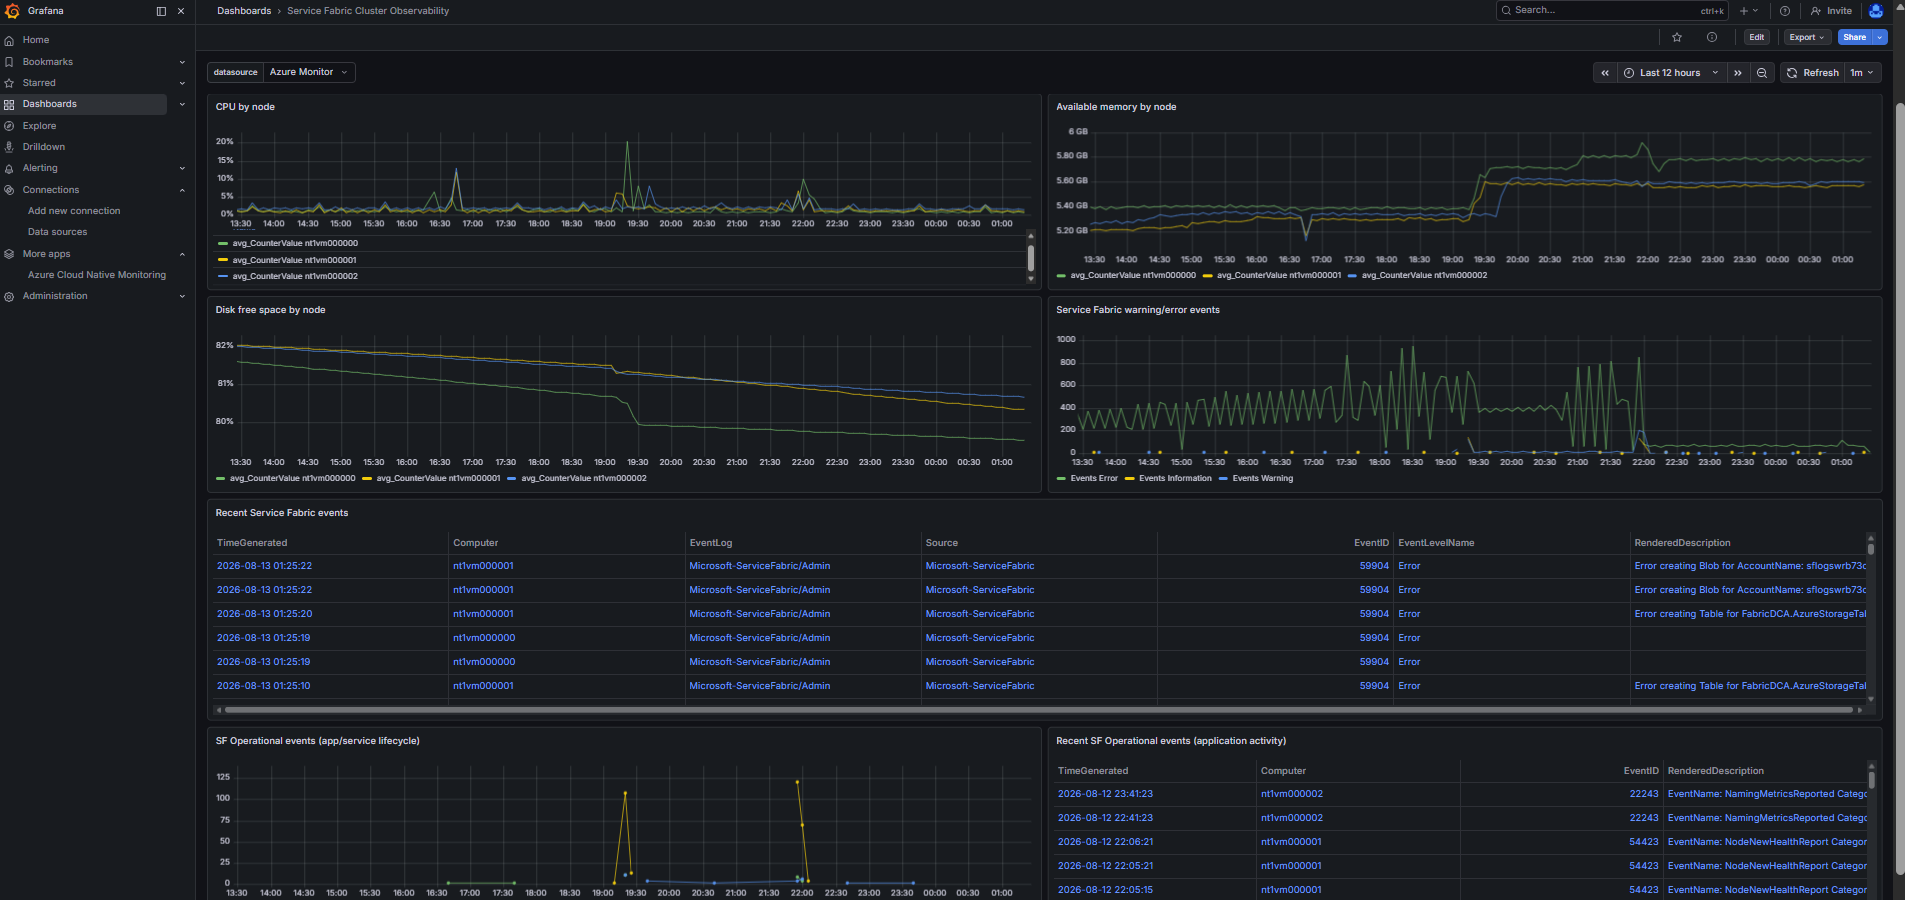
Dashboard panels:
|
Panel |
Source |
Purpose |
|
CPU by node |
Perf |
Detect overloaded nodes. |
|
Available memory by node |
Perf |
Spot memory pressure affecting replicas/services. |
|
Disk free space by node |
Perf |
Watch capacity before disks fill. |
|
SF warning/error events |
Event |
Trend platform warnings and errors. |
|
Recent SF events |
Event |
Troubleshoot recent cluster/node issues. |
|
SF Operational events |
Event |
Application/service lifecycle activity. |
First capture immediately after import, panels show ‘No data’ because AMA telemetry takes ~10–15 mins to appear (and only after the managed-identity fix)
Once telemetry flows, the same dashboard populates with data across all three nodes:
Dashboard with live data: CPU, memory, disk, and SF events per node
If you have a deployed app in your cluster, the application appears in the portal and its lifecycle events flow through the Operational channel into Log Analytics and onto the dashboard:
Dashboard for Application event logsDashboard – infrastructure metrics plus SF Admin events and SF Operational (application) events7. Useful KQL queries
1. Tracking CPU Utilization per Node
Perf
| where ObjectName == "Processor" and CounterName == "% Processor Time" and InstanceName == "_Total"
| summarize AvgCpu = avg(CounterValue) by bin(TimeGenerated, 5m), Computer
This query targets the standard Windows performance counters collected by the Azure Monitor Agent.
2. Auditing Service Fabric Lifecycle Events
Event
| where EventLog == "Microsoft-ServiceFabric/Operational"
| project TimeGenerated, Computer, EventID, RenderedDescription
| order by TimeGenerated desc
3. Visualizing Cluster Health and Error Spikes
Event
| where EventLog startswith "Microsoft-ServiceFabric"
| summarize count() by bin(TimeGenerated, 5m), EventLevelName
8. Validate the pipeline
Before trusting the dashboard, confirm each stage of the pipeline in order as a broken step upstream will silently make the dashboard look "empty" for the wrong reason.
1- AMA extension is installed on the VMSS.
In the portal, open the VM scale set → Settings (Extensions + applications), and confirm AzureMonitorWindowsAgent shows Provisioning succeeded.
Azure portal view for the VMSS ExtensionsOr from CLI:
az vmss extension list -g rg-sf-grafana-repro --vmss-name nt1vm --query "[].{Name:name, State:provisioningState}"
2- DCR is associated with the VMSS.
The Data Collection Rule must have exactly one connected resource (the VMSS). In the portal, open the DCR → Resources:
Azure portal view for the DCR attached resources
az monitor data-collection rule association list --resource <vmss-resource-id>
3- Telemetry is actually landing in Log Analytics.
Open the workspace → Logs, and run each of these and you should see rows within the last hour:
Heartbeat | where TimeGenerated > ago(1h) | summarize count() by Computer
Perf | where TimeGenerated > ago(1h) | summarize count() by ObjectName
Event | where TimeGenerated > ago(1h) | summarize count() by EventLog
If Heartbeat is empty, AMA isn't authenticating (usually the missing managed identity). If Heartbeat is fine but Perf/Event is empty, the DCR isn't matching what you expect.Checking the Heartbeat from Log Analytics
4- Grafana's managed identity has the right role.
In the portal, open the Managed Grafana instance → Access control (IAM) → Role assignments, and confirm the system-assigned identity has Monitoring Reader at the subscription/RG/workspace scope you expect.
Monitoring Reader role5- Dashboard time range is wide enough.
Set the dashboard to Last 1 hour (or wider), the default "Last 5 minutes" will look empty even when everything is working, since AMA batches data.
The ~10–15-minute figure elsewhere in this article is latency observed in this repro after fixing the managed-identity issue, not a guaranteed SLA. In practice, first data lands anywhere from a couple of minutes to ~15 minutes after AMA authenticates.
9. Real failures encountered (and fixes)
Empty Grafana panels: missing VMSS managed identity
After AMA + DCR were correctly configured, panels stayed empty and no Perf/Event/Heartbeat rows appeared in Log Analytics. Root cause: the template-created VM scale set had NO managed identity, so Azure Monitor Agent could not authenticate to Azure Monitor. Fix:
az vmss identity assign -g <rg> -n <vmss>Data started flowing ~10–15 minutes later.
Grafana CLI role-assignment API error
'az grafana create' created the instance but then crashed with 'APIVersion 2022-04-01 is not available' while auto-creating role assignments. The instance is fine; create the role assignments manually (Monitoring Reader, Log Analytics Reader, Grafana Admin).
We hit this with Azure CLI 2.40.0 and amg extension version 1.3.6, run: az extension update --name amg first, as this may already be fixed in a newer release. So, when you run the manual az role assignment create commands, you are bypassing that specific auto-assignment code path in the amg extension. Instead, you are using the core Azure CLI's role assignment engine directly, which is a reliable workaround regardless of the root cause.
10. Cost and cleanup
This repro uses paid Azure services, and leaving it running has an ongoing cost. Two components dominate:
- Log Analytics bills for data ingestion (GB ingested per day) and data retention (GB stored beyond the free 30-day window). Verbose event channels and short bin intervals both push ingestion up quickly. See Log Analytics pricing.
- Azure Managed Grafana has two tiers: Essential (lower cost, fewer active users, no zone redundancy) and Standard (per-instance hourly rate + per-active-user fee). See Azure Managed Grafana pricing.
Check the current pricing in your region before enabling this in production, and delete the whole repro resource group when you're done:
az group delete --name rg-sf-grafana-repro --yes --no-waitReferences:

 Microsoft