azure monitor managed service for prometheus
33 Topics
Find anomalies in Prometheus and OpenTelemetry metrics with Dynamic Thresholds (Preview)
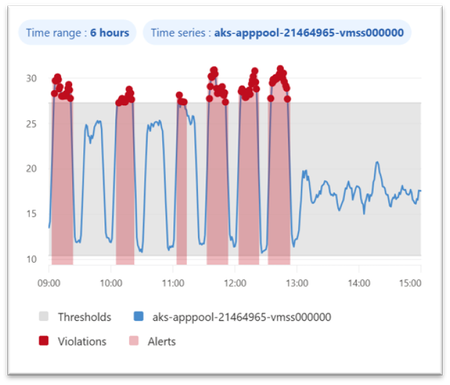
Dynamic thresholds are extended to query-based metric alerts in Azure Monitor, allowing to detect and alert on anomalies in Azure Monitor managed Prometheus metrics and OpenTelemetry metrics stored in an Azure Monitor Workspace. This follows the introduction of Dynamic Thresholds for Log search alerts — Azure Monitor now offers consistent Dynamic Thresholds support across logs and metrics — platform metrics, log search queries, and now query-based metric alerts. A consistent anomaly-detection approach, wherever your signals live. Dynamic thresholds are not a single static formula. They apply a range of machine-learning models and algorithms to historical query results, learn each series’ normal rhythm — including hourly, daily, and weekly seasonality — and automatically fit the most appropriate baseline separately to every time series. This way, a single alert rule can monitor many resources or dimensions while each one gets its own independent, self-refining baseline. Why Dynamic Thresholds Matter Simpler configuration: Reduce the need to define, maintain, and continuously tune static thresholds inside PromQL alert logic. Adaptive monitoring: Let alert thresholds adjust to changing workload behavior, recurring traffic peaks, and seasonal usage patterns. At-scale intelligence: Monitor multiple time series with a single alert rule, while Azure Monitor learns an independent baseline for each resource or dimension combination. Example 1 — Spot CPU anomalies in AKS workloads Scenario: Monitor container CPU utilization across pods or deployments in AKS with a query-based metric alert built on Prometheus metrics. Example query: sum by (microsoft_resource_id, namespace, deployment, container) (rate(container_cpu_usage_seconds_total[5m])) / sum by (microsoft_resource_id, namespace, deployment, container) (container_spec_cpu_quota / container_spec_cpu_period) Why dynamic thresholds help: CPU usage of a Kubernetes workload changes with workload mix, deployment timing, scaling activity, and traffic patterns. Static thresholds can be difficult to tune across namespaces, deployments, and containers. Dynamic thresholds learn a separate baseline for each monitored time series — in this example, for every pod, deployment, and container combination — so genuine CPU spikes stand out while expected variation from autoscaling and traffic mix stays quiet. Example 2 — Catch application latency regressions sooner Scenario: Detect abnormal latency patterns in an application by alerting on custom OpenTelemetry metrics stored in an Azure Monitor Workspace. Example query: histogram_quantile(0.95, sum by (le, service_name, http_route, http_method) (rate(http_server_duration_seconds_bucket[5m]))) Why dynamic thresholds help: Application latency naturally changes with traffic, user behavior, and release cadence. Fixed thresholds can be noisy during peak periods and too loose during quiet ones. Dynamic thresholds learn a separate baseline for each time series — here, for every service, route, and method — so real p95 latency regressions surface even as traffic and release cadence shift throughout the day. Best practices for better results To get the best results from dynamic thresholds for PromQL-based alerts, design your query so Azure Monitor can learn a clear, stable signal over time: Keep the expression numeric. Dynamic thresholds work best when the query returns a continuous numeric signal rather than a Boolean true/false result. For example, use an expression that calculates CPU usage, not a Boolean comparison like CPU > 0.8. Use meaningful dimensions. Split by dimensions such as namespace, deployment, service, or route when you want separate baselines for different workloads or endpoints. Prefer stable entities. Use longer-lived dimensions or aggregate across short-lived entities so the model has enough consistent history to learn from. In Kubernetes, for example, deployment is usually a better baseline dimension than individual pod ID. Choose the right threshold behavior. Decide whether the alert should trigger on values above the learned upper bound, below the lower bound, or both. Start with medium sensitivity. Use Medium as a balanced default, then tune up or down based on noise and missed anomalies. Allow enough historical data. Dynamic thresholds improve as more history is collected. Initial seasonal patterns use recent history, and weekly seasonality becomes more effective after several weeks of data. Get started Ready to try it? Create a query-based metric alert with dynamic thresholds on your metrics in Azure Monitor Workspace. You can create such rules in the Azure portal, where the built-in preview chart shows when your dynamic threshold alert would have fired based on historical baseline analysis. Use the preview chart to tune both the PromQL query and the dynamic threshold sensitivity before enabling the rule. You can also create query-based metric alert rules using programmatic interfaces or resource templates. Figure 1. Dynamic thresholds preview chart showing the learned baseline and the points where an alert would have fired. Dynamic thresholds cut alert noise where it starts — at detection. The alerts that do fire connect into Azure Monitor’s broader AIOps experience, where the Azure Copilot Observability Agent can help correlate signals into investigated issues with explainable reasoning — with humans in control. Next steps Related blog: Anomaly detection made easy with Dynamic thresholds for Log search alerts Dynamic thresholds in Azure Monitor Query-based metric alerts overview Create query-based metric alerts Prometheus metrics in Azure Monitor OpenTelemetry on Azure Monitor Stay connected Follow the Azure Observability Blog for more updates on Azure Monitor, Prometheus-based monitoring, alerting, and troubleshooting experiences. We’ll continue sharing product updates, practical guidance, and examples to help you improve observability across your Azure environments. Feedback We’d love to hear how dynamic thresholds for query-based metric alerts work for your scenarios. Share your feedback through your Microsoft account team, Azure support channels, or the feedback options in the Azure portal so we can continue improving the experience.216Views0likes0CommentsAccelerating AKS troubleshooting with the Azure Copilot Observability Agent
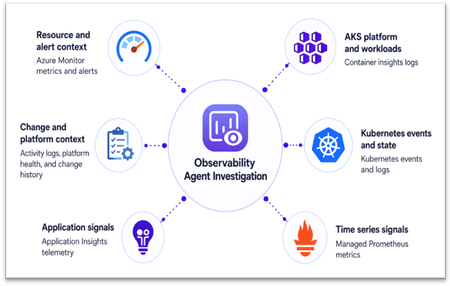
AKS incidents rarely stay within one Kubernetes object, signal, or tool. A latency spike might first appear in application telemetry, but the root cause may sit elsewhere: pod restarts, node pressure, scheduling failures, or a recent configuration change. The Azure Copilot Observability Agent in Azure Monitor helps connect these signals into an explainable investigation, so teams can move from symptoms to evidence-backed next steps. Why AKS troubleshooting is complex Troubleshooting Azure Kubernetes Service (AKS) is complex because failures can originate in workloads, platform components, infrastructure, or the application code running on the cluster. For example, pods stuck in Pending may indicate capacity or scheduling issues, while application latency may be caused by throttling, failed probes, pod restarts, or node pressure below the app. During an incident, simply having more telemetry is not enough. Teams need a way to test likely causes, rule out unrelated signals, and keep the investigation tied to the affected workload and time window. From signal to root cause: the investigation flow The Observability Agent follows a consistent investigation pipeline: Scope the problem by identifying the most likely infrastructure resources involved, plus connected dependencies. Collect data across metrics, logs, traces, change history, and related signals. Detect anomalies using learned baselines (for metrics) and log analysis. Correlate across resources spanning infrastructure and application layers. Run deep diagnostics by invoking resource-specific tools when needed to pinpoint root cause. Summarize findings in a structured format: what happened, why it happened, and what to do next. AKS investigation data sources The agent works with telemetry already available in your Azure Monitor environment. Investigation depth improves as more relevant signals are enabled, including Container insights logs, Kubernetes events and state, Azure managed service for Prometheus, container and pod logs, Application Insights telemetry for AKS-hosted workloads, Azure Activity Log changes, control plane logs routed through diagnostic settings, and resource metadata for the cluster, node pools, workloads, and related Azure resources. Figure 1. AKS investigation data sources You don’t need to enable every telemetry source to get started. The Observability Agent uses the data already available in Azure Monitor, and its findings become more complete as more AKS and application signals are collected. Example 1: AKS infrastructure — explaining why new pods never start Consider a workload rollout on AKS where replacement pods remain stuck in Pending state. What looks like a failed release may stem from the workload definition, cluster state, or underlying infrastructure. Investigation walkthrough Symptom: rollout is blocked Replacement pods remain in Pending during rollout, and Kubernetes events show repeated scheduling failures. This indicates that the rollout is blocked before new pods can start. Workload evidence: scheduling, not startup Pod state identifies the affected workload, while Kubernetes events show repeated placement failures. The issue is therefore tied to scheduling rather than application startup or container crash behavior. Cluster evidence: capacity pressure When enabled, Prometheus node metrics show CPU and memory utilization near capacity. Cluster-level trends show resource pressure increasing at the same time as pending pods and scheduling failures. Likely cause: insufficient schedulable capacity The scheduler cannot place new pods because the relevant node pool does not have enough available capacity. The failed rollout is best explained by capacity pressure in the target node pool rather than an application crash or image startup failure. Recommended action Scale out the affected node pool or adjust workload resource requests, then retry the rollout once schedulable capacity is restored. Figure 2. AKS investigation flow The Observability Agent connects pod state, scheduling events, and node pressure to explain why the rollout is blocked and which capacity action to consider next. Example 2: Joint app-AKS investigation — tracing application latency to pod restarts Now consider a customer-facing application where users see increased latency and intermittent HTTP 5xx errors after deployment. The first symptom appears in application telemetry, but the unhealthy requests are served by pods that are repeatedly restarting in AKS. Investigation walkthrough Symptom: customer-facing service degradation After deployment, application telemetry shows increased latency and HTTP 5xx errors. The first visible impact appears at the application layer. AKS evidence: unstable pods Affected pods enter CrashLoopBackOff, restart counts increase, and Kubernetes events show back-off restarts, probe failures, or image or command errors. Container logs point to startup exceptions, missing configuration, or crash details. Resource evidence: workload-specific pressure Container memory usage approaches configured limits before restarts, while node metrics show no broad node pressure. This suggests the issue is workload-specific rather than cluster-wide capacity related. Change evidence: deployment correlation Deployment history shows a new image or configuration change shortly before restarts began, with no matching platform health event. The timing points to the latest deployment or configuration change. Recommended action Review the latest image or configuration change, inspect container logs, adjust memory limits, or roll back if needed. Focus remediation on the workload change rather than node pool scaling. This pattern shows how an application symptom can map back to AKS workload behavior. Application telemetry establishes the user impact, while Kubernetes events, container logs, and resource metrics help explain why the affected pods keep failing. Operational impact For site reliability engineers, platform teams, and IT professionals, the Observability Agent reduces the time spent moving between application and AKS telemetry. It brings relevant signals into one investigation, surfaces supporting evidence, and applies Azure Monitor and AKS context so your team can review the findings, validate the recommended path, and decide which production changes to make. Figure 3. AKS investigation results Using the Observability Agent You can start using the Observability Agent from the Azure portal in two common AKS troubleshooting flows: Investigation mode: Start an investigation from an Azure Monitor alert on an AKS resource or from an Application Insights alert for an AKS-hosted workload. The agent uses the alert context to scope the incident, correlate application and cluster telemetry, and summarize the likely cause with recommended next steps. Chat-based exploration: Open the Monitor experience in AKS and select the Observability Agent button to chat with your telemetry. Use natural language to ask follow-up questions, explore logs and metrics, detect and inspect anomalies, and narrow down likely causes. Figure 4. Starting Observability Agent from AKS Monitor experience Next steps Azure Copilot Observability Agent overview Monitor Azure Kubernetes Service with Azure Monitor Stay connected Follow this blog for ongoing deep dives, updates on current capabilities, and a preview of what's coming next. Live webinar — A walkthrough of real Observability Agent scenarios, best practices, and what's available today, along with a look at what's coming next and live Q&A with the product team. Register for the Observability Agent webinar. We'd love your feedback The Observability Agent continues to evolve based on real-world usage and operator feedback. Share your thoughts directly through the Give Feedback option in the experience, or reach us at: azureobsagent@microsoft.com350Views0likes0Comments
Connect Metrics to Traces with Exemplars in Azure Monitor
Following Microsoft’s recent GA announcement for OpenTelemetry (OTel) support, we are excited to announce support for Exemplars for customers instrumenting metrics with Prometheus or OpenTelemetry and traces using OpenTelemetry, enhancing Azure Monitor’s integrated observability experience for cloud-native applications. Modern cloud-native applications generate enormous volumes of telemetry. Metrics help teams detect that something is wrong, but traces explain why. Exemplars bridge these two worlds by attaching trace references directly to metric data points, making it dramatically easier to pivot from a spike in latency or errors to the exact distributed trace responsible for the issue. With Azure Monitor, customers can now ingest metrics with exemplars and visualize them in Azure Managed Grafana. This enables seamless correlation between metrics and traces, helping engineering teams troubleshoot issues faster and reduce mean time to resolution (MTTR). Why Exemplars Matter Traditional monitoring workflows often require users to manually correlate data across multiple systems. Exemplars simplify this workflow by embedding trace context directly into metric samples. For example, if a latency metric spikes at a specific timestamp, the exemplar associated with that data point can link directly to the distributed trace responsible for the outlier. This provides several benefits: Faster root cause analysis Quicker transition from aggregate metrics to request-level details Simplified debugging workflows for SRE and platform teams Better observability experiences for microservices and distributed applications Unified Observability with Azure Monitor With Azure Monitor and Azure Managed Grafana, you can now: Ingest OTLP or Prometheus metrics with exemplars into Azure Monitor Workspace Store and analyze traces in Azure Monitor Application Insights Visualize exemplar markers directly in Grafana charts Navigate from a metric spike to the exact distributed trace associated with that data point By combining these signals in a single observability platform, organizations can correlate infrastructure health, application behavior, and request traces without context switching between tooling. How It Works Once metrics, exemplars, and traces are ingested into Azure Monitor, Azure Managed Grafana can consume exemplar information from the configured Prometheus data source. When exemplars are enabled in Grafana dashboards, users will see markers associated with individual metric data points. Selecting an exemplar opens the associated trace in Azure Monitor, providing end-to-end diagnostic context. Getting Started Setup data ingestion: Instrument your application to emit OpenTelemetry traces, OpenTelemetry or Prometheus metrics with exemplars, and enable ingestion of the same to Azure Monitor using OpenTelemetry Collector. Follow the instructions in Ingest OTLP Data into Azure Monitor with OTel Collector - Azure Monitor | Microsoft Learn. After this step, you will have the Log Analytics Workspace, Azure Monitor Workspace and Application Insights resources all set up to store the telemetry data. Create an Azure Managed Grafana instance and connect it with the Azure Monitor Workspace by navigating to your Azure Monitor Workspace in the Azure portal and then clicking on “Linked Grafana workspaces”. To learn more, see Manage an Azure Monitor workspace - Azure Monitor | Microsoft Learn Optionally, enable Azure Managed Prometheus on your AKS cluster or use remote-write and configure it to use the same Azure Monitor Workspace to centralize infrastructure and application metrics. Enable Exemplars in Azure Managed Grafana: After setting up the data ingestion, ensure that logs and traces are flowing into Log Analytics Workspace, and metrics are flowing into Azure Monitor Workspace. Step 1: Enable Exemplars on Prometheus Data Source in Azure Managed Grafana Navigate to Connections -> Data Sources in Azure Managed Grafana. Since you have connected Azure Managed Grafana to Azure Monitor Workspace, you will see the data source (Managed_Prometheus_<AMW-Name>) already configured. If the data source is not configured, follow the steps here to add your Azure Monitor Workspace as a data source. Open the data source configuration. Click Add Exemplars to enable exemplar support. Step 2: Configure Trace Linking with Azure Monitor In the exemplar configuration section, toggle Internal Link to On. Select Azure Monitor as the data source. In the Label Name, enter the name of the field in the labels object that should be used to get the trace id, eg. trace_id. Click Save & Test. This configuration enables direct navigation from exemplar markers in Grafana charts to the associated traces stored in Azure Monitor. Azure Managed Grafana also supports trace correlation from other solutions like Jaeger etc. To use your trace solution, use the appropriate links. Step 3: Enable Exemplars in Dashboards Navigate to a Grafana dashboard that uses your configured Prometheus data source. Open the panel options for a metrics chart. Toggle Exemplars to On. Once enabled, exemplar markers will appear on supported metric visualizations. Clicking on it will show exemplar details along with an option to open the corresponding distributed trace in Azure Monitor. To learn more, visit https://aka.ms/azmon-exemplars332Views1like0CommentsDirect OpenTelemetry ingestion into Azure Monitor is now generally available
OpenTelemetry is powering a new era of observability. Built on open standards, designed for portability, and made for developers who want flexibility without compromise. And now, you can send OpenTelemetry logs, metrics, and traces straight into Azure Monitor OTLP endpoints and data storage. This capability is generally available, production-ready, and built to scale from day one. With direct OTLP ingestion, you can keep your existing OpenTelemetry instrumentation and OpenTelemetry collector pipelines while sending telemetry to Azure Monitor for investigation in Application Insights, analysis in Log Analytics, Prometheus metric storage and visualization in Grafana. What’s now generally available Direct OTLP ingestion into Azure Monitor for logs, metrics, and traces. Production-ready onboarding for deploying data collection rules and endpoints. Application Insights experiences for distributed tracing, performance investigation, and troubleshooting powered by OTLP data. Grafana dashboards ready-to-use for visualizing OpenTelemetry signals. Prometheus data storage and query language for metrics OpenTelemetry semantic conventions for logs and traces, so data lands in a familiar standards-based schema. How to send OTLP to Azure Monitor Instrument your application with OpenTelemetry using the open-source SDKs and configure OTLP export to an OpenTelemetry Collector. Configure Azure Monitor OTLP ingestion by using an Application Insights resource with OTLP support, which sets up the required Azure Monitor resources and investigation experiences or manually create the required resources. Export traces, metrics, and logs directly to Azure Monitor from the OpenTelemetry Collector using the built-in OTLP over HTTP exporter. Get started Where your telemetry lands Azure Monitor brings these signals together so your teams can triage and troubleshoot root cause faster without modifying code and instrumentation. Metrics are stored in an Azure Monitor Workspace, a Prometheus metrics store. Logs and traces are stored in a Log Analytics workspace using an OpenTelemetry semantic conventions–based schema. Application Insights lights up distributed tracing and end-to-end performance investigations. Pre-built Grafana dashboards for OpenTelemetry metrics are available directly in the Azure portal alongside Application Insights. Why it matters Standardize once: Instrument with OpenTelemetry and keep your instrumentation vendor neutral and keep your telemetry portable. Reduce overhead: Fewer bespoke exporters and pipelines to maintain. Stick to OTLP for all cases. Debug faster: Correlate metrics, logs, and traces to get from reported issues to root cause with less guesswork. Observe with confidence: Use dashboards and tracing views that are ready on day one. Next step: Try OTLP export from your environment to Azure Monitor, then validate end-to-end signal flow with Application Insights and Grafana dashboards. Get started642Views0likes0CommentsTroubleshoot with OpenTelemetry in Azure Monitor - Public Preview
OpenTelemetry is fast becoming the industry standard for modern telemetry collection and ingestion pipelines. With Azure Monitor’s new OpenTelemetry Protocol (OTLP) support, you can ship logs, metrics, and traces from wherever you run workloads to analyze and act on your observability data in one place. What’s in the preview Direct OTLP ingestion into Azure Monitor for logs, metrics, and traces. Automated onboarding for AKS workloads. Application Insights on OTLP for distributed tracing, performance and troubleshooting experiences. Pre-built Grafana dashboards to visualize signals quickly. Prometheus for metric storage and query. OpenTelemetry semantic conventions for logs and traces, so your data lands in a familiar standard-based schema. How to send OTLP to Azure Monitor: pick your path AKS: Auto-instrument Java and Node.js workloads using the Azure Monitor OpenTelemetry distro, or auto-configure any OpenTelemetry SDK-instrumented workload to export OTLP to Azure Monitor. Get started Limited preview: Auto-instrumentation for .NET and Python is also available. Get started VMs/VM Scale Sets (and Azure Arc-enabled compute): Use the Azure Monitor Agent (AMA) to receive OTLP from your apps and export it to Azure Monitor. Get started Any environment: Use the OpenTelemetry Collector to receive OTLP signals and export directly to Azure Monitor cloud ingestion endpoints. Get started Under the hood: where your telemetry lands Metrics: Stored in an Azure Monitor Workspace, a Prometheus metrics store. Logs + traces: Stored in a Log Analytics workspace using an OpenTelemetry semantic conventions–based schema. Troubleshooting: Application Insights lights up distributed tracing and end-to-end performance investigations, backed by Azure Monitor. Why it matters Standardize once: Instrument with OpenTelemetry and keep your telemetry portable. Reduce overhead: Fewer bespoke exporters and pipelines to maintain. Debug faster: Correlate metrics, logs, and traces to get from alert to root cause with less guesswork. Observe with confidence: Use dashboards and tracing views that are ready on day one. Next step: Try the OTLP preview in your environment, then validate end-to-end signal flow with Application Insights and Grafana dashboards. Learn More623Views3likes0CommentsCopy dashboards from Dashboards with Grafana to Azure Managed Grafana
Azure Monitor Dashboards with Grafana provides an in‑portal Grafana experience optimized for Azure Monitor and managed Prometheus data. For many teams, that simplicity is exactly what they need. As observability practices mature, teams often need more than visualization: broader data source support, stronger security controls, and advanced workflows like Azure Managed Grafana MCP. Until now, moving dashboards from Dashboards with Grafana into Azure Managed Grafana often meant recreating them by hand or exporting JSON, extra friction when teams want to move faster. The new Copy to Managed Grafana experience removes that friction. Why a copy experience was needed Dashboards with Grafana and Azure Managed Grafana serve complementary roles. Dashboards with Grafana focuses on: Fast, zero‑setup visualization Tight integration with Azure Monitor and Prometheus An embedded experience directly inside the Azure portal Azure Managed Grafana extends that foundation with: Full Grafana workflows, including alerts, reporting, and automation Support for additional data sources and plugins Enterprise‑grade security features such as private endpoints and managed identity Cross‑team reuse through folders, APIs, and Role Based Access Controls Historically, teams that outgrew Dashboards with Grafana didn’t have a simple, in‑product way to bring their dashboards forward, so continuing in a more advanced Grafana environment required extra manual steps. The goal is simple: copy dashboards to Azure Managed Grafana as needs grow—while continuing to use Dashboards with Grafana for day‑to‑day work. Introducing “Copy to Managed Grafana” Customers can now copy dashboards from Dashboards with Grafana into Azure Managed Grafana directly from the Azure portal—without changing the original dashboard. This feature is: In‑context – start from your dashboard in Dashboards with Grafana Seamless – no exports or re‑creation Non‑disruptive – keep using the source dashboard while you adopt Managed Grafana The flow is straightforward: Select “Copy to Managed Grafana” from your dashboard in Dashboards with Grafana. This feature doesn’t work on built-in dashboards, so you would have to save a copy of built-in Dashboards before you can copy those. Choose an existing Azure Managed Grafana workspace or create a new one Complete the copy and continue working in a full Grafana environment, making data connections where needed Because it appears where teams already build dashboards, the option is easy to find when it becomes relevant. Advanced capabilities, like additional data sources, alerts, and folder organization, are configured after copying, so teams can adopt them when they’re ready. This keeps the transition predictable and avoids surprises. Dashboards with Grafana is the fastest way to visualize Azure Monitor data with Grafana. When teams need more control, scale, or extensibility, Azure Managed Grafana is the natural next step, without forcing you to stop using Dashboards with Grafana. Together, they form a single observability journey: Start quickly with Dashboards with Grafana Copy dashboards into Azure Managed Grafana when you need more capabilities Enjoy end to end observability within the Azure ecosystem as requirements evolve You don’t have to trade speed today for flexibility later. Learn more by reading the doc: Copy an Azure Monitor dashboard to Azure Managed Grafana - Azure Monitor | Microsoft Learn327Views0likes0CommentsIntroducing Azure Managed Grafana 12
In this release, Azure Managed Grafana makes it easier to tighten access with current-user Entra authentication, speed up Azure Monitor logs exploration, and level up Prometheus and database monitoring experiences. What’s new in Azure Managed Grafana 12 Use current-user Entra authentication for supported Azure data sources to query with the signed-in user’s permissions. Analyze Azure Monitor logs faster with a new query builder and improved visualization and Explore experiences. Explore Prometheus metrics with improved drill-down, prefix and suffix filters, group-by label support, plus OpenTelemetry and native histogram support. Use updated, pre-built database monitoring dashboards for Azure PostgreSQL, Azure SQL, and SQL Managed Instance (SQL MI). Advanced authentication: query with current user’s Entra credentials Current-user Entra authentication is now available in Azure data sources. That means Grafana admins can configure supported data sources to re-use the logged-in user’s credentials when issuing queries. In practice, the signed-in user’s permissions define what data stores they can access, helping teams apply least-privilege access to each user while keeping the option to use Managed Identities and Service Principals in other data sources where that fits best. Supported data sources include: Azure Monitor Azure Data Explorer Azure Monitor Managed Service for Prometheus Faster log analysis: Click-to-build queries and smoother Explore If you live in Azure Monitor logs, this update is for you. Improvements to log visualization in the Logs visualization panel and Grafana Explore make it easier to filter and extract meaningful insights from Azure Monitor logs. There’s also a new Azure Monitor logs query builder, so you can create and refine queries with a few clicks instead of writing Kusto Query Language (KQL) by hand. Performance is significantly faster too. Grafana Explore can now query and render up to 30K log records at a time, so you get much faster load times, faster searches, and more responsive navigation through large log volumes. Prometheus query enhancements: drill down without the query gymnastics Users new to Prometheus get a smoother path to explore metrics and analyze time series. Metrics drill-down now includes sidebar filters for prefix/suffix so you can quickly narrow metrics by naming conventions, and group-by label support to build more context-rich groupings. This is a true queryless exploration of Azure Managed Prometheus metrics when you’re troubleshooting or just identifying what’s been collected. This release also adds OpenTelemetry & native histogram support, including an OTel mode to automate label-join complexities when querying OTLP metrics. New database monitoring dashboards Azure Managed Grafana now includes new versions of pre-built dashboards for monitoring Azure Database for PostgreSQL and Azure SQL Databases (Preview). For teams building on Azure-native databases, these updated dashboards can help you get to a useful baseline faster, so you spend less time wiring panels and more time acting on what the data is telling you. Getting started To try Grafana 12, you can create a new Azure Managed Grafana instance with Grafana 12 selected, or upgrade an existing instance from the Azure portal. From there, consider enabling current-user Entra authentication for supported Azure data sources, test the new Azure Monitor logs query builder in Explore for day-to-day investigations, and take the updated database dashboards for a spin if you run Azure PostgreSQL, Azure SQL, or SQL MI. Check out the doc for more information: Upgrade Azure Managed Grafana to Grafana 12 - Azure Managed Grafana.884Views0likes0CommentsAnnouncing public preview of query-based metric alerts in Azure Monitor
Azure Monitor metric alerts are now more powerful than ever Azure Monitor metric alerts now support all Azure metrics - including platform, Prometheus, and custom metrics - giving you complete coverage for your monitoring needs. In addition, metric alerts now offer powerful query capabilities with PromQL, enabling complex logic across multiple metrics and resources. This makes it easier to detect patterns, correlate signals, and customize alerts for modern workloads like Kubernetes clusters, VMs, and custom applications. Key Benefits Full metrics coverage: metric alerts now support alerting on any Azure metrics including platform metrics, Prometheus metrics and custom metrics. PromQL-Powered Conditions: Use PromQL to select, aggregate, and transform metrics for advanced alerting scenarios. Powerful event detection: Query-based alert rules can now detect intricate patterns across multiple timeseries based on metric change ratio, complex aggregations, or comparison between different metrics and timeseries. You can also analyze metrics across different time windows to identify change in metric behavior over time. Flexible Scoping: For query-based alert rules, choose between resource-centric alerts for granular RBAC or workspace-centric alerts for cross-resource visibility. Alerting at scale: Query-based alert rules allow monitoring metrics from multiple resources within a subscription or a resource group, using a single rule. Managed Identity Support: Securely authorize queries using Azure Managed Identity, ensuring compliance and reducing credential management overhead. Customizable Notifications: Add dynamic custom properties and custom email subjects for faster triage and context-rich alerting. Reuse community alerts: Easily import and re-use PromQL alert queries from the open-source community or from other Prometheus-based monitoring systems. Supported metrics At this time, query-based metric alerts support any metrics ingested into Azure Monitor Workspace (AMW). This currently includes: Metrics collected by Azure Monitor managed service for Prometheus, from Azure Kubernetes Services clusters (AKS) or from other sources. Virtual machine OpenTelemetry (OTel) Guest OS Metrics Other OTel custom metrics collected into Azure Monitor. You can still create threshold-based metric alerts as before on Azure platform metrics. Query-based alerts on platform metrics will be added in future releases. Comparison: Query-based metric alerts vs. Prometheus rule groups alerts Query-based metric alerts serve as an alternative to alerts defined in Prometheus rule groups. Both options remain viable and execute the same PromQL-based alerting logic. However, metric alerts are natively integrated with Azure Monitor, aligning seamlessly with other Azure alert types. They now support all your metric alerting needs within the same rule type. They also offer richer functionality and greater flexibility, making them a strong choice for teams looking for consistency across Azure monitoring solutions. See the table below for detailed comparison of the two alternatives. Stay tuned - additional enhancements to metric alerts are coming in future releases! Feature Azure Prometheus rule groups Query-based metric alerts Alert rule management Part of a rule group resource Independent Azure resource Supported metrics Metrics in AMW (Managed Prometheus) Metrics in AMW (Managed Prometheus, OTel metrics) Condition logic PromQL-based query PromQL-based query Aggregation & transformation Full PromQL support Full PromQL support Scope Workspace-wide Resource-centric or workspace-wide Alerting at scale Not supported Subscription level, Resource-group level Cross-resource conditions Supported Supported RBAC granularity Workspace level Resource or workspace level Managed identity support Not supported Supported Notification customization Supported - Prometheus labels and annotations Advanced - dynamic custom properties, custom email subject Getting Started If you have an Azure Monitor workspace containing Prometheus or OpenTelemetry metrics, you can create query-based metric alert rules today. Rules can be created and managed using the Azure Portal, ARM templates, or Azure REST API. For details, visit Azure Monitor documentation.870Views1like1CommentGenerally Available - Azure Monitor Private Link Scope (AMPLS) Scale Limits Increased by 10x!
Introduction We are excited to announce the General Availability (GA) of Azure Monitor Private Link Scope (AMPLS) scale limit increase, delivering 10x scalability improvements compared to previous limits. This enhancement empowers customers to securely connect more Azure Monitor resources via Private Link, ensuring network isolation, compliance, and Zero Trust alignment for large-scale environments. What is Azure Monitor Private Link Scope (AMPLS)? Azure Monitor Private Link Scope (AMPLS) is a feature that allows you to securely connect Azure Monitor resources to your virtual network using private endpoints. This ensures that your monitoring data is accessed only through authorized private networks, preventing data exfiltration and keeping all traffic inside the Azure backbone network. AMPLS – Scale Limits Increased by 10x in Public Cloud & Sovereign Cloud (Fairfax/Mooncake) - Regions In a groundbreaking development, we are excited to share that the scale limits for Azure Monitor Private Link Scope (AMPLS) have been significantly increased by tenfold (10x) in Public & Sovereign Cloud regions as part of the General Availability! This substantial enhancement empowers our customers to manage their resources more efficiently and securely with private links using AMPLS, ensuring that workload logs are routed via the Microsoft backbone network. What’s New? 10x Scale Increase Connect up to 3,000 Log Analytics workspaces per AMPLS (previously 300) Connect up to 10,000 Application Insights components per AMPLS (previously 1,000) 20x Resource Connectivity Each Azure Monitor resource can now connect to 100 AMPLS resources (previously 5) Enhanced UX/UI Redesigned AMPLS interface supports loading 13,000+ resources with pagination for smooth navigation Private Endpoint Support Each AMPLS object can connect to 10 private endpoints, ensuring secure telemetry flows Why It Matters Top Azure Strategic 500 customers, including major Telecom service providers and Banking & Financial Services organizations, have noted that previous AMPLS limits did not adequately support their increasing requirements. The demand for private links has grown 3–5 times over existing capacity, affecting both network isolation and integration of essential workloads. This General Availability release resolves these issues, providing centralized monitoring at scale while maintaining robust security and performance. Customer Stories Our solution now enables customers to scale their Azure Monitor resources significantly, ensuring seamless network configurations and enhanced performance. Customer B - Case Study: Leading Banking & Financial Services Customer Challenge: The Banking Customer faced complexity in delivering personalized insights due to intricate workflows and content systems. They needed a solution that could scale securely while maintaining compliance and performance for business-critical applications. Solution: The Banking Customer has implemented Microsoft Private Links Services (AMPLS) to enhance the security and performance of financial models for smart finance assistants, leading to greater efficiency and improved client engagement. To ensure secure telemetry flow and compliance, the banking customer implemented Azure Monitor with Private Link Scope (AMPLS) and leveraged the AMPLS Scale Limit Increase feature. Business Impact: Strengthened security posture aligned with Zero Trust principles Improved operational efficiency for monitoring and reporting Delivered a future-ready architecture that scales with evolving compliance and performance demands Customer B - Case Study: Leading Telecom Service Provider - Scaling Secure Monitoring with AMPLS Architecture: A Leading Telecom Service Provider employs a highly micro-segmented design where each DevOps team operates in its own workspace to maximize security and isolation. Challenge: While this design strengthens security, it introduces complexity for large-scale monitoring and reporting due to physical and logical limitations on Azure Monitor Private Link Scope (AMPLS). Previous scale limits made it difficult to centralize telemetry without compromising isolation. Solution: The AMPLS Scale Limit Increase feature enabled the Telecom Service Provider to expand Azure Monitor resources significantly. Monitoring traffic now routes through Microsoft’s backbone network, reducing data exfiltration risks and supporting Zero Trust principles. Impact & Benefits Scalability: Supports up to 3,000 Log Analytics workspaces and 10,000 Application Insights components per AMPLS (10× increase). Efficiency: Each Azure Monitor resource can now connect to 100 AMPLS resources (20× increase). Security: Private connectivity via Microsoft backbone mitigates data exfiltration risks. Operational Excellence: Simplifies configuration for 13K+ Azure Monitor resources, reducing overhead for DevOps teams. Customer Benefits & Results Our solution significantly enhances customers’ ability to manage Azure Monitor resources securely and at scale using Azure Monitor Private Link Scope (AMPLS). Key Benefits Massive Scale Increase 3,000 Log Analytics workspaces (previously 300) 10,000 Application Insights components (previously 1,000) Each AMPLS object can now connect to: Azure Monitor resources can now connect with up to 100 AMPLS resources (20× increase). Broader Resource Support - Supported resource types include: Data Collection Endpoints (DCE) Log Analytics Workspaces (LA WS) Application Insights components (AI) Improved UX/UI Redesigned AMPLS interface supports loading 13,000+ Azure Monitor resources with pagination for smooth navigation. Private Endpoint Connectivity Each AMPLS object can connect to 10 private endpoints, ensuring secure telemetry flows. Resources: Explore the new capabilities of Azure Monitor Private Link Scope (AMPLS) and see how it can transform your network isolation and resource management. Visit our Azure Monitor Private Link Scope (AMPLS) documentation page for more details and start leveraging these enhancements today! For detailed information on configuring Azure Monitor private link scope and azure monitor resources, please refer to the following link: Use Azure Private Link to connect networks to Azure Monitor - Azure Monitor | Microsoft Learn Design your Azure Private Link setup - Azure Monitor | Microsoft Learn Configure your private link - Azure Monitor | Microsoft Learn864Views0likes0CommentsAnnouncing General Availability: Azure Monitor dashboards with Grafana
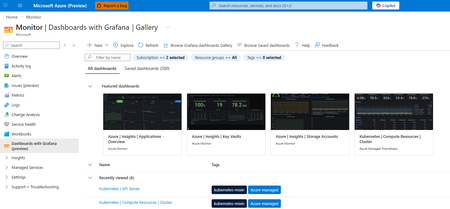
Continuing our commitment to open-source solutions, we are announcing the general availability of Azure Monitor dashboards with Grafana. This service offers a powerful solution for cloud-native monitoring and visualizing all your Azure data. Dashboards with Grafana enable you to create and edit Grafana dashboards directly in the Azure portal without additional cost and less administrative overhead compared to self-hosting Grafana or using managed Grafana services. Built-in Grafana controls and components allow you to apply a rich set of visualization panels and client-side transformations to Azure monitoring data to create custom dashboards. Start quickly with pre-built and community dashboards Dozens of pre-built Grafana dashboards for Azure Kubernetes Services, Application Insights, Storage Accounts, Cosmos DB, Azure PostgreSQL, OpenTelemetry metrics and dozens of other Azure resources are included and enabled by default. Additionally, you can import dashboards from thousands of publicly available Grafana community and open-source dashboards for the supported data sources: Prometheus, Azure Monitor (metrics, logs, traces, Azure Resource Graph), and Azure Data Explorer. Streamline monitoring with open-source compatibility and Azure enterprise capabilities Azure Monitor dashboards with Grafana are fully compatible with open-source Grafana dashboards and are portable across any Grafana instances regardless of where they are hosted. Furthermore, dashboards are native Azure resources supporting Azure RBAC to assign permissions, and automation via ARM and Bicep templates. Import, edit and create dashboards in 30+ Azure regions Choose from any language in the Azure Portal for your Grafana user interface Manage dashboard content as part of the ARM resource Automatically generate ARM templates to automate deployment and manage dashboards Take advantage of Grafana Explore and New Dashboards Leverage Grafana Explore to quickly create ad-hoc queries without modifying dashboards and add queries and visualizations to new or existing dashboards New out of the box dashboards for additional Azure resources: Additional Azure Kubernetes Service support including AKS Automatic and AKS Arc connected clusters Azure Container Apps monitoring dashboards Microsoft Foundry monitoring dashboards Azure Monitor Application Insights dashboards OpenTelemetry metrics Microsoft Agent Framework High Performance Computing dashboards with dedicated GPU monitoring When to step up to Azure Managed Grafana? If you store your telemetry data in Azure, Dashboards with Grafana in the Azure portal is a great way to get started with Grafana. If you have additional 3rd-party data sources, or need full enterprise capabilities in Grafana, you can choose to upgrade to Azure Managed Grafana, a fully managed hosted service for the Grafana Enterprise software. See a detailed solution comparison of Dashboards with Grafana and Azure Managed Grafana here. Get started with Azure Monitor dashboards with Grafana today.1.3KViews3likes0Comments