azure databricks
35 Topics
Optimize selective analytics reads in Azure Data Lake Storage with ABFS Vectored Read
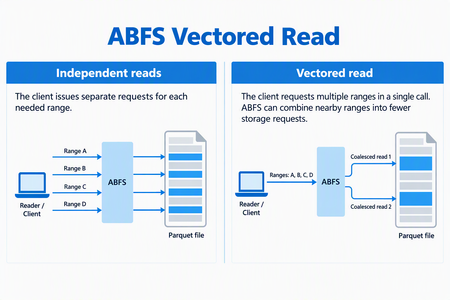
ABFS Vectored Read helps compatible analytics engines reduce request overhead when reading selected portions of columnar files in Azure Data Lake Storage. By coordinating multiple noncontiguous byte ranges through the Azure Blob File System (ABFS) driver, it can combine nearby ranges into fewer storage requests and execute those requests asynchronously. For data engineers working with selective Parquet queries, this brings the storage read pattern closer to what the query needs: a coordinated set of ranges rather than a collection of independent small reads. When the Parquet reader supports vectored I/O and the runtime includes a compatible ABFS client, Spark workloads that use higher-level APIs can enable this capability through configuration - without rewriting queries, changing application logic, or migrating data. Why selective reads need coordinated I/O Consider a query that selects a few columns from a Parquet dataset and filters out most row groups. The reader can skip much of the data the query doesn't need, but the data it needs may be spread across different parts of the file. Reading each range independently can create many small storage requests. Each request carries network and processing overhead, so selecting less data doesn't necessarily remove the cost of coordinating those reads. Vectored Read lets a compatible reader provide the ranges together, giving the client an opportunity to plan the I/O as a group. How ABFS Vectored Read works A compatible reader submits the file ranges it needs together. ABFS validates and sorts the ranges, combines nearby ranges when appropriate, and divides the resulting work to fit its read buffers. It then queues the storage requests asynchronously and returns the requested bytes to the corresponding range buffers. Illustrative request pattern, not a benchmark. Actual grouping depends on range layout and client configuration; coalesced storage requests can include bytes between the requested ranges. This is a client-side optimization. It does not change the file format or rewrite your stored data. The engine still receives the data for the ranges it requested. What this means for your workloads For compatible selective-read workloads, Vectored Read offers: Less request overhead: Combining nearby ranges can reduce separate storage requests and network round trips. Coordinated I/O: Asynchronous reads allow the client to work on multiple requested ranges without treating every range as an isolated operation. Configuration-based adoption: Compatible Spark workloads using the Hadoop Parquet and ABFS path can use the feature without rewriting their queries. The best starting point is a workload that reads selected portions of Parquet files through abfs:// or abfss://. Full sequential scans may see less benefit, and engines that bypass the Hadoop/ABFS path do not use this capability. Support depends on the Hadoop, hadoop-azure, and parquet-hadoop libraries included in the runtime, not only on the Spark version. See Availability and resources for the minimum versions and verification guidance. The benefit depends on the number, size, and spacing of requested ranges, the coalescing configuration, storage and network latency, concurrency and caching. Combining ranges can reduce requests and round trips, but it can also read additional bytes between noncontiguous requested ranges. Compare query duration, storage transactions, bytes read, and resource utilization against a controlled baseline using representative data and concurrency. Get started First, verify that your runtime contains Apache Hadoop 3.3.5 or later, including the hadoop-azure module, and parquet-hadoop 1.12.3 or later. The presence of an ABFS URI alone does not establish that the optimized implementation is installed. For Spark, enable the Parquet setting before the application starts, using the spark.hadoop. prefix: spark-submit \ --conf spark.hadoop.parquet.hadoop.vectored.io.enabled=true \ <other-options> \ <application> Replace the command placeholders with your normal submission options and application. Set the property explicitly rather than relying on a default, which can vary by packaged Parquet version. For managed services, use the service's supported cluster or session configuration mechanism. Availability and resources Azure Databricks does not currently support ABFS Vectored Read because its runtime ships an ABFS version that does not include this capability. In addition, Photon does not use the ABFS driver for data access, even when a workload uses an abfs:// or abfss:// URI. Therefore, the presence of an ABFS URI alone does not indicate that Vectored Read is available. For other packaged or managed runtimes, verify that the environment includes Apache Hadoop 3.3.5 or later with the hadoop-azure module, and parquet-hadoop 1.12.3 or later. Start with one representative selective-read workload and compare it with your baseline. For background, see the ABFS driver overview.142Views1like0CommentsAzure Databricks Cost and Workload Assessment: a Local Web UI
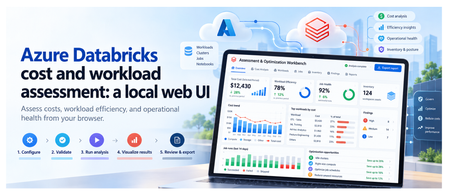
Introduction To review an Azure Databricks environment, you need to know what it costs, how its compute is used, and which jobs need attention. That information is spread across Azure billing and Databricks. The Assessment & Optimization Workbench is a local web application that brings these details together. Select your workspaces and dates, check access, and run an assessment. You can then explore the results in your browser and download a report to discuss with your team. The walkthrough below shows each step. 1. What you can assess The assessment covers costs, workload behavior, and selected configuration checks: Area What you can inspect Cost Actual and Amortized costs, top drivers, attribution gaps, and commitment scenarios with eligible hourly inputs. Efficiency CPU/memory samples, idle observations, sizing candidates, query duration, and queueing. Job health Failures, retries, failure notifications, and network observations. Inventory and posture Workspace assets, IP access list settings, and Unity Catalog metastore assignment. Evidence Collection coverage, snapshots, raw-data imports, and offline re-analysis. Handoff Prioritized findings, optional review decisions, formatted reports, and Excel exports. If some data could not be collected, the UI shows what is missing. Recommendations are suggestions for you to review and test; the assessment does not apply them automatically. Actual savings must be measured after you make the recommended changes. 2. The five-step workflow The UI guides you from choosing what to assess to downloading a report. First, select your workspaces and check access. Then start the assessment, explore the results, and export what you need. The walkthrough below shows each step. Configure → Validate → Run analysis → Visualize results → Review & export Configure This Configure step defines what the assessment will cover: which workspaces to review, the date range, and the data to collect. These choices prepare the assessment; they do not start collection. The GIF shows the scope selection, warehouse choices, and date settings before moving to validation. Select the scope: choose the subscriptions, resource groups, and Databricks workspaces to include. Set the dates and cost basis: choose the period to assess. ActualCost shows charges as recorded; AmortizedCost spreads eligible commitment costs over time. Choose the collection profile: use Standard for core assessment data, Extended to include workspace asset metadata, or Custom to select optional data and analysis modules. Select SQL Warehouses: choose a warehouse for each workspace that needs system-table queries. Selection does not start compute. Queries can incur charges, so warehouse use requires approval in Validate. Next: Select Validate configuration. Validate Validation checks your setup and access to the selected Azure and Databricks data. It helps you identify missing permissions or approvals before starting the assessment. Select Run validation, approving warehouse auto-start if required. The UI shows which checks are running, which have passed, and what needs attention. The GIF shows an approval issue being resolved, followed by the access checks. Fix any blockers that prevent the assessment from running, and read warnings about data that may be limited or unavailable. If permissions are missing, the permission panel provides commands for an authorized administrator to run. Validation itself does not grant access. Next: Once validation allows you to proceed, select Continue to run below the permission panel. You will review the setup and start the assessment separately. Run analysis This step collects data from your selected Azure and Databricks workspaces, analyzes it, and creates the assessment report. You can follow the progress and see which sources returned data. Review the selected workspaces and date range, then select Start read-only assessment. The screen shows: Progress: the current stage, from initial checks and collection through analysis and report generation, plus elapsed time. Collection sources: cards grouped into Azure data and Databricks workspaces. Each card shows its status and the number of items collected, such as cost records, inventory, or billing data. Console: detailed messages to help explain delays or collection problems. When the run finishes, green means collection and analysis succeeded, not that every workload is healthy. Red means the run failed or some data needs attention. A skipped source was not collected, often because an optional check was not selected. The report and collected data are saved locally, including any reported gaps. Next: Select Visualize results to explore the saved assessment. Visualize results This step turns the collected data into charts, tables, and findings you can explore. Start with the overall cost and collection summary, then look at individual workspaces, compute resources, and jobs to understand what needs attention. You are viewing saved results, so switching tabs does not collect data again. The GIF follows the results from cost and workload details through findings, data quality, and a proposed roadmap. The tabs are grouped into Overview, Technical, and Decisions. Overview: understand the cost Executive summary: see total cost, spending mapped to workspaces, optimization candidates, and collection status. Check whether the detailed costs match the billing total and how much supporting data is available. Cost analysis: use Cost evidence to compare Actual and Amortized trends. Break down spending by Service, Meter category, SKU, Resource group, Workspace, or Owner tag, then inspect the largest cost drivers and unmapped spend. Commitment opportunities lets you enter a proposed number of committed nodes and calculate a scenario when the required hourly usage and pricing data is available. It does not purchase a commitment. Technical: inspect resources and workloads Compute and SQL has five views: Inventory: cluster and warehouse settings, including node types, worker counts, Photon, and automatic shutdown, plus job run and failure summaries. Utilization: CPU, memory, idle observations, and sample counts. Select a resource and a driver or worker instance to view its CPU and memory chart. Sizing: current node and worker configuration, with candidates to benchmark before resizing. Job health: runs, failures, notification settings, tasks, and retry policies. Network: data sent and received by nodes, plus CPU-wait measurements. These are traffic observations, not billed network charges. Queries: switch between Individual queries, Warehouse summaries, and User summaries. Review durations, queue times, and failures; search and sort to find queries that need investigation. Posture: inspect IP access list settings and Unity Catalog metastore assignment. Each check shows its observed value and outcome; this is not a full security audit. Assets: browse collected repositories, notebook metadata, MLflow experiments, serving endpoints, SQL alerts, Genie spaces, and Unity Catalog volumes. These appear only when the relevant optional data was collected. Decisions: check findings and plan the next steps Findings: browse recommendations by category, status, and confidence. Select a row to read what was observed, the recommended next step, supporting records, and any limitations. Evidence quality: see coverage by workspace, missing data, failed or skipped sources, and records excluded from scope. Open Inspect effective rules / create another analysis to review or change analysis settings, then Create child analysis to rerun them on saved data without changing the original snapshot. Roadmap: review proposed work across Days 0-30, 31-60, and 61-90, including owners and dependencies. The measurement plan explains the baseline for checking savings after a change; the roadmap is not an approved implementation schedule. Use Filters to narrow findings by subscription, resource group, workspace, workload, category, confidence, or status. Scope selections also apply to supported technical tables, which have their own search, sorting, and paging controls. Select a resource name to inspect its saved details. If data is unavailable, check Evidence quality before drawing a conclusion. A missing measurement does not mean that a resource was unused. Next: Select Review & export to read the report or download the results. Review & export This final step lets you read the assessment report and download files to discuss with your team. You can also record decisions on individual findings. Review is optional, so you do not need to approve every finding before exporting. The GIF shows a finding being reviewed, the formatted report and supporting files being opened, and an Excel workbook being generated and downloaded. Read the report: select Preview report to move directly to the formatted report in your browser. Use its contents links to jump to sections, and open supporting evidence links to inspect the saved files. Download the report: select Download report to save the original Markdown version. Downloading a file completes this workflow step, but does not approve findings or apply changes. Record a decision: expand Record a decision, choose a finding and decision, then enter the reviewer and an optional note. Select Save review decisions to retain the changes. A decision other than pending requires a reviewer. Inspect supporting files: use Run artifacts to preview supported files or download individual outputs. Reports appear as formatted pages; CSV and JSON previews show the file contents as text. Create an Excel workbook: choose the modules under Excel workbook, then select Generate workbook artifact and download the generated file. It includes summary, rules, quality, findings, saved review decisions, and the selected module sheets. It covers the full saved assessment, not just the rows currently filtered in the UI. Save or discard pending review edits before generating a workbook. Exports include saved decisions only. Check the files before sharing them because supporting evidence can contain sensitive environment details. Optional dashboard publication is a separate cloud action for publishing coverage counts, not the full assessment. It requires a destination workspace and warehouse, a preview of the publication plan, and explicit approval of the write and possible warehouse charges. 3. Reopen saved assessments A snapshot is a locally saved assessment, including the selected scope, collected data, findings, reports, and review decisions. It lets you return to earlier results, continue a review, or download files later without querying Azure or Databricks again. Reopen an assessment: choose a run from Saved snapshots. Entries show the run date, customer, status, and run ID, with the newest first. You can then explore its results or continue in Review & export. Try different analysis settings: open Evidence quality, expand Inspect effective rules / create another analysis, adjust the settings, and select Create child analysis. This creates a separate assessment using the same saved data. The original remains unchanged, and the new findings need their own review. Remove old assessments: use Manage snapshots to delete individual snapshots or clear the saved history. Deletion requires confirmation and permanently removes the selected runs, including their evidence, reports, and review decisions. Back up important runs first. Snapshots show what was collected at the time, not the current environment. To get newer data or collect a missing source, start a new assessment. 4. Architecture and collection flow The workbench runs on your machine, with a browser interface connected to a local Python server at http://127.0.0.1:8765. Azure and Databricks supply the data; collection scripts, analysis, and saved results stay local. No Azure-hosted application is needed. The diagram follows an assessment through seven stages: Configure: the React and TypeScript browser UI captures your selected workspaces, dates, and collection options. Coordinate: the Python API receives requests from the browser, launches assessment processes, and tracks progress. Check access: validation checks the selected scope, permissions, and required approvals. These checks use live access, but full collection starts only when you select Start read-only assessment. Collect: PowerShell scripts read Azure resource inventory and billing data, plus Databricks APIs and system tables. Requests to these external sources use HTTPS. Save evidence: each run stores the returned data, configuration, source outcomes, and logs in a local folder. Analyze: Python combines the saved data, checks costs against billing totals, identifies data gaps, and applies rules to produce findings and reports. Review and export: the API returns saved results to the browser, where you explore findings, record decisions, and download reports or data files. Keep in mind: the assessment does not apply recommendations. SQL Warehouse queries can incur charges, and exported files should be checked for sensitive details before sharing. 5. Get started Try it Prerequisites: PowerShell 7+, Python 3, Node.js 22.12+/npm for the build, and Azure CLI signed in. Collection needs Azure Reader/Cost Management Reader and the required Databricks source access. From the repository root: Set-Location .\ui npm ci npm run build Set-Location .. .\ui\Start-AssessmentUi.ps1 Open http://127.0.0.1:8765 and keep the launcher running. If already built, only the final command is needed. Learn more User guide Required permissions Test record and limitations Contribute Report issues in the repository with reproduction steps and redacted source statuses. Never include credentials or raw customer evidence. Publishing check: redact environment identifiers in GIFs and upload media when posting outside the repository. Displayed timings and amounts are not benchmarks or savings claims.439Views5likes3CommentsComplete Guide to Azure Databricks Cost Optimization for Data Engineers
Co-Authored by: Aladdin Alchalabi AladdinAlchalabi, Sanjeev Nair Sanjeev Nair and Rafia Aqil Rafia_Aqil This guide walks through a proven approach to Azure Databricks cost optimization, structured in three phases: 1. Discovery, 2. Cluster/Data/Code Best Practices, and 3. Team Alignment & Next Steps. Phase 1: Discovery Assessing Your Current State The following questions are designed to guide your initial assessment and help you identify areas for improvement. Documenting answers to each will provide a baseline for optimization and inform the next phases of your cost management strategy. Environment & Organization Cluster Management Cost Optimization Data Management Performance Monitoring Future Planning What is the current scale of your Databricks environment? How many workspaces do you have? How are your workspaces organized (e.g., by environment type, region, use case)? How many clusters are deployed? How many users are active? What are the primary use cases for Databricks in your organization? Data engineering Data science Machine learning Business intelligence How are clusters currently managed? Manual configuration Automated scripts Databricks REST API Cluster policies What is the average cluster uptime? Hours per day Days per week What is the average cluster utilization rate? CPU usage Memory usage What is the current monthly spend on Databricks? Total cost Breakdown by workspace Breakdown by cluster What cost management tools are currently in use? Azure Cost Management Third-party tools Are there any existing cost optimization strategies in place? Reserved instances Spot instances Cluster auto-scaling What is the current data storage strategy? Data lake Data warehouse Hybrid What is the average data ingestion rate? GB per day Number of files What is the average data processing time? ETL jobs Machine learning models What types of data formats are used in your environment? Delta Lake Parquet JSON CSV Other formats relevant to your workloads What performance monitoring tools are currently in use? Databricks Ganglia Azure Monitor Third-party tools What are the key performance metrics tracked? Job execution time Cluster performance Data processing speed Are there any planned expansions or changes to the Databricks environment? New use cases Increased data volume Additional users What are the long-term goals for Databricks cost optimization? Reducing overall spend Improving resource utilization & cost attribution Enhancing performance Understanding Databricks Cost Structure Total Cost = Cloud Cost + DBU Cost Cloud Cost: Compute (VMs, networking, IP addresses), storage (ADLS, MLflow artifacts), other services (firewalls), cluster type (serverless compute, classic compute) DBU Cost: Workload size, cluster/warehouse size, photon acceleration, compute runtime, workspace tier, SKU type (Jobs, Delta Live Tables, All Purpose Clusters, Serverless), model serving, queries per second, model execution time Diagnose Cost and Issues Effectively diagnosing cost and performance issues in Databricks requires a structured approach. Use the following steps and metrics to gain visibility into your environment and uncover actionable insights. 1. Identify Costly Workloads Account Console Usage Reports: Review usage reports to identify usage breakdowns by product, SKU name, and custom tags. Usage Breakdown by Product and SKU: Helps you understand which services and compute types (clusters, SQL warehouses, serverless options) are consuming the most resources. Custom Tags for Attribution: Tags allow you to attribute costs to teams, projects, or departments, making it easier to identify high-cost areas. Workflow and Job Analysis: By correlating usage data with workflows and jobs, you can pinpoint long-running or resource-heavy workloads that drive costs. Focus on Long-Running Workloads: Examine workloads with extended runtimes or high resource utilization. Key Question: Which pipelines or workloads are driving the majority of your costs? Governance Hub: is a centralized, account-level UI for monitoring and managing governance across Databricks. Note this is a beta feature, we will update this article as we get more information and use-cases on this feature. Now That You’ve Identified Long-Running Workloads, Review These Key Areas: 2. Review Cluster Metrics CPU Utilization: Track guest, iowait, idle, irq, nice, softirq, steal, system, and user times to understand how compute resources are being used. Memory Utilization: Monitor used, free, buffer, and cached memory to identify over- or under-utilization. Key Question: Is your cluster over- or under-utilized? Are resources being wasted or stretched too thin? 3. Review SQL Warehouse Metrics Live Statistics: Monitor warehouse status, running/queued queries, and current cluster count. Time Scale Filter: Analyze query and cluster activity over different time frames (8 hours, 24 hours, 7 days, 14 days). Peak Query Count Chart: Identify periods of high concurrency. Completed Query Count Chart: Track throughput and query success/failure rates. Running Clusters Chart: Observe cluster allocation and recycling events. Query History Table: Filter and analyze queries by user, duration, status, and statement type. Key Question: Is your SQL Warehouse over- or under-utilized? Are resources being wasted or stretched too thin? 4. Review Spark UI Stages Tab: Look for skewed data, high input/output, and shuffle times. Uneven task durations may indicate data skew or inefficient data handling. Jobs Timeline: Identify long-running jobs or stages that consume excessive resources. Stage Analysis: Determine if stages are I/O bound or suffering from data skew/spill. Executor Metrics: Monitor memory usage, CPU utilization, and disk I/O. Frequent garbage collection or high memory usage may signal the need for better resource allocation. 4.1. Spark UI: Storage & Jobs Tab Storage Level: Check if data is stored in memory, on disk, or both. Size: Assess the size of cached data. Job Analysis: Investigate jobs that dominate the timeline or have unusually long durations. Look for gaps caused by complex execution plans, non-Spark code, driver overload, or cluster malfunction. 4.2. Spark UI: Executor Tab Storage Memory: Compare used vs. available memory. Task Time (Garbage Collection): Review long tasks and garbage collection times. Shuffle Read/Write: Measure data transferred between stages. 5. Additional Diagnostic Methods System Tables in Unity Catalog: Query system tables for cost attribution and resource usage trends. Cost Observability Queries Tagging Analysis: Use tags to identify which teams or projects consume the most resources. Dashboards & Alerts: Set up cost dashboards and budget alerts for proactive monitoring. Phase 2: Cluster/Code/Data Best Practices Alignment Cluster UI Configuration and Cost Attribution Effectively configuring clusters/workloads in Databricks is essential for balancing performance, scalability, and cost. Tunning settings and features when used strategically can help organizations maximize resource efficiency and minimize unnecessary spending. Key Configuration Strategies 1. Reduce Idle Time: Clusters to incur costs even when not actively processing workloads. To avoid paying for unused resources: Enable Auto-Terminate: Set clusters automatically shut down after a period of inactivity. This simple setting can significantly reduce wasted spending. Enable Autoscaling: Workloads fluctuate in size and complexity. Autoscaling allows clusters to dynamically adjust the number of nodes based on demand: Automatic Resource Adjustment: Scale up for heavy jobs and scale down for lighter loads, ensuring you only pay for what you use. It significantly enhances cost efficiency and overall performance. For serverless and streaming, using Delta Live Tables with autoscaling is recommended. This approach leads to better resource management and reliability. Use Spot Instances: For batch processing and non-critical workloads, spot instances offer substantial cost savings: Lower VM Costs: Spot instances are typically much cheaper than standard VMs. However, they are not recommended for jobs requiring constant uptime due to potential interruptions. Considerations: Azure Spot VMs are intended for non-critical, fault-tolerant tasks. They can be evicted without notice, risking production stability. No SLA guarantees mean potential downtime for critical applications. Using Spot VMs could lead to reliability issues in production environments. Leverage Photon Engine: Photon is Databricks’ high-performance, vectorized query engine: Accelerate Large Workloads: Photon can dramatically reduce runtime for compute-intensive tasks, improving both speed and cost efficiency. Keep Runtimes Up to Date: Using the latest Databricks runtime ensures optimal performance and security: Benefit from Improvements: Regular updates include performance enhancements, bug fixes, and new features. Apply Cluster Policies: Cluster policies help standardize configurations and enforce cost controls across teams: Governance and Consistency: Policies can restrict certain settings, enforce tagging, and ensure clusters are created with cost-effective defaults. Optimize Storage: type impacts both performance and cost: Switch from HDDs to SSDs: SSDs provide faster caching and shuffle operations, which can improve job efficiency and reduce runtime. Tag Clusters for Cost Attribution: Tagging clusters enables granular tracking and reporting: Visibility and Accountability: Use tags to attribute costs to specific teams, projects, or environments, supporting better budgeting and chargeback processes. Select the Right Cluster Type: Different workloads require different cluster types, see table below for Serverless vs Classic Compute: Feature Classic Compute Serverless Compute Control Full control over config & network Minimal control, fully managed by Databricks Startup Time Slower (unless pre-warmed) Instant Cost Model Hourly, supports reservations Pay-per-use, elastic scaling Security VNet injection, private endpoints NCC-based private connectivity Best For Heavy ETL, ML, compliance workloads Interactive queries, unpredictable demand Job Clusters: Ideal for scheduled jobs and Delta Live Tables. All-Purpose Clusters: Suited for ad-hoc analysis and collaborative work. Single-Node Clusters: Efficient for simple exploratory data analysis or pure Python tasks. Serverless Compute: Scalable, managed workloads with automatic resource management. 11. Monitor and Adjust Regularly: review cluster metrics and query history: Continuous Optimization: Use built-in dashboards to monitor usage, identify bottlenecks, and adjust cluster size or configuration as needed. Code Best Practices Avoid Reprocessing Large Tables Use a CDC (Change Data Capture) architecture with Delta Live Tables (DLT) to process only new or changed data, minimizing unnecessary computation. Ensure Code Parallelizes Well Write Spark code that leverages parallel processing. Avoid loops, deeply nested structures, and inefficient user-defined functions (UDFs) that can hinder scalability. Reduce Memory Consumption Tweak Spark configurations to minimize memory overhead. Clean out legacy or unnecessary settings that may have carried over from previous Spark versions. Prefer SQL Over Complex Python Use SQL (declarative language) for Spark jobs whenever possible. SQL queries are typically more efficient and easier to optimize than complex Python logic. Modularize Notebooks Use %run to split large notebooks into smaller, reusable modules. This improves maintainability. Use LIMIT in Exploratory Queries When exploring data, always use the LIMIT clause to avoid scanning large datasets unnecessarily. Monitor Job Performance Regularly review Spark UI to detect inefficiencies such as high shuffle, input, or output. Review the below table for optimization opportunities: Spark stage high I/O - Azure Databricks | Microsoft Learn Databricks Code Performance Enhancements & Data Engineering Best Practices By enabling the below features and applying best practices, you can significantly lower costs, accelerate job execution, and build Databricks pipelines that are both scalable and highly reliable. For more guidance review: Comprehensive Guide to Optimize Data Workloads | Databricks. Feature / Technique Purpose / Benefit How to Use / Enable / Key Notes Disk Caching Accelerates repeated reads of Parquet files Set spark.databricks.io.cache.enabled = true Dynamic File Pruning (DFP) Skips irrelevant data files during queries, improves query performance Enabled by default in Databricks Low Shuffle Merge Reduces data rewriting during MERGE operations, less need to recalculate ZORDER Use Databricks runtime with feature enabled Adaptive Query Execution (AQE) Dynamically optimizes query plans based on runtime statistics Available in Spark 3.0+, enabled by default Deletion Vectors Efficient row removal/change without rewriting entire Parquet file Enable in workspace settings, use with Delta Lake Materialized Views Faster BI queries, reduced compute for frequently accessed data Create in Databricks SQL Optimize Compacts Delta Lake files, improves query performance Run regularly, combine with ZORDER on high-cardinality columns ZORDER Physically sorts/co-locates data by chosen columns for faster queries Use with OPTIMIZE, select columns frequently used in filters/joins Auto Optimize Automatically compacts small files during writes Enable optimizeWrite and autoCompact table properties Liquid Clustering Simplifies data layout, replaces partitioning/ZORDER, flexible clustering keys Recommended for new Delta tables, enables easy redefinition of clustering keys File Size Tuning Achieve optimal file size for performance and cost Set delta.targetFileSize table property Broadcast Hash Join Optimizes joins by broadcasting smaller tables Adjust spark.sql.autoBroadcastJoinThreshold and spark.databricks.adaptive.autoBroadcastJoinThreshold Shuffle Hash Join Faster join alternative to sort-merge join Prefer over sort-merge join when broadcasting isn’t possible, Photon engine can help Cost-Based Optimizer (CBO) Improves query plans for complex joins Enabled by default, collect column/table statistics with ANALYZE TABLE Data Spilling & Skew Handles uneven data distribution and excessive shuffle Use AQE, set spark.sql.shuffle.partitions=auto, optimize partitioning Data Explosion Management Controls partition sizes after transformations (e.g., explode, join) Adjust spark.sql.files.maxPartitionBytes, use repartition() after reads Delta Merge Efficient upserts and CDC (Change Data Capture) Use MERGE operation in Delta Lake, combine with CDC architecture Data Purging (Vacuum) Removes stale data files, maintains storage efficiency Run VACUUM regularly based on transaction frequency Phase 3: Team Alignment and Next Steps Implementing Cost Observability and Taking Action Effective cost management in Databricks goes beyond configuration and code—it requires robust observability, granular tracking, and proactive measures. Below outlines how your teams can achieve this using system tables, tagging, dashboards, and actionable scripts. Cost Observability with System Tables Databricks Unity Catalog provides system tables that store operational data for your account. These tables enable historical cost observability and empower FinOps teams to analyze spend independently. System Tables Location: Found inside the Unity Catalog under the “system” schema. Key Benefits: Structured data for querying, historical analysis, and cost attribution. Action: Assign permissions to FinOps teams so they can access and analyze dedicated cost tables. Enable Tags for Granular Tracking Tagging is a powerful feature for tracking, reporting, and budgeting at a granular level. Classic Compute: Manually add key/value pairs when creating clusters, jobs, SQL Warehouses, or Model Serving endpoints. Use cluster policies to enforce custom tags. Serverless Compute: Create budget policies and assign permissions to teams or members for serverless workloads. Action: Tag all compute resources to enable detailed cost attribution and reporting. Track Costs with Dashboards and Alerts Databricks offers prebuilt dashboards and queries for cost forecasting and usage analysis. Dashboards: Visualize spend, usage trends, and forecast future costs. Prebuilt Queries: Use top queries with system tables to answer meaningful cost questions. Budget Alerts: Set up alerts in the Account Console (Usage > Budget) to receive notifications when spend approaches defined thresholds. Build Culture of Efficiency To go beyond technical fixes and build a culture of efficiency, by focusing on the below strategic actions: Collaborate with Internal Engineers: Spend time with engineering teams to understand workload patterns and optimization opportunities. Peer Reviews and Code Audits: Conduct regular code review sessions and peer reviews to ensure best practices are followed for Spark jobs, data pipelines, and cluster configurations. Create Internal Best Practice Documentation: Develop clear guidelines for writing optimized code, managing data, and maintaining clusters. Make these resources easily accessible for all teams. Implement Observability Dashboards: Use Databricks’ built-in features to create dashboards that track spend, monitor resource utilization, and highlight anomalies. Set Alerts and Budgets: Configure alerts for long-running workloads and establish budgets using prebuilt Databricks capabilities to prevent cost overruns. 5. Azure Reservations and Azure Savings Plan When optimizing Databricks costs on Azure, it’s important to understand the two main commitment-based savings options: Azure Reservations and Azure Savings Plans. Both can help you reduce compute costs, but they differ in flexibility and how savings are applied. Which Should You Choose? Reservations are ideal if you have stable, predictable Databricks workloads and want maximum savings. Savings Plans are better if you expect your compute needs to change, or if you want a simpler, more flexible way to save across multiple services. Pro Tip: You can combine both options—use Reservations for your baseline, always-on Databricks clusters, and Savings Plans for bursty, variable, or new workloads. Summary Table: Action Steps It’s critical to monitor costs continuously and align your teams with established best practices, while scheduling regular code review sessions to ensure efficiency and consistency. Area Best Practice / Action System Tables Use for historical cost analysis and attribution Tagging Apply to all compute resources for granular tracking Dashboards Visualize spend, usage, and forecasts Alerts Set budget alerts for proactive cost management Scripts/Queries Build custom analysis tools for deep insights Cluster/Data/Code Review & Align Regularly review best practices, share findings, and align teams on optimization Save on your Usage Consider Azure Reservations and Azure Savings Plan905Views2likes0CommentsEnabling the Compliance Security Profile (CSP) for HIPAA on Azure Databricks
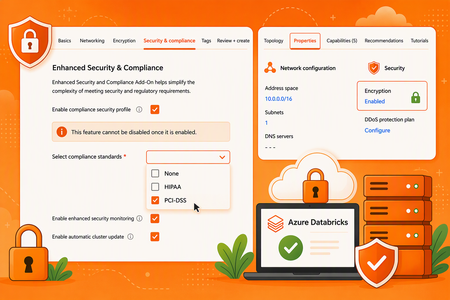
Microsoft Architect's: Aladdin Alchalabi AladdinAlchalabi, Kiran Raja KiranRaja, Peter Lenges PeterLenges, Jessica Reece jareece, Benjamin Coughtry bcoughtry, Anishek Kamal anishekkamal, Tayo Akigbogun takigbogun, Eric Kwashie ekwashie, Peter Lo PeterLo and Rafia Aqil Rafia_Aqil Peer Reviewed: Ted Kim tedkim and Arvind Periyasamy ArvindPeriyasamy Purpose and WHY Azure Databricks has put in place controls to meet the unique compliance needs of highly regulated industries. The requirement for the compliance security profile (CSP) is a joint effort between Microsoft and Databricks for Azure-Databricks workspaces. The value proposition of the compliance security profile is that it provides Customers significantly more hardening and security features. Mandatory Deadline: The Compliance Security Profile (CSP) becomes mandatory for processing HIPAA, HITRUST, and IRAP regulated data on Azure-Databricks by September 1, 2026. Key Dates: Enable the Compliance Security Profile and select HIPAA by September 1, 2026. Prepare for Azure Virtual Network encryption enforcement beginning February 1, 2027. Compliance Responsibility: Enabling CSP supports applicable technical controls but does not, by itself, establish HIPAA compliance. Compliance is a shared responsibility among the customer, Microsoft, and Databricks. Customers must evaluate their administrative, physical, and technical safeguards and confirm that an applicable Microsoft Business Associate Agreement is in place. Enabling CSP on Workspaces These requirements are checked and enforced on new workspaces today, with enforcement on existing workspaces expected in the future; where prerequisites are missing, clusters may fail to start. Prerequisite Requirement Costs There is a 10% cost of the Azure Databricks product spend within each workspace where CSP is enabled. **Review with your account team for any grace period during which the Enhanced Security & Compliance (ESC) add-on is available at no charge. After the grace period ends, a 10% DBU upcharge applies. Enhanced Security & Compliance add-on For existing workspaces: From Azure portal, click the Settings > Security & compliance on an existing Azure Databricks workspace: **Review Note #2 below Azure VNet encryption Azure Virtual Network encryption must be enabled on the Azure Databricks workspace VNet. Infrastructure as code: Update the encryption block on your VNet resource. In Terraform, that's azurerm_virtual_network. Azure portal: Toggle encryption on the VNet (Overview → Properties → Encryption). Command line: Enable it with the Azure CLI or PowerShell. **Review Note #4 below Supported VM instance types Use a VM series that supports VNet encryption and verify compatibility before enabling the profile. **This does not apply to serverless compute. NOTE: Confirm your workspace is using Premium Pricing tier. The profile can be enabled when a workspace is created or on an existing workspace, through the Azure portal, the Azure CLI, PowerShell, an ARM template, or Terraform. Only the Public Preview, Private Preview, and Beta features listed in this section are supported for workspaces with the compliance security profile enabled: Compliance security profile - Azure Databricks | Microsoft Learn Currently, the compliance security profile checks and enforces only the use of specific VM instance types, not the enablement of Azure Virtual Network encryption. Enforcement of the Azure Virtual Network encryption requirement begins on February 1, 2027, including on workspaces that already have the compliance security profile enabled. This flexibility shall allow customers more time to set up VNET encryption. This has been updated in documentation today (See ‘Important’ box). Regarding rollback, CSP can be reversed via a support ticket, if no regulated data has been processed on a particular workspace. Plan for possible effects on cluster startup, networking, feature availability, maintenance operations, and cost. A closer look at VNet encryption CSP is enabled per Databricks workspace, but VNet encryption is applied at the VNet level. Enabling it for a Databricks workload therefore affects every resource within that VNet, not just the workspace. A common approach in a hub-and-spoke design is to leave the hub VNet unencrypted and encrypt only the spoke VNet. The hub typically holds shared services such as the DNS resolver, while the spoke hosts the Databricks workspaces that require CSP. What does it mean for a VNet to be encrypted? An encrypted VNet is a security measure that protects VM-to-VM traffic. Data is encrypted in transit through a DTLS tunnel. This is platform-level encryption, applied automatically to traffic within your VNet and across peered VNets. It requires no changes to your operating system or applications. What happens to my VM-to-VM traffic? Qualifying VM-to-VM traffic is encrypted. Traffic involving unqualified instances simply keeps flowing unencrypted. The only enforcement available today is AllowUnencrypted. Important clarifications Encrypting the VNet does not guarantee all traffic within it will be encrypted. The only traffic that gets encrypted is VM-to-VM traffic where both the source and destination VMs are (1) on a supported SKU and (2) have Accelerated Networking enabled on the network interface. Encrypting the VNet does not drop or break traffic from unsupported SKUs. The only supported GA setting today is to allow unencrypted traffic, so non-qualifying traffic is still permitted; it just isn't encrypted. A future DropUnencrypted setting will drop that traffic instead for further hardening. It isn't available yet, and it's currently unknown whether it will become a required setting for CSP. Review the following recommended steps The steps below represent a validated implementation pattern. The exact network design can vary by environment, but the same prerequisite, isolation, and end-to-end validation principles should be applied. Validated implementation step Recommended approach and expected outcome Isolated sandbox workspace Enable CSP first in a representative non-production workspace. This avoids irreversible changes to DEV or production while the network topology, dependencies, VM compatibility, and operational behavior are validated. Enable CSP and select HIPAA Enable the Compliance Security Profile and select HIPAA under Settings > Security & compliance before processing PHI after September 1, 2026. Enable VNet encryption Enable VNet encryption. **Review Azure Virtual Network encryption limitations: What is Azure Virtual Network encryption? - Azure Virtual Network | Microsoft Learn Start a classic cluster Confirm that a classic cluster starts successfully after CSP and VNet encryption prerequisites are applied. This validates that the selected compute path and VM types remain operational. Validate storage connectivity Confirm storage connectivity continue to work. Confirm rollout readiness Proceed to DEV and production only after the complete private connectivity path, cluster startup, storage access, DNS resolution, data pipelines, and performance have been validated from end to end. Things to Review Enablement is permanent Enabling the compliance security profile, or adding a compliance standard, is intended to be a permanent change. You cannot remove the profile or an individual standard from a workspace that has ever processed regulated data; to revert, you must delete the workspace and create a new one. Validate the configuration in an isolated, representative non-production workspace before enabling DEV or production. Inventory and Assessment Identify Regulated Workspaces: Catalogue all existing Azure-Databricks workspaces. Determine which ones currently process, or are planned to process, data subject to HIPAA, HITRUST, or IRAP. Review Data Pipelines: Map out all data ingress and egress points for these identified workspaces, including connections to on-premises data sources, other cloud services, and external APIs. This helps identify potential network impacts. Verify Prerequisites Before Rollout: Confirm that selected VM instance types support VNet encryption and that every required CSP and networking setting is in place, because missing prerequisites can prevent clusters from starting. Enablement Method: Choose the appropriate tooling for enablement of Azure Portal, Azure CLI, PowerShell, ARM templates, or Terraform to ensure consistency and automation. Keep sensitive data out of customer-defined fields You are solely responsible for ensuring that PHI or other sensitive information is never entered into customer-defined input fields. These include workspace names, compute and resource names, tags, job names, job run names, network names, credential names, storage account names, and Git repository IDs or URLs, all of which may be stored, processed, or accessed outside the compliance boundary. What Changes After Enabling Compliance Security Profile On CSP-enabled workspaces, Partner-powered AI features are disabled by default and some assistive features such as Genie Code are also disabled; a workspace admin can re-enable them if required. In addition, only the specific preview features listed in the compliance security profile documentation are supported. No other Public Preview, Private Preview, or Beta feature may be used to process regulated data. Compliance Security Profile (CSP) enhances the security posture of Azure Databricks by enabling a hardened compute image, enhanced security monitoring, and automatic cluster updates. With automatic cluster updates enabled, classic compute resources are periodically updated and may restart during configured maintenance windows, so production schedules should be planned accordingly. Enhanced security monitoring deploys security monitoring agents on supported compute resources and generates logs that security teams can ingest and analyze. When deploying through ARM templates, CSP, enhancedSecurityMonitoring, and automaticClusterUpdate are configurable security and compliance settings that can be specified as part of the workspace deployment. Why GPU-accelerated compute may be affected Azure Databricks supports several GPU families, but Azure VNet encryption currently documents a narrower GPU list. Please review the list here: What is Azure Virtual Network encryption? - Azure Virtual Network | Microsoft Learn What happens if a customer does not enable Azure Databricks CSP? Azure Databricks has implemented additional controls to support the security and compliance requirements of highly regulated industries. CSP should not be characterized solely as a Microsoft initiative; it is part of the Azure Databricks security and compliance offering delivered by Microsoft and Databricks. CSP provides additional platform hardening and security capabilities, including a CIS Level 1 hardened compute image, automatic cluster updates, enhanced security monitoring, and TLS 1.2 or higher for relevant communications. Beginning September 1, 2026, CSP is required for Azure Databricks workspaces processing data subject to applicable standards, including HIPAA, HITRUST, and IRAP. If a customer chooses not to enable CSP while processing data subject to one of these standards, the workspace would not meet the documented Azure Databricks configuration requirements for that regulated workload. This does not, by itself, determine the customer's overall legal or regulatory compliance; customers should assess their obligations with their legal, compliance, and audit teams. References Compliance security profile: https://learn.microsoft.com/en-us/azure/databricks/security/privacy/security-profile Configure enhanced security and compliance settings: https://learn.microsoft.com/en-us/azure/databricks/security/privacy/enhanced-security-compliance HIPAA, Azure Databricks, Microsoft Learn: https://learn.microsoft.com/en-us/azure/databricks/security/privacy/hipaa What is Azure Virtual Network encryption: https://learn.microsoft.com/en-us/azure/virtual-network/virtual-network-encryption-overview Create a Virtual Network with encryption: https://learn.microsoft.com/en-us/azure/virtual-network/how-to-create-encryption?tabs Hashicorp azurerm_virtual_network: azurerm_virtual_network | Resources | hashicorp/azurerm | Terraform | Terraform Registry2KViews2likes0CommentsStreaming and Batch Data Architectures with Microsoft Fabric to Azure Databricks
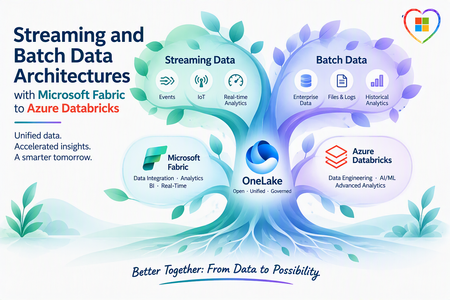
Author's: Aladdin Alchalabi AladdinAlchalabi, Oscar Alvarado oscaralvarado and Rafia Aqil Rafia_Aqil Note: This article describes a solution idea. Your cloud architect can use this guidance to help visualize the major components for a typical implementation. Use this article as a starting point to design a well-architected solution that aligns with your workload’s specific requirements. As organizations adopt Microsoft Fabric as their unified analytics platform, it has become a leading path for ingesting both streaming and batch data into Azure Databricks. This article covers integration approaches -via Microsoft Fabric- and details the five Fabric-specific paths that connect OneLake/ADLS and Databricks for end-to-end data processing. Medallion Architecture The following data flow corresponds to the architecture diagram: Data is ingested through Microsoft Fabric (via Mirroring, RTI, or Data Factory) lands data into OneLake/ADLS. With the medallion pattern, consisting of Bronze, Silver, and Gold storage layers, organizations have flexible access and extendable data processing: Bronze – Raw data entry point. Data arrives in its source format and is converted to the open, transactional Delta Lake format. Silver – Optimized for BI and data science. ETL and stream processing tasks filter, clean, transform, join, and aggregate Bronze data into curated datasets using SQL, Python, R, or Scala. Gold – Enriched data ready for analytics and reporting. Analysts use Power BI, PySpark, SQL, or Excel for insights and queries. Fabric Integration Paths Note: This architecture establishes a complete loop-back between Microsoft Fabric and Azure Databricks, enabling Gold layer tables to be seamlessly mirrored back to Microsoft Fabric for dashboarding through Azure Databricks Mirroring. The following five paths connect Microsoft Fabric to Azure Databricks: Fabric Mirroring to OneLake – A low-cost, low-latency turnkey solution that creates a replica of data from operational sources (SQL Server, Azure Cosmos DB, Oracle) in OneLake. Handles the initial load and ongoing CDC changes automatically, keeping data continuously up to date. Fabric RTI to OneLake – Fabric Real-Time Intelligence ingests streaming event data into OneLake with sub-second latency, enabling real-time analytics on live event streams. Fabric Data Factory to OneLake – Orchestrates ingestion from diverse sources not covered by Mirroring (such as Sybase or REST APIs) and lands data in OneLake, ensuring complete source coverage. OneLake to Azure Databricks – Unity Catalog connections to OneLake, secured via Managed Identities from Microsoft Entra ID, allow Databricks to query OneLake data items as a native catalog without data duplication. Fabric Data Factory to Azure Databricks (direct) – Orchestrates ingestion from diverse sources directly into Azure Data Lake Storage (ADLS), where Azure Databricks picks up the data for medallion architecture processing. Design Considerations Area Updated guidance Direct RTI-to-Databricks integration There is still no broad GA direct integration where Fabric RTI and Databricks operate as one native real-time runtime. Integration should be positioned through open protocols, Event Hubs/Kafka-style patterns, OneLake, Delta, and federation. OneLake federation in Azure Databricks OneLake federation in Azure Databricks is now the key integration story. It allows Databricks Unity Catalog to query Fabric Lakehouse and Warehouse data in OneLake without copying it. Access is read-only and depends on Fabric tenant settings, workspace permissions, and Databricks Unity Catalog setup. RTI data availability to Databricks Data ingested through Fabric RTI can be made available to Databricks by landing or exposing the data into OneLake-backed items, especially Lakehouse/Warehouse patterns. Eventhouse data can be made available in OneLake in Delta format through OneLake availability, but Databricks OneLake federation should be validated against the specific Fabric item type and access path. Existing Databricks customers Existing Databricks customers do not need to abandon Databricks. They can use Fabric RTI as the event ingestion, real-time detection, operational alerting, and business action layer, while continuing to use Databricks for engineering, ML, advanced analytics, and Unity Catalog-governed access. Activator and business action Fabric Activator is the cleanest business-user action layer. It can monitor streaming events and trigger Teams messages, email, Power Automate flows, Fabric pipelines, notebooks, Spark jobs, Dataflows, UDFs, and other downstream actions. This is a strong differentiator because it lets business users act on events without waiting for batch analytics. Operations Agents Operations Agents are in preview and should be positioned carefully. They monitor real-time data from Eventhouse or ontology sources, surface insights, recommend actions, and can connect to Activator/Power Automate action paths. They are not simply a pre-ingestion decision engine before data lands anywhere; they work from configured Fabric knowledge/data sources. Before landing in Lakehouse For decisioning before Lakehouse persistence, use Eventstream processing and Activator rules on streams. For AI-assisted operational recommendations, use Operations Agents once the relevant data is available in Eventhouse or ontology. Requirement-Specific Notes Data Ingestion Microsoft Fabric Mirroring currently supports SQL Server, Azure Cosmos DB, and Oracle as source systems. For sources not yet supported by Mirroring—such as Sybase or REST APIs—use Fabric Data Factory pipelines to ensure full coverage across all data systems. Once data is in the landing zone with the correct format, Mirroring’s CDC replication starts automatically and manages the complexity of merging changes (updates, inserts, and deletes) into Delta tables, keeping data in Fabric continuously up to date. Learn more about open mirroring Storage Format and Time Travel OneLake supports Delta tables, enabling schema evolution and time travel across all data stored in the lakehouse. Learn more about OneLake and Delta tables Security Encryption at rest: OneLake automatically encrypts all data at rest using Microsoft-managed keys, compliant with FIPS 140-2 standards. Learn more Encryption in transit: All data in transit is encrypted using TLS 1.2 or higher, securing data movement between Fabric, OneLake, and Azure Databricks. Learn more Data Governance OneLake can be registered and scanned by Microsoft Purview, enabling cataloging of stored metadata and data quality profiling. This protects sensitive information, including PHI and PII, across ingestion and analytics workflows. Learn more about Purview with Fabric Lakehouse Operations and Monitoring Use the Fabric monitor hub to track pipeline health, Spark application performance, and ingestion job status across all Fabric workloads. Learn more about the Fabric monitor hub Scenario Details This architecture applies to any organization that needs to unify streaming and batch data at scale. Common characteristics include: Multiple operational data sources (databases, SaaS applications, event streams) A requirement to process both real-time and historical data in the same platform Governance and compliance requirements for sensitive data (PHI, PII, financial records) Analytics consumers spanning BI (Power BI), data science (Databricks notebooks), and ML workloads Potential Use Cases Healthcare and life sciences – PHI/PII protection via Purview; real-time patient telemetry + batch EHR analytics Financial services – Real-time fraud detection streams + batch regulatory reporting Retail and e-commerce – Streaming clickstream analytics + batch inventory and supply chain processing Energy and utilities – IoT sensor telemetry streaming + batch consumption analytics Next Steps Get started with Microsoft Fabric Mirroring Build an ETL pipeline with Lakeflow Declarative Pipelines Configure Unity Catalog with OneLake shortcuts Monitor Fabric pipelines with the Fabric monitor hub862Views2likes0CommentsLearn What to Do When You Hit Capacity in Azure Databricks!
Microsoft's Cloud Architects: Manu Mehta manumehta, Chris Walk cwalk, Eduardo Dos Santos eduardomdossantos, Maria Hito mariahito, Kiran Raja Ch KiranRaja, Paul Singh PaulSingh, Aladdin Alchalabi AladdinAlchalabi and Rafia Aqil Rafia_Aqil Start Here: Engage Microsoft Capacity constraints in Azure Databricks are not an Azure Databricks product issue. Azure Databricks does not own or reserve compute, it dynamically provisions VMs from Azure when clusters are created or scaled. This means cluster creation, autoscaling, or job execution can stall when the underlying VM SKUs are constrained at the regional level. The fastest path to resolution is a structured conversation with your Microsoft account team, who can engage the Azure capacity intake process on your behalf. Create a Quota Support Ticket via Microsoft Support and bring the following to your account team with your Support Ticket Number. Each field maps directly to what capacity intake teams will ask for: missing fields slow the request. What to Prepare Before You Reach Out Your Account Team Field What Capacity Intake Needs Example Subscription IDs The exact Azure subscriptions that will host the workspaces and clusters 7ebee83d-7923-426c-8449-59fd4dff25ab Region(s) Primary region, plus any acceptable alternates East US 2 VM family / SKU Specific series and version requested Eadsv5, ESv4, DSv4, DSv2 Core count / new limit Total vCPU or core count per SKU 10,000 cores for Eadsv5 Workload characteristic CPU-bound vs. memory/shuffle-heavy vs. IO-heavy; batch vs. streaming vs. SQL “Memory-intensive ETL with large joins and shuffles” Scale and timing When you need it, ramp profile, peak vs. steady state “Need by month-end; ramp from 2,000 to 9,650 cores over Q3” Business context Business use case “Migration off AWS” What “Capacity” Really Means: A Layered Mental Model Before diving into fixes, it is important to understand what is actually happening behind the scenes. Capacity constraints can occur at three distinct layers, and solving them requires addressing each one. Layer 1: Azure Infrastructure This is the layer most teams underestimate. Capacity here is governed by: VM SKU availability in the region. D-series and E-series: the two most common Databricks worker families: have repeatedly hit capacity constraints across multiple Azure regions, causing cluster creation failures, autoscale stalls, and provisioning delays. Regional supply constraints, which are dynamic and shared across all Azure tenants. vCPU quotas and limits per subscription, which are separate from regional supply. Quota is your subscription’s limit to deploy resources (like a credit card limit); regional capacity is the underlying infrastructure available. Both must be sufficient. Mechanism Guarantees Capacity Costs Money when idle Discount vCPU quota No No N/A Instance pool Best effort Yes (VM only, no DBU) No Reserved Instance No N/A Yes Savings Plan No N/A Yes CRG Yes, within SLA Yes No, but RI/SP can apply Serverless Platform-Managed No N/A Layer 2: Azure Databricks Platform The Azure Databricks control plane has its own published ceilings that your architecture must proactively respect. Key limits from the official Azure Databricks resource limits documentation: Resource Limit Scope Jobs created per hour 10,000 Workspace Tasks running simultaneously 2,000 Workspace (Run Job and For Each parent tasks excluded) Parent tasks running simultaneously (Run Job / For Each) 750 Workspace SQL warehouses 1,000 Workspace Attached notebooks or execution contexts 145 Cluster Virtual machines 25,000 Per subscription per region Note: For limits marked as non-fixed in the official documentation, you can request an increase through your Azure Databricks account team. Reference: https://learn.microsoft.com/en-us/azure/databricks/resources/limits Layer 3: Workload (Spark Execution) Even when both lower layers cooperate, Spark’s own execution model can produce capacity-like symptoms: Parallelism and task distribution, which dictate how many cores a job can usefully consume. Memory pressure from joins, shuffles, and skewed keys. IO demand and caching behavior, including Delta cache effectiveness and Spark cache misuse. Understanding these layers is critical. Retries sometimes succeed because capacity is dynamic: as other workloads complete, nodes are released back to Azure and briefly become available. Recognizing When You’ve Hit Capacity Capacity issues rarely present as a single clean error. Instead, they appear as inconsistent behaviors: Clusters stuck in Pending state Autoscaling fails or never reaches the desired size Jobs intermittently fail to start Retry attempts sometimes succeed These inconsistencies occur because capacity is shared across Azure tenants and fluctuates throughout the day. Running workloads outside peak business hours in the impacted region’s time zone is one of the most effective short-term mitigations. Inconsistent symptoms are not the same as unknowable ones. Before escalating, confirm what you are actually looking at. Several very different problems produce the symptoms above, and only one of them is a regional capacity shortage. 1. Where to look first Start with the cluster's termination reason and event log in the Azure Databricks workspace. Then cross-check the Azure Activity Log for the workspace's managed resource group over the same time window, which shows the VM allocation attempt and its result. 2. Match signal to the clause What you observe Points to Review What to do Cluster-provider launch or stockout failure Regional capacity for that VM size Immediate Actions, below Quota, core, or vCPU limit referenced Subscription quota, not capacity Request a quota increase — capacity may be fine VM size unavailable in the region or zone Availability restriction, not a transient shortage Switch VM SKU or Family below, retrying will not help Pool returns INSTANCE_POOL_MAX_CAPACITY_FAILURE A Databricks pool ceiling you configured Raise the pool's maximum capacity Cluster starts normally but jobs run slowly, spill, or OOM Workload design, not capacity Why Adding more Nodes is Not Always the Answer, below Only the first row is a genuine Azure capacity constraint. The others are resolved without any capacity conversations 3. Check quota before you conclude capacity Quota and capacity fail in similar ways but are resolved through entirely different paths. Compare current usage against the limit for the VM series and region in question. If usage is below the limit and allocation still fails, the constraint is regional capacity. If usage it at the limit, it is quota and an increase may resolve it outright. Immediate Actions: How to Unblock Your Workloads When you are actively hitting capacity constraints, speed matters. Please reach out to your Microsoft Account team and try these mitigations that are ordered from quickest to most involved. Retry and Run During Off-Peak Hours Capacity availability changes throughout the day as workloads complete and release VMs. Running outside peak business hours for the impacted region significantly improves success rates. Retrying is bounded, not unlimited. As a rule of thumb, retry two or three times across different hours, including at least one off-peak window in the impacted region's time zone. If the same VM size and region fall consistently across a full business day, stop treating it as transient; open a support ticket, engage your account team, and evaluate VM families in parallel. If the workload is production critical with a fixed deadline, or if failures are blocking a migration or cutover already in flight, escalate immediately without waiting for the retry window. Switch VM SKU or Family If a specific VM SKU is constrained, switching to another can immediately unblock provisioning. Move within the same family (for example, DSv4 → DSv5) Or switch families entirely (for example, D-series → F-series or L-series) Choosing the Right VM Family Most Databricks environments default to D-series (general purpose) and E-series (memory optimized). These are also the most heavily used and most capacity-constrained VM families. Consider alternatives based on your workload: VM Family Best For When to Use Trade-off D-series General workloads Default choice Often constrained in high-demand regions E-series Memory-heavy Spark jobs Joins, shuffles, analytics High demand; higher cost F-series CPU-intensive jobs Parsing, transformations Lower memory per core L-series IO-heavy workloads Delta caching, large datasets Higher cost; large local NVMe Practical decision framework: Memory-bound workloads (joins, shuffles): Move from E-series to L-series. Similar memory per core, plus large local NVMe for Delta caching. CPU-bound workloads: Move from D-series to F-series. Higher CPU performance at lower cost. IO-heavy or cache-sensitive workloads: L-series can significantly improve performance and reduce shuffle pressure. Implement Regional Diversity in your Databricks workload As Azure capacity constraints are region and SKU-specific, it is important to build architectural flexibility into your Databricks deployments. For critical or large-scale workloads, consider deploying multiple Databricks workspaces across different Azure regions to reduce dependency on any single region’s capacity. This approach enables: improved resilience to regional capacity constraints greater flexibility in workload placement Important: Multi-region deployment requires deliberate architecture, including deploying separate workspaces and replicating data and configurations across regions; it is not automatic. Why Adding More Nodes Is Not Always the Answer When jobs slow down, the instinct is to scale compute. With Spark, more nodes do not always solve the problem. Common workload issues that masquerade as capacity problems: Data skew Excessive shuffle operations Inefficient partitioning Overuse of UDFs In some workloads, shuffle operations can grow significantly larger than the original input data, placing substantial pressure on compute, memory, disk I/O, and network resources. Because shuffle workloads are distributed across the cluster, adding nodes can improve performance by increasing parallelism. However, that benefit reaches a limit when the bottleneck is caused by data skew, oversized shuffle partitions, network-intensive data movement, or data explosion from joins and aggregations. In these scenarios, the workload becomes constrained by the shuffle pattern itself, and simply adding more nodes does not address the root cause. Instead, the shuffle strategy, partitioning approach, or query design should be optimized. Smarter optimization strategies: Reduce shuffle through repartitioning and query optimization Enable Photon for faster execution Optimize Delta tables using Z-ordering and compaction Leverage caching strategically (not just Spark cache: use the Delta/disk cache) These optimizations can reduce your dependency on scarce VM capacity altogether. Review optimization strategies: The Complete Guide to Azure Databricks Cost Optimization | Microsoft Community Hub. What to Do When Your Capacity Is Approved Once Azure approves your capacity request, retaining it requires active steps. Because Azure capacity is dynamic and shared, approved capacity is held only while compute remains actively deployed and running. This is especially important in highly constrained regions. Microsoft recommends the following: Configure an Instance Pool For workloads that cannot yet use serverless compute, configure an Azure Databricks Instance Pool with a minimum number of idle nodes aligned to your production requirements. An instance pool pre-allocates and maintains a set of idle, ready-to-use VM instances. When a cluster is created from the pool, it draws from these warm nodes: eliminating the need to request new VMs from the regional Azure capacity pool between job runs. Key behaviors: The pool holds a minimum number of nodes continuously, keeping them warm and immediately available. Clusters attached to the pool pull from warm nodes, avoiding re-acquisition from Azure between runs. No DBU charges apply while nodes are idle in the pool. Azure VM infrastructure costs do apply for all minimum idle instances. Size the pool conservatively: aligned to production need only: to balance capacity retention against ongoing cost. Important: Instance pools hold idle nodes on a best-effort basis. Periodic platform events can recycle pool nodes, briefly causing the pool to fall below its configured minimum idle count while Azure re-acquires replacement nodes. Pools significantly improve availability and startup latency, but they do not change the fact that the underlying VMs are still requested from Azure on demand. They are not a hard reservation. Reference: https://learn.microsoft.com/en-us/azure/databricks/compute/pools You can launch a pool's instances against an Azure capacity reservation group by setting the capacity_reservation_group field in the pool's azure_attributes to the group's resource ID. Configure it through the Instance Pools API or the Azure Databricks SDKs. The same requirements apply as for clusters: on-demand instances only, and only workspaces that use VNet injection. Designing for Resilience: Long-Term Best Practices To avoid repeated capacity issues, your architecture needs to evolve beyond reactive mitigations. Plan Ahead with Azure Capacity Reservation Groups For organizations running mission-critical Azure Databricks workloads, Azure Capacity Reservation Groups (CRGs) can provide additional predictability by reserving VM capacity in advance for your Databricks compute resources. Rather than competing for available regional capacity during periods of high demand, reserved capacity helps ensure that the required VM families are available when clusters need to scale or start, Reference: Databricks Clusters API documentation. Note: Before you commit to a reservation, know three things: Auto-termination stops saving VM costs. When a cluster terminates, its reserved capacity returns to an unused state and continues billing at the full VM rate. A pool backed by a reservation is not billed twice. If a team already pays for minimum idle pool nodes in a constrained region, a reservation at comparable spend converts best-effort capacity into SLA-backed capacity. Confirm that the cluster is actually using the reservation. Creating the reservation proves Azure set capacity aside, but it does not prove Databricks is drawing on it. Start a cluster, then check that allocated instances on the reservation rose by the expected node count. If it stays at zero, the usual causes are a VM size mismatch, availability not set to ON_DEMAND_AZURE, a workspace on the Databricks-managed VNet, or the RBAC actions never granted. Note also that omitting capacity_reservation_group when editing an instance pool silently clears it. Step-by-Step Instructions: Attaching a CRG to Databricks is done only through the Clusters/Instance Pools API or the Databricks SDKs, it is not available in the compute UI. Prerequisites VNet-injected workspace only. The workspace must be deployed into your own VNet. Workspaces on the default Databricks-managed VNet cannot use a CRG. On-demand instances only. The cluster/pool must use ON_DEMAND_AZURE availability. Spot and serverless are not eligible. Same region. Create the CRG in the same Azure region as the workspace. Matching VM size. Reserve the exact VM SKU(s) your cluster uses (driver and workers). Sufficient subscription quota for that SKU and core count. Go to the CRG resource -> Access Control -> Add role assignment and add the below roles to the workspace (i.e. databricks-login-prod) Enterprise Application: Microsoft.Compute/capacityReservationGroups/read Microsoft.Compute/capacityReservationGroups/deploy/action Microsoft.Compute/capacityReservationGroups/capacityReservations/read Microsoft.Compute/capacityReservationGroups/capacityReservations/deploy/action Step 1: Create the CRG and reservation in Azure az group create -l eastus -g myResourceGroup az capacity reservation group create \ -n myCapacityReservationGroup -l eastus -g myResourceGroup --zones 1 2 3 az capacity reservation create \ -c myCapacityReservationGroup -n myCapacityReservation \ -l eastus -g myResourceGroup --sku Standard_D2s_v3 --capacity 5 --zone 1 Note: If you want to create the CRG from the Azure Portal you can do the following: Set Subscription, Resource group, Name, and Region (use the same region as your Databricks workspace). Optionally pick Availability zones. Add one or more reservations: Reservation name, Instances (quantity), and VM size (match your cluster's driver/worker SKU). Example here: reservation-eadsv5, 5 × Standard_D4s_v3. Confirm the summary (price, basics, reservations), then click Create. Step 2 Attach the CRG to the cluster (Clusters API or SDK) This would be the Azure Databricks compute cluster, the Spark cluster you create inside your Azure Databricks workspace (Compute → Create compute, or a job cluster). You add an azure_attributes block to the cluster definition. The snippet below is a fragment that goes inside the cluster's JSON, alongside the normal cluster fields. You provide the CRG resource ID; Azure picks a matching reservation within the group. databricks clusters edit --json '{ "cluster_id": "<existing-cluster-id>", "spark_version": "15.4.x-scala2.12", "node_type_id": "Standard_D4s_v3", "num_workers": 4, "azure_attributes": { "availability": "ON_DEMAND_AZURE", "capacity_reservation_group": "/subscriptions/<subscription-id>/resourceGroups/<resource-group>/providers/Microsoft.Compute/capacityReservationGroups/<crg-name>" } }' The cluster's node_type_id (VM SKU) has to be the same VM size you reserved in the CRG (Step 1). If the reservation is Standard_D4s_v3, the cluster's node type must also be Standard_D4s_v3, or it won't draw from the reservation. For instance pools, set the same capacity_reservation_group field via the Instance Pools API or SDK (If you omit the field when editing a pool, Databricks clears any CRG already configured on it). Plan for Capacity Early Understand VM quotas and limits before you need them: not after a constraint occurs. Avoid designing a single SKU. Build flexibility into cluster configurations so you can switch families without re-engineering jobs. Standardize Compute Configurations Consistent, policy-driven environments make it easier to adapt when capacity constraints occur. Use Databricks Cluster Policies to constrain cluster creation to approved, available VM families: this prevents teams from inadvertently requesting constrained SKUs. Also, consider enforcing the CRG setting through a Databricks compute policy, so teams launch only against approved, reserved capacity. Move Toward Serverless Where Possible Serverless compute abstracts capacity management away from the customer. As the Databricks platform expands serverless support, migrating eligible workloads is the most durable long-term strategy. Azure continues to expand infrastructure capacity, but there are no guaranteed timelines for relief in constrained regions. Note: If your workload supports serverless compute, Databricks recommends using serverless compute instead of pools or classic VM-backed clusters. Serverless removes dependency on specific VM SKUs and regional capacity: scaling is managed by the platform with significantly improved availability. Reference: https://learn.microsoft.com/en-us/azure/databricks/serverless-compute. For eligible workloads: including Databricks Jobs (automated workflows), Databricks SQL Warehouses, and Delta Live Tables: serverless compute eliminates VM SKU dependency entirely. Configuration guidance is available in the Azure Databricks deployment guide, Development Section, Step 9. Multi-Region Strategy for Critical Workloads For the most critical workloads, evaluate a multi-region deployment as part of your business's continuity planning. This is a significant architectural investment: see the FAQ for the full scope: but it is the only approach that provides true regional redundancy. Coordinate this with your Microsoft account team. Reference: Azure Databricks & Microsoft Fabric Disaster Recovery: The Complete Better‑Together Strategy for Cloud Architects Know the Difference: Azure Capacity Reservations vs. Reserved Instances vs. Savings Plans When planning Azure infrastructure, it is important to separate capacity assurance from cost optimization. Although these options are sometimes discussed together, they solve different problems. On-Demand Capacity Reservations (ODCR) are designed to reserve compute capacity for workloads that need to run now. They are useful when an organization needs capacity for an eligible VM size in a specific region or availability zone. ODCRs generally offer flexibility because they do not require a long-term commitment and can be canceled when no longer needed. Future Capacity Reservations (FCR) support planned capacity requirements for a future need-by date. They are useful for migrations, major launches, seasonal events, and other predictable workload ramps that require advance capacity planning. In comparison, Azure Reserved VM Instances and Azure Savings Plans for Compute are primarily commercial constructs. Reserved Instances provide discounts for predictable, consistently running workloads through a one-year or three-year commitment. Savings Plans offer broader flexibility by applying discounts to eligible compute usage in exchange for an hourly spending commitment. The key takeaway is simple: capacity reservations address infrastructure availability, while Reserved Instances and Savings Plans address pricing. Organizations can use them together, pairing a capacity reservation with an applicable pricing benefit to improve both workload readiness and cost efficiency. Final Takeaways Capacity issues are infrastructure-level constraints, not Databricks product failures VM family selection is critical: do not rely solely on D-series and E-series Workload optimization can reduce dependency on scarce resources before requesting more capacity Serverless compute is Microsoft’s preferred long-term recommendation for eligible workloads Architectural flexibility: multi-SKU, multi-region awareness is your best defense against future constraints FAQ Why do retries work? Capacity in Azure regions is shared across all tenants and fluctuates throughout the day as workloads complete and release VMs. A retry succeeds when capacity temporarily frees up. Retrying during off-peak hours improves success rates significantly. Why does capacity fluctuate during the day? Capacity is a function of regional supply and concurrent demand. As workloads complete, nodes are released back to Azure. Peak business hours in the impacted region’s time zone tend to be the tightest windows. Why are instance pools not a hard reservation? Pools hold a minimum number of nodes on a best-effort basis. Periodic platform events recycle pool nodes, so a pool can briefly fall below its configured minimum idle count while Azure re-acquires replacement nodes. Setting minimum idle to 0 avoids paying for idle VMs at the cost of slower acquisition time. Pools significantly improve availability and startup latency but do not guarantee capacity at the Azure infrastructure level. Why does serverless behave differently from classic clusters? Serverless compute removes customer control over individual VM SKUs. Databricks manages the underlying capacity across a shared pool. SKU-swap and pool-based mitigations do not apply. Customer-side levers reduce to retry and off-peak scheduling. The trade-off is that serverless is the simplest and most reliable option when the workload supports it. Why is changing regions a last resort? Region changes require redeployment of the Azure Databricks workspace and migration of all dependent artifacts: jobs, clusters, libraries, networking (private endpoints, VNet injection), Unity Catalog assignments, identities, and source data. The destination region must be validated for the same SKU and zonal configuration. For these reasons, region change should always be coordinated with the Microsoft account team and attempted only after preferred mitigations have been exhausted. Why does VM family selection matter so much for capacity? Different VM families have different supply curves. D-series and E-series are the most requested Databricks worker families and the ones most frequently constrained. Choosing a SKU based on whether the workload is memory/shuffle-heavy, CPU-bound, or IO-heavy improves both performance and the probability that capacity is available. The capacity team often steers customers toward newer-generation alternatives when supply differs by generation version. What does the Microsoft account team actually do? They route the request into the Azure capacity intake process, advise alternate SKUs and regions, surface zonal vs. regional considerations, and provide forward visibility into known constraints. The customer’s job is to bring a complete, accurate workload profile so the account team can advocate effectively. It is also recommended to open an Azure Support ticket. This will save time later, as the capacity planning teams would like to track issues and requests via a support ticket. Once an Azure Support ticket is opened, the ticket number should be shared to the Microsoft Account Team, at a minimum to the Customer Success Account Manager (CSAM), if one is assigned to your organization.725Views1like0CommentsApproaches to Integrating Azure Databricks with Microsoft Fabric: The Better Together Story!
Azure Databricks and Microsoft Fabric can be combined to create a unified and scalable analytics ecosystem. This document outlines eight distinct integration approaches, each accompanied by step-by-step implementation guidance and key design considerations. These methods are not prescriptive—your cloud architecture team can choose the integration strategy that best aligns with your organization’s governance model, workload requirements and platform preferences. Whether you prioritize centralized orchestration, direct data access, or seamless reporting, the flexibility of these options allows you to tailor the solution to your specific needs.7.3KViews9likes1CommentGuide for Architecting Azure-Databricks: Design to Deployment
Author's: Chris Walk cwalk, Dan Johnson danjohn1234, Eduardo dos Santos eduardomdossantos, Aladdin Alchalabi AladdinAlchalabi, Ted Kim tekim, Eric Kwashie ekwashie, Chris Haynes Chris_Haynes, Tayo Akigbogun takigbogun and Rafia Aqil Rafia_Aqil Peer Reviewed: Mohamed Sharaf mohamedsharaf Note: We are currently updating this article to add: Serverless Workspace option. Also, while Terraform is the recommended method for production deployments due to its automation and repeatability, for simplicity in this article we will demonstrate deployment through the Azure portal. Introduction Video to Databricks: what is databricks | introduction - databricks for dummies DESIGN: Architecting a Secure Azure Databricks Environment Step 1: Plan Workspace, Subscription Organization, Analytics Architecture and Compute Planning your Azure Databricks environment can follow various arrangements depending on your organization’s structure, governance model, and workload requirements. The following guidance outlines key considerations to help you design a well-architected foundation. 1.1 Align Workspaces with Business Units A recommended best practice is to align each Azure Databricks workspace with a specific business unit. This approach—often referred to as the “Business Unit Subscription” design pattern—offers several operational and governance advantages. Streamlined Access Control: Each unit manages its own workspace, simplifying permissions and reducing cross-team access risks. For example, Sales can securely access only their data and notebooks. Cost Transparency: Mapping workspaces to business units enables accurate cost attribution and supports internal chargeback models. Each workspace can be tagged to a cost center for visibility and accountability. Even within the same workspace, costs can be controlled using system tables that provide detailed usage metrics and resource consumption insights. Challenges to keep-in-mind: While per-BU workspaces have high impact, be mindful of workspace sprawl. If every small team spins up its own workspace, you might end up with dozens or hundreds of workspaces, which introduces management overhead. Databricks recommends a reasonable upper limit (on Azure, roughly 20–50 workspaces per account/subscription) because managing “collaboration, access, and security across hundreds of workspaces can become extremely difficult, even with good automation” [1]. Each workspace will need governance (user provisioning, monitoring, compliance checks), so there is a balance to strike. 1.2 Workspace Alignment and Shared Metastore Strategy As you align workspaces with business units, it's essential to understand how Unity Catalog and the metastore fit into your architecture. Unity Catalog is Databricks’ unified governance layer that centralizes access control, auditing, and data lineage across workspaces. Each Unity Catalog is backed by a metastore, which acts as the central metadata repository for tables, views, volumes, and other data assets. In Azure Databricks, you can have one metastore per region, and all workspaces within that region share it. This enables consistent governance and simplifies data sharing across teams. If your organization spans multiple regions, you’ll need to plan for cross-region sharing, which Unity Catalog supports through Delta Sharing. By aligning workspaces with business units and connecting them to a shared metastore, you ensure that governance policies are enforced uniformly, while still allowing each team to manage its own data assets securely and independently. 1.3 Distribute Workspaces Across Subscriptions When scaling Azure Databricks, consider not just the number of workspaces, but also how to distribute them across Azure subscriptions. Using multiple Azure subscriptions can serve both organizational needs and technical requirements: Environment Segmentation (Dev/Test/Prod): A common pattern is to put production workspaces in a separate Azure subscription from development or test workspaces. This provides an extra layer of isolation. Microsoft highly recommends separating workspaces into prod and dev, in separate subscriptions. This way, you can apply stricter Azure policies or network rules to the prod subscription and keep the dev subscription a bit more open for experimentation without risking prod resources. Honor Azure Resource Limits: Azure subscriptions come with certain capacity limits and Azure Databricks workspaces have their own limits (since it’s a multi-tenant PaaS). If you put all workspaces in one subscription, or all teams in one workspace, you might hit those limits. Most enterprises naturally end up with multiple subscriptions as they grow – planning this early avoids later migration headaches. If you currently have everything in one subscription, evaluate usage and consider splitting off heavy workloads or prod workloads into a new one to adhere to best practices. 1.4 Consider Completing Azure Landing Zone Assessment When evaluating and planning your next deployment, it’s essential to ensure that your current landing zone aligns with Microsoft best practices. This helps establish a robust Databricks architecture and minimizes the risk of avoidable issues. Additionally, customers who are early in their cloud journey can benefit from Cloud Assessments—such as an Azure Landing Zone Review and a review of the “Prepare for Cloud Adoption” documentation—to build a strong foundation. 1.5 Planning Your Azure Databricks Workspace Architecture Your workspace architecture should reflect the operational model of your organization and support the workloads you intend to run, from exploratory notebooks to production-grade ETL pipelines. To support your planning, Microsoft provides several reference architectures that illustrate well-architected patterns for Databricks deployments. These solution ideas can serve as starting points for designing maintainable environments: Simplified Architecture: Modern Data Platform Architecture, ETL-Intensive Workload Reference Architecture: Building ETL Intensive Architecture, End-to-End Analytics Architecture: Create a Modern Analytics Architecture. 1.6 Planning for that “Right” Compute Choosing the right compute setup in Azure Databricks is crucial for optimizing performance and controlling costs, as billing is based on Databricks Units (DBUs) using a per-second pricing model. Classic Compute: You can fine-tune your own compute by enabling auto-termination and autoscaling, using Photon acceleration, leveraging spot instances, selecting the right VM type and node count for your workload, and choosing SSDs for performance or HDDs for archival storage. Preferred by mature internal teams and developers who need advanced control over clusters—such as custom VM selection, tuning, and specialized configurations. Serverless Compute: Alternatively, managed services can simplify operations with built-in optimizations. Removes infrastructure management and offers instant scaling without cluster warm-up, making it ideal for agility and simplicity. Step 2: Plan the “Right” CIDR Range (Classic Compute) Note: You can skip this step if you plan to use serverless compute for all your resources, as CIDR range planning is not required in serverless deployments. When planning CIDR ranges for your Azure Databricks workspace, it's important to ensure your virtual network has enough IP address capacity to support cluster scaling. Why this matters: If you choose a small VNet address space and your analytics workloads grow, you might hit a ceiling where you simply cannot launch more clusters or scale-out because there are no free IPs in the subnet. The subnet sizes—and by extension, the VNet CIDR—determine how many nodes you can. Databricks recommends using a CIDR block between /16 and /24 for the VNet, and up to /26 for the two required subnets: the container subnet and the host subnet. Here’s a reference Microsoft provides. If your current workspace’s VNet lacks sufficient IP space for active cluster nodes, you can request a CIDR range update through your Azure Databricks account team as noted in the Microsoft documentation. 2.1 Considerations for CIDR Range Workload Type & Concurrency: Consider what kinds of workloads will run (ETL Pipelines, Machine Learning Notebooks, BI Dashboards, etc.) and how many jobs or clusters may need to run in parallel. High concurrency (e.g. multiple ETL jobs or many interactive clusters) means more nodes running at the same time, requiring a larger pool of IP addresses. Data Volume (Historical vs. Incremental): Are you doing a one-time historical data load or only processing new incremental data? A large backfill of terabytes of data may require spinning up a very large cluster (hundreds of nodes) to process in a reasonable time. Ongoing smaller loads might get by with fewer nodes. Estimate how much data needs processing. Transformation Complexity: The complexity of data transformations or machine learning workloads matters. Heavy transformations (joins, aggregations on big data) or complex model training can benefit more workers. If your use cases include these, you may need larger clusters (more nodes) to meet performance SLAs, which in turn demands more IP addresses available in the subnet. Data Sources and Integration: Consider how your Databricks environment will connect to data. If you have multiple data sources or sinks (e.g. ingest from many event hubs, databases, or IoT streams), you might design multiple dedicated clusters or workflows, potentially all active at once. Also, if using separate job clusters per job (Databricks Jobs), multiple clusters might launch concurrently. All these scenarios increase concurrent node count. 2.2 Configuring a Dedicated Network (VNet) per Workspace with Egress Control By default, Azure Databricks deploys its classic compute resources into a Microsoft-managed virtual network (VNet) within your Azure subscription. While this simplifies setup, it limits control over network configuration. For enhanced security and flexibility, it's recommended to use VNet Injection, which allows you to deploy the compute plane into your own customer-managed VNet. This approach enables secure integration with other Azure services using service endpoints or private endpoints, supports user-defined routes for accessing on-premises data sources, allows traffic inspection via network virtual appliances or firewalls, and provides the ability to configure custom DNS and enforce egress restrictions through network security group (NSG) rules. Within this VNet (which must reside in the same region and subscription as the Azure Databricks workspace), two subnets are required for Azure Databricks: a container subnet (referred to as private subnet) and a host subnet (referred to as public subnet). To implement front-end Private Link, back-end Private Link, or both, your workspace VNet needs a third subnet that will contain the private endpoint (PrivateLink subnet). It is recommended to also deploy an Azure Firewall for egress control. Step 3: Plan Network Architecture for Securing Azure-Databricks 3.1 Secure Cluster Connectivity Secure Cluster Connectivity, also known as No Public IP (NPIP), is a foundational security feature for Azure Databricks deployments. When enabled, it ensures that compute resources within the customer-managed virtual network (VNet) do not have public IP addresses, and no inbound ports are exposed. Instead, each cluster initiates a secure outbound connection to the Databricks control plane using port 443 (HTTPS), through a dedicated relay. This tunnel is used exclusively for administrative tasks, separate from the web application and REST API traffic, significantly reducing the attack surface. For the most secure deployment, Microsoft and Databricks strongly recommend enabling Secure Cluster Connectivity, especially in environments with strict compliance or regulatory requirements. When Secure Cluster Connectivity is enabled, both workspace subnets become private, as cluster nodes don’t have public IP addresses. 3.2 Egress with VNet Injection (NVA) For Databricks traffic, you’ll need to assign a UDR to the Databricks-managed VNet with a next hop type of Network Virtual Appliance (NVA)—this could be an Azure Firewall, NAT Gateway, or another routing device. For control plane traffic, Databricks recommends using Azure service tags, which are logical groupings of IP addresses for Azure services and should be routed with the next hop type of internet. This is important because Azure IP ranges can change frequently as new resources are provisioned, and manually maintaining IP lists is not practical. Using service tags ensures that your routing rules automatically stay up to date. 3.3 Front-End Connectivity with Azure Private Link (Standard Deployment) To further enhance security, Azure Databricks supports Private Link for front-end connections. In a standard deployment, Private Link enables users to access the Databricks web application, REST API, and JDBC/ODBC endpoints over a private VNet interface, bypassing the public internet. For organizations with no public internet access from user networks, a browser authentication private endpoint is required. This endpoint supports SSO login callbacks from Microsoft Entra ID and is shared across all workspaces in a region using the same private DNS zone. It is typically hosted in a transit VNet that bridges on-premises networks and Azure. Note: There are two deployment types: standard and simplified. To compare these deployment types, see Choose standard or simplified deployment. 3.4 Serverless Compute Networking Azure Databricks offers serverless compute options that simplify infrastructure management and accelerate workload execution. These resources run in a Databricks-managed serverless compute plane, isolated from the public internet and connected to the control plane via the Microsoft backbone network. To secure outbound traffic from serverless workloads, administrators can configure Serverless Egress Control using network policies that restrict connections by location, FQDN, or Azure resource type. Additionally, Network Connectivity Configurations (NCCs) allow centralized management of private endpoints and firewall rules. NCCs can be attached to multiple workspaces and are essential for enabling secure access to Azure services like Data Lake Storage from serverless SQL warehouses. DEPLOYMENT: Step-to-Step Implementation using Azure Portal Step 1: Create an Azure Resource Group For each new workspace, create a dedicated Resource Group (to contain the Databricks workspace resource and associated resources). Ensure that all resources are deployed in the same Region and Resource Group (i.e. workspace, subnets...) to optimize data movement performance and enhance security. Step 2: Deploy Workspace Specific Virtual Network (VNET) From your Resource Group, create a Virtual Network. Under the Security section, enable Azure Firewall. Deploying an Azure Firewall is recommended for egress control, ensuring that outbound traffic from your Databricks environment is securely managed. Define address spaces for your Virtual Network (Review Step 2 from Design). As documented, you could create a VNet with these values: IP range: First remove the default IP range, and then add IP range 10.28.0.0/23. Create subnet public-subnet with range 10.28.0.0/25. Create subnet private-subnet with range 10.28.0.128/25. Create subnet private-link with range 10.28.1.0/27. Please note: your IP values can be different depending on your IPAM and available scopes. Review + Create your Virtual Network. Step 3: Deploy Azure-Databricks Workspace: Now that networking is in place, create the Databricks workspace. Below are detailed steps your organization should review while creating workspace creation: In Azure Portal, search for Azure Databricks and click Create. Choose the Subscription, RG, Region, select Premium, enter in “Managed Resource Group name” and click Next. Managed Resource Group- will be created after your Databrick workspace is deployed and contains infrastructure resources for the workspace i.e. VNets, DBFS. Required: Enable “Secure Cluster Connectivity” (No Public IP for clusters), to ensure that Databricks clusters are deployed without public IP addresses (Review Section 3.1). Required: Enable the option to deploy into your Virtual Network (VNet Injection), also known as “Bring Your Own VNet” (Review Section 3.2). Select the Virtual Network created in Step 2. Enter Private, Public Subnet Names. Enable or Disable “Deploying Nat Gateway”, according to your workspace requirement. Disable “Allow Public Network Access”. Select “No Azure Databricks Rules” for Required NSG Rules. Select “Click on add to create a private endpoint”, this will open a panel for private endpoint setup. Click “Add” to enter your Private Link details created in Step 2. Also, ensure that Private DNS zone integration is set to “Yes” and that a new Private DNS Zone is created, indicated by (New)privatelink.azuredatabricks.net. Unless an existing DNS zone for this purpose already exists. (Optional) Under Encryption Tab, Enable Infrastructure Encryption, if you have requirement for FIPS 140-2. It comes at a cost, it takes time to encrypt and decrypt. By default your data is already encrypted. If you have a standard regulatory requirement (ex. HIPAA). (Optional) Compliance security profile- for HIPAA. (Optional) Automatic cluster updates, First Sunday of every Month. Review + Create the workspace and wait for it to deploy. Step 4: Create a private endpoint to support SSO for web browser access: Note: This step is required when front-end Private Link is enabled, and client networks cannot access the public internet. After creating your Azure Databricks workspace, if you try to launch it without the proper Private Link configuration, you will see an error like the image below: This happens because the workspace is configured to block public network access, and the necessary Private Endpoints (including the browser_authentication endpoint for SSO) are not yet in place. Create Web-Auth Workspace Note: Deploy a “dummy”: WEB_AUTH_DO_NOT_DELETE_<region> workspace in the same region as your production workspace. Purpose: Host the browser_authentication private endpoint (one required per region). Lock the workspace (Delete lock) to prevent accidental removal. Follow step 2 to create Virtual Network (Vnet) Follow step 3 and create a VNet injected “dummy” workspace. Create Browser Authentication Private Endpoint In Azure Portal, Databricks workspace (dummy), Networking, Private endpoint connections, + Private endpoint. Resource step: Target sub-resource: browser_authentication Virtual Network step: VNet: Transit/Hub VNet (central network for Private Link) Subnet: Private Endpoint subnet in that VNet (not Databricks host subnets) DNS step: Integrate with Private DNS zone: Yes Zone: privatelink.azuredatabricks.net Ensure DNS zone is linked to the Transit VNet After creation: A-records for *.pl-auth.azuredatabricks.net are auto-created in the DNS zone. Workspace Connectivity Testing If you have VPN or ExpressRoute, Bastion is not required. However, for the purposes of this article we will be testing our workpace connectivity through Bastion. If you don’t have private connectivity and need to test from inside the VNet, Azure Bastion is a convenient option. Step 5: Create Storage Account From your Resource Group, click Create and select Storage account. On the configuration page: Select Preferred Storage type as: Azure Blob Storage or Azure Data Lake Storage Gen 2. Choose Performance and Redundancy options based on your business requirements. Click Next to proceed. Under the Advanced tab: Enable Hierarchical namespace under Data Lake Storage Gen2. This is critical for: Directory and file-level operations, Access Control Lists (ACLs). Under the Networking tab: Set Public Network Access to Disabled. Complete the creation process and then create container(s) inside the storage account. Step 6: Create Private Endpoints for Workspace Storage Account Pre-requisite: You need to create two private endpoints from the VNet used for VNet injection to your workspace storage account for the following Target sub-resources: dfs and blob. Navigate to your Storage Account. Go to Networking, Private Endpoints tab and click on to + Create Private Endpoint. In the Create Private Endpoint wizard: Resource tab: Select your Storage Account. Set Target sub-resource to dfs for the first endpoint. Virtual Network tab: Choose the VNet you used for VNet injection. Select the appropriate subnet. Complete the creation process. The private endpoint will be auto approved and visible under Private Endpoints. Repeat the process for the second private endpoint: This time set Target sub-resource to blob. Step 7: Link Storage and Databricks Workspace: Create Access Connector In your Resource Group, create an Access Connector for Azure Databricks. No additional configuration is required during creation. Assign Role to Access Connector Navigate to your Storage Account, Access Control (IAM), Add role assignment. Select: Role: Storage Blob Data Contributor Assign access to: Managed Identity Under Members: Click Select members. Find and select your newly created Access Connector for Azure Databricks. Save the role assignment. Copy Resource ID Go to the Access Connector Overview page. Copy the Resource ID for later use in Databricks configuration. Step 8: Link Storage and Databricks Workspace: Navigate to Unity Catalog In your Databricks Workspace, go to Unity Catalog, External Data and select “Create external Location” button. Configure External Location Select ADLS as the storage type. Enter the ADLS storage URL in the following format: abfss://<container_name>@<storage_account_name>.dfs.core.windows.net/ Update these two parameters: <container_name> and <storage_name> Provide Access Connector Select “Create new storage credential” from Storage credential field. Paste the Resource ID of the Access Connector for Azure Databricks (from Step 10) into the Access Connector ID field. Validate Connection Click Submit. You should see a “Successful” message confirming the connection. Click submit and you should receive a “Successful” message, indicating your connection has succeeded. You can now create Catalogs and link your secure storage. Step 9: Configuring Serverless Compute Networking: If your organization plans to use Serverless SQL Warehouses or Serverless Jobs Compute, you must configure Serverless Networking. Add Network Connectivity Configuration (NCC) Go to the Databricks Account Console: https://accounts.azuredatabricks.net/ Navigate to Cloud resources, click Add Network Connectivity Configuration. Fill in the required fields and create a new NCC. Associate NCC with Workspace In the Account Console, go to Workspaces. Select your workspace, click Update Workspace. From the Network Connectivity Configuration dropdown, select the NCC you just created. Add Private Endpoint Rule In Cloud resources, select your NCC, select Private Endpoint Rules and click Add Private Endpoint Rule. Provide: Resource ID: Enter your Storage Account Resource ID. Note: this can be found from your storage account, click on “JSON View” top right. Azure Subresource type: dfs & blob. Approve Pending Connection Go to your Storage Account, Networking, Private Endpoints. You will see a Pending connection from Databricks. Approve the connection and you will see the Connection status in your Account Console as ESTABLISHED. Step 10: Test Your Workspace: Launch a small test cluster and verify the following: It can start (which means it can talk to the control plane). It can read/write from the storage, following the following code to confirm read/write to storage: Set Spark properties to configure Azure credentials to access Azure storage. Check Private DNS Record has been created. (Optional) If on-prem data is needed: try connecting to an on-prem database (using the ExpressRoute path): Connect your Azure Databricks workspace to your on-premises network - Azure Databricks | Microsoft Learn. Step 11: Account Console, Planning Workspace Access Controls and Getting Started: Once your Azure Databricks workspace is deployed, it's essential to configure access controls and begin onboarding users with the right permissions. From your account console: https://accounts.azuredatabricks.net/, you can centrally manage your environment: add users and groups, enable preview features, and view or configure all your workspaces. Azure Databricks supports fine-grained access management through Unity Catalog, cluster policies, and workspace-level roles. Start by defining who needs access to what—whether it's notebooks, tables, jobs, or clusters—and apply least-privilege principles to minimize risk. DBFS Limitation: DBFS is automatically created upon Databricks Workspace creation. DBFS can be found in your Managed Resource Group. Databricks cannot secure DBFS (see reference image below). If there is a business need to avoid DBFS then you can disable DBFS access following instructions here: Disable access to DBFS root and mounts in your existing Azure Databricks workspace. Use Unity Catalog to manage data access across catalogs, schemas, and tables, and consider implementing cluster policies to standardize compute configurations across teams. To help your teams get started, Microsoft provides a range of tutorials and best practice guides: Best practice articles - Azure Databricks | Microsoft Learn. Step 12: Planning Data Migration: As you prepare to move data into your Azure Databricks environment, it's important to assess your migration strategy early. This includes identifying source systems, estimating data volumes, and determining the appropriate ingestion methods—whether batch, streaming, or hybrid. For organizations with complex migration needs or legacy systems, Microsoft offers specialized support through its internal Azure Cloud Accelerated Factory program. Reach out to your Microsoft account team to explore nomination for Azure Cloud Accelerated Factory, which provides hands-on guidance, tooling, and best practices to accelerate and streamline your data migration journey. Summary Regular maintenance and governance are as important as the initial design. Continuously review the environment and update configurations as needed to address evolving requirements and threats. For example, tag all resources (workspaces, VNets, clusters, etc.) with clear identifiers (workspace name, environment, department) to track costs and ownership effectively. Additionally, enforce least privilege across the platform: ensure that only necessary users are given admin privileges, and use cluster-level access control to restrict who can create or start clusters. By following the above steps, an organization will have an Azure Databricks architecture that is securely isolated, well-governed, and scalable. References: [1] 5 Best Practices for Databricks Workspaces AzureDatabricksBestPractices/toc.md at master · Azure ... - GitHub Deploy a workspace using the Azure Portal Additional Links: Quick Introduction to Databricks: what is databricks | introduction - databricks for dummies Connect Purview with Azure Databricks: Integrating Microsoft Purview with Azure Databricks Secure Databricks Delta Share between Workspaces: Secure Databricks Delta Share for Serverless Compute Azure-Databricks Cost Optimization Guide: Databricks Cost Optimization: A Practical Guide Integrate Azure Databricks with Microsoft Fabric: Integrating Azure Databricks with Microsoft Fabric Databricks Solution Accelerators for Data & AI Azure updates Appendix 3.5 Understanding Data Transfer (Express Route vs. Public Internet) For data transfers, your organization must decide to use ExpressRoute or Internet Egress. There are several considerations that can help you determine your choice: 3.5.1. Connectivity Model • ExpressRoute: Provides a private, dedicated connection between your on-premises infrastructure and Microsoft Azure. It bypasses the public internet entirely and connects through a network service provider. • Internet Egress: Refers to outbound data traffic from Azure to the public internet. This is the default path for most Azure services unless configured otherwise. 3.6 Planning for User-Defined Routes (UDRs) When working with Databricks deployments—especially in VNet-injected workspaces—setting up User Defined Routes (UDRs) is a smart move. It’s a best practice that helps manage and secure network traffic more effectively. By using UDRs, teams can steer traffic between Databricks components and external services in a controlled way, which not only boosts security but also supports compliance efforts. 3.6.1 UDRs and Hub and Spoke Topology If your Databricks workspace is deployed into your own virtual network (VNet), you’ll need to configure standard user-defined routes (UDRs) to manage traffic flow. In a typical hub-and-spoke architecture, UDRs are used to route all traffic from the spoke VNets to the hub VNet. 3.6.2 Hub and Spoke with VWANHUB If your Databricks workspace is deployed into your own virtual network (VNet) and is peered to a Virtual WAN (VWAN) hub as the primary connectivity hub into Azure, a user-defined route (UDR) is not required—provided that a private traffic routing policy or internet traffic routing policy is configured in the VWAN hub. 3.6.3 Use of NVAs and Service Tags For Databricks traffic, you’ll need to assign a UDR to the Databricks-managed VNet with a next hop type of Network Virtual Appliance (NVA)—this could be an Azure Firewall, NAT Gateway, or another routing device. For control plane traffic, Databricks recommends using Azure service tags, which are logical groupings of IP addresses for Azure services and should be routed with the next hop type of internet. This is important because Azure IP ranges can change frequently as new resources are provisioned, and manually maintaining IP lists is not practical. Using service tags ensures that your routing rules automatically stay up to date. 3.6.4 Default Outbound Access Retirement (Non-Serverless Compute) Microsoft is retiring default outbound internet access for new deployments starting September 30,2025. Going forward, outbound connectivity will require an explicit configuration using an NVA, NAT Gateway, Load Balancer, or Public IP address. Also, note that using a Public IP Address in the deployment is discouraged for Security purposes, and it is recommended to deploy the workspace in a ‘Secure Cluster Connectivity ration.” Configure connectivity will require an explicit configuration using an NVA, NAT Gateway, Load Balancer, or Public IP address. Also, note that using a Public IP Address in the deployment is discouraged for Security purposes, and it is recommended to deploy the workspace in a ‘Secure Cluster Connectivity ration.”4.3KViews4likes0CommentsBuilding AI apps and agents with Azure Databricks, Copilot Studio, and GitHub Copilot
A workspace-wide Genie MCP endpoint for Copilot Studio Genie is Azure Databricks’ AI agent that lets any employee chat with their data and get trusted answers instantly. Genie Spaces are curated, business‑domain workspaces for teams to find strategic insights for their targeted use cases. Until now, connecting Azure Databricks Genie to Microsoft Copilot Studio meant adding each Genie Space as a separate tool. This works and adds value for customers wanting to integrate a specific Genie Space with Copilot Studio, but the per-space MCP server added overhead when trying to connect multiple Genie spaces to one Copilot Studio agent. The workspace-wide MCP endpoint changes that. One endpoint per workspace gives a Copilot Studio agent access to every connected Genie space and Unity Catalog dataset, and the curated context inside each Genie space stays in place. Key capabilities: Natural-language access across the workspace. Copilot Studio agents can route questions across every connected Genie Space and Unity Catalog dataset without losing the curation that keeps answers accurate. Unity Catalog governance. Access controls are enforced at query time, so existing data permissions extend to every agent built in Copilot Studio. Beyond a single domain. Move from a finance agent or a supply chain agent to a workspace-aware agent that follows users wherever the data lives. Lakebase branching with GitHub Copilot agent mode Production AI agents fail on real-data edge cases that synthetic or mocked environments do not catch. But giving a developer direct production access to investigate is not a realistic option in most enterprises. Lakebase branching, now integrated with GitHub Copilot agent mode, gives you a way to debug against real data without ever connecting to the production database. Key capabilities: Copy-on-write branching. Create a full-fidelity branch of a Lakebase production database in seconds. No data is moved and no production records are altered. Native GitHub Copilot agent debugging. Point GitHub Copilot agent mode at the branch endpoint to reproduce, root-cause, and resolve data-dependent issues with AI assistance. Azure-native end-to-end workflow. The full loop runs across GitHub, Azure Databricks, and Lakebase. No third-party tools or custom infrastructure required. Compliance built in. Fixes ship through the standard Git-based deployment and compliance workflows already in place, so debug cycles compress from hours to minutes. What this unlocks for AI agent teams Together, the two capabilities cover both halves of the agent lifecycle on Azure: Author Copilot Studio agents that reason over an entire Azure Databricks workspace through one MCP connection. Debug production AI agents against real Lakebase data using GitHub Copilot agent mode, reducing production data risk. Keep Unity Catalog governance and existing compliance controls in place from authoring through deployment. Standardize the data, agent, and developer toolchain on GitHub, Azure Databricks, and Microsoft 365. Get started Both features are available in public preview on June 2, 2026, directly in Azure Databricks workspaces. Azure Databricks and Power Platform integration to set up Genie workspace-wide MCP for Copilot Studio Connect your GitHub to Azure Databricks to take advantage of Lakebase branching with GitHub Copilot agent mode2.3KViews0likes0Comments
Secure Medallion Architecture Pattern on Azure Databricks (Part II)
Disclaimer: The views in this article are my own and do not represent Microsoft or Databricks. This article is part of a series focused on deploying a secure Medallion Architecture. The series follows a top-down approach , beginning with a high-level architectural perspective and gradually drilling down into implementation details using repeatable, code. In this part we will discuss the implementation of the pattern using GitHub Copilot If you have missed, please read first the first part of this blog series. It can be found at: Secure Medallion Architecture Pattern on Azure Databricks (Part I). I waited a while before publishing this article. Partly due to other priorities, but also because I wanted to experiment with deploying infrastructure and data pipelines using agents. At that point, I was looking to leverage agents with a spec-driven approach, and through using GitHub Copilot, I learned what skills are and how I can use them to achieve my scope. In this blog I'll share what I learned using GitHub Copilot for spec-driven development. I'll use the content from my previous article, Secure Medallion Architecture Pattern on Azure Databricks (Part I) , as a technical specification to extract implementation details and generate two outputs: Terraform code for infrastructure, platform configuration, and deployment Databricks Declarative Automation Bundles for jobs, pipelines, and other deployment-ready workload resources I've tried not to overfit the prompts within the skills I've developed, so they remain portable to other technical articles, not just the one mentioned in this blog. Separate the platform from the workload When I started the design, I decided to modularise the automation scripts by separating the platform from the actual data platform workloads. I assigned networking, storage, identities, secret scopes, and workspace configuration to Terraform, while Databricks notebook runs, job clusters, pipelines, and environment-specific deployments were developed within Databricks Declarative Automation Bundles (formerly known as Databricks Asset Bundles). That may sound obvious, but it's exactly where generated code often goes wrong. Without explicit instructions, AI tools tend to blur these boundaries and produce one oversized block of configuration. That's why my Copilot skill needs to enforce a clear contract by: Infer the architecture from the article Identify what is explicit and what is assumed Emit Terraform only for infrastructure concerns Emit bundle files only for workload concerns Leave placeholders for anything the article does not specify That last point is critical. A blog post or low-level technical specification is not a source of truth for account IDs, hostnames, catalog names, secret values, or subnet IDs. Good automation should never fabricate those values. Instead, I decided to produce a starter implementation with TODO markers wherever environment-specific values are required. Skills are a great way to get more consistent, repeatable output across runs, so I decided to use them for this project. I could have used one of the tools listed in the table below, but I chose to go my own way, into developing a Spec-Driven Development (SDD) framework which I hope it will carryon improve with time. Tool Creator Type Link Description GitHub Spec Kit GitHub Open source github/spec-kit Turns feature ideas into specs, plans, and task lists before any code is written. Works with multiple AI coding agents. Specification first, code as generated output. BMAD Method BMad Code LLC Open source bmad-code-org/BMAD-METHOD An AI-driven agile framework with specialised agents covering the full lifecycle from ideation to deployment. Scale-adaptive — adjusts planning depth from a bug fix to an enterprise system. OpenSpec Fission AI Open source Fission-AI/OpenSpec Lightweight spec layer that sits above your existing AI tools. Each change gets a proposal, specs, design, and task list. No rigid phase gates, no IDE lock-in. What are skills, and why are they a good fit? Skills are essentially reusable prompt modules that aim to force LLMs to produce repeatable answers. Within a skill, I define the behavior and then attach supporting resources or scripts so Copilot can perform the task consistently. That means a skill can do more than just "write some code." A skill can define a repeatable workflow like this: Fetch the blog URL Extract headings, paragraphs, and code snippets Normalize the article into a lightweight implementation spec Decide what belongs in Terraform Decide what belongs in the Databricks bundle Generate files in a predictable project structure Produce a TODO.md file for unresolved values This approach turns Copilot from a generic assistant into a specialized code-conversion tool. However, there are some constraints I had to be mindful of when developing skills: Context window limits. The model has limited space to read instructions, process input, and generate output. Long prompts can cause files to be cut off or steps to be skipped. Non-determinism. Output may vary between runs, even with strict instructions. I always lint, validate, and review the diff before committing. Boundary leakage. Models may invent plausible but incorrect values. The TODO.md pattern must be enforced as a rule, not a suggestion. Model and tool drift. Copilot's model and tool surface change over time. I use example inputs and outputs as repeatable sanity checks. Maintainability. A skill is code-as-prompt and will age with the platforms it targets. I keep skills narrowly scoped so they stay easy to update. I'll explain the TODO.md file in more detail later in this post. The GitHub repo The repository can be found at the link MarcoScagliola/CopilotBlogToCode Below you will find a function I have added that, when invoked, deletes all the files produced by the skills, so you can test the repo from a clean state. python .github/skills/blog-to-databricks-iac/scripts/reset_generated.py --force; If you want to tried it out, please clone and try it on your copy. In GitHub Copilot, I usually keep: Model as Auto Foer the configure tools I keep just the built-in tools selected. Below you can find the prompt that I use to run the skills and have the blog analysed. Use the blog-to-databricks-iac skill on this article: https://techcommunity.microsoft.com/blog/analyticsonazure/secure-medallion-architecture-pattern-on-azure-databricks-part-i/4459268 Inputs: workload: blg environment: dev azure_region: uksouth github_environment: To make this more repeatable and less manual, I've added a prompt file at run-blogToDatabricksIac-selected-tools.prompt.md, which can be run directly from VS Code by opening the file and clicking the run button at the top. Feel free to experiment with it and let me know what you think. Further instructions on how to use the repo are available READ_FIRST.md. Following you will find the exact repository setup I used for this workflow, starting with my initial configuration and ending with the final directory structure and files. 1. Create a new GitHub repository and clone it locally I started by creating a new repository on GitHub, then cloned it to my local machine so I could add the Copilot skill, Terraform scaffolding, and Databricks bundle files in a centralized location. git clone https://github.com/YOUR-ORG/blog-to-databricks-iac.git cd blog-to-databricks-iac This approach keeps the workflow organised from the start: the repository exists on GitHub first, and the local clone becomes the working directory for all subsequent setup steps. 2. Create the GitHub skill folder structure (first iteration) GitHub Copilot skills are file-based and centered on a SKILL.md file inside a skill folder. GitHub's current pattern places these under .github/skills/ . I used the script below to create the folder hierarchy for my initial integration. mkdir -p .github/skills/blog-to-databricks-iac/scripts mkdir -p .github/skills/blog-to-databricks-iac/templates mkdir -p infra/terraform mkdir -p databricks-bundle/resources mkdir -p databricks-bundle/src This script generates the structure depicted below. 3. Add the main skill definition Next, I created the SKILL.md file at .github/skills/blog-to-databricks-iac/ . The orchestrator decides what happens and in what order, while each specialist decides what its own file should contain (as an example the Terraform specialist owns the Terraform, the bundle specialist owns the bundle, and so on). In practice, SKILL.md turns Copilot from a general assistant into a domain-specific generator for this repo. GitHub documents this SKILL.md-based structure as the foundation of agent skills. My first iteration of .github/skills/blog-to-databricks-iac/SKILL.md> was very simple and can be found here. 4. Add a script to fetch and normalize the blog article Next, I created a Python script that the main orchestrator SKILL.md invokes to read the blog article. This script is stored at .github/skills/blog-to-databricks-iac/scripts/ and named fetch_blog.py . Within SKILL.md , the script is invoked as shown below. ### 1. Fetch article ```bash python .github/skills/blog-to-databricks-iac/scripts/fetch_blog.py "<url>" ``` If fetch fails, stop and return the fetch error output. Do not retry; surface the error to the user and wait for guidance.</url> The script validates the URL, fetches the HTML with a 30-second timeout, and uses a spoofed Mozilla User-Agent to avoid being blocked by CDNs (Content Delivery Networks). It reads through the HTML one tag at a time, flagging when it enters relevant sections like paragraphs, headings, or code blocks, and buffering text until the tag closes. Before storing anything, it cleans the text by decoding HTML objects, collapsing whitespace, and trimming edges. As it parses, the script also scans for cloud platform keywords: AWS, S3, Azure, ADLS, GCP, Google Cloud. The first match wins; if none are found, it returns unknown. This is a quick heuristic, not authoritative. Finally, it outputs clean JSON with the extracted data: title, headings, paragraphs, code blocks, and cloud hint, capped at reasonable sizes to keep the output manageable. If anything goes wrong, such as a network error, timeout, bad HTML, or empty content, the script exits cleanly with a structured error message, making it easy to integrate into larger workflows without surprises. The Python scrip can be found here. 5. The output and output contract Now I needed to think about the output I wanted GitHub Copilot to deliver through the skills. To reiterate, I needed the following: File Name Description README.md This is the operator-facing runbook that turns the generated artifacts into a working deployment. It contains no unresolved placeholders and no embedded credentials. The header summarizes the architecture and links back to the source blog. A prerequisites section lists required Azure access, Entra permissions, GitHub Environment setup, and local CLI versions. It includes tables of always-required GitHub secrets and variables, plus conditional ones based on deployment mode. Step-by-step numbered sections walk through bootstrapping the deployment principal and populating the GitHub Environment. Workflow blocks describe each Terraform validation, infrastructure deployment, and DAB deployment step, including file paths, triggers, and outputs. A commands section lists the exact Terraform and Databricks bundle sequences to run. Finally, assumption notes point the operator to TODO.md and SPEC.md for context. TODO.md The operator's checklist of remaining tasks. It uses a strict five-section format (Heading, What this is, Why deferred, Source, Resolution, Done looks like) with no commands or code, only concepts and decisions. Each section captures a different layer of post-deployment work, pre-deployment tasks like RBAC roles and GitHub secrets, deployment-time inputs like region and environment, post-infrastructure setup like Key Vault secrets and external locations, post-DAB work like Unity Catalog grants and job schedules, and architectural choices the orchestrator couldn't make (network posture, schemas, partitioning). Every entry comes from something the article left unstated, plus the universal post-deploy work for any Databricks deployment. The operator works through TODO.md sequentially, resolving each item before the system is production-ready. SPEC.md The structured, source-faithful read of the blog article, organized by checklist. Every item is marked as a stated value, inferred from code or diagrams, or "not stated in article." It includes architecture details, Azure services configuration, Databricks setup, data model, security and identity requirements, and observations. SPEC.md is the single source of truth that Terraform and DAB generators read from, TODO.md is populated from every "not stated" entry, and README.md references it for assumptions. This ensures the deployment is built on documented decisions, not hidden assumptions. Together, these files create a clear boundary: SPEC.md answers what the blog says, TODO.md captures what's missing or must be decided, README.md tells you exactly how to deploy. This split is enforced by validation rules that fail if any content duplicates across the three files. To make these files as repeatable as possible, I needed two things: Two templates, one for README.md and one for TODO.md , that the orchestrator fills in from SPEC.md at generation time. A broader delivery contract, output-contract.md , which lists the five files the orchestrator must produce. README.md and TODO.md are two of those five, and the templates are how they get produced. The output-contract.md file defines a strict, ordered format that the agent must follow when transforming a blog article about Databricks-on-Azure architecture into a runnable repository. The first commit was deliberately minimal, as you can see from the file available here. No leaf-skill routing, no repo-context.md, no GitHub Actions workflows, no validation rules, no entry-field templates for TODO.md . That commit's single job was to lock down the shape of the output: what gets produced and in what order. Every commit since has refined how to produce that shape without changing what gets produced. Putting the contract in the very first commit gave every later change a fixed reference point. Every leaf skill, generator script, and validation rule I've added since has fit into one of its five sections. The pipeline has changed; the deliverables haven't. The structure of the GitHub repo at commit 17ab443 can be see in the pictorial below. 6. The README.md and TODO.md templates After iteratively working on the orchestrator, a clear pattern emerged, the code-generation paths were kind of stable, but the documentation outputs weren't. Every run produced README.md and TODO.md from scratch in free-form Markdown. Across runs, the same content kept drifting. Section ordering changed between runs and the explanation of GitHub Environments was rewritten with subtle wording differences. RBAC roles appeared sometimes as lists, sometimes in prose, sometimes split across sections. Universal post-deploy actions (create the secret scope, populate the vault, set up Unity Catalog grants) were re-derived every time, occasionally with steps missing. The root cause was that the orchestrator was treating durable, universal content as if it were per-run content. So I've decided to add two templates: README.md.template and TODO.md.template. Templates separate universal content (RBAC, TODO sections, GitHub setup) in the template from per-workload content (catalog names, credentials) substituted from SPEC.md. This delivers consistency across runs. The README and TODO are structurally identical, so readers can navigate them intuitively. Universal content is correct by construction; I write it once, review carefully, and every run inherits that quality. Validation also becomes more precise, and the agent's job shrinks from open-ended writing to mechanical substitution, which is easier to validate and maintain. Templates introduce clear vocabulary: {placeholder} is filled by the orchestrator at generation time, by the deployer at run time. Finally, templates enforce traceability: every "not stated in article" entry in SPEC.md automatically becomes a TODO entry via the from SPEC.md slot, making this an automatically-enforced rule. I'm invoking the templates in the orchestrator as shown below. The Git commit with this code can be found at this link. ### 3.1 Generate README from template Load the template: `.github/skills/blog-to-databricks-iac/templates/README.md.template` ### 3.2 Generate TODO from template Load the template: `.github/skills/blog-to-databricks-iac/templates/TODO.md.template` 7. The output of the fetch_blog.py file and the interaction with the orchestrator When the orchestrator invokes fetch_blog.py , the script produces a JSON output and passes it back to the orchestrator. The orchestrator then reads the JSON document into its working context and maps each field onto an analysis checklist. The title and meta description establish the article identity and scope. Headings with their levels reveal the structure, helping the agent locate sections about architecture, security, data flow, and naming. Paragraphs provide evidence for stated values like regions, resource types, and RBAC models. Code blocks become the source of inferred values. As an example, a Terraform snippet might reveal SKU choices or naming patterns not mentioned in the text. These inferred values get tagged "inferred from code snippet" when recorded. The cloud hint acts as a sanity check that the article actually describes an Azure architecture. For every checklist item, the agent records either an extracted value or the literal string "not stated in article". This becomes SPEC.md , the single source of truth for everything downstream. SPEC.md drives every subsequent step. Steps 3 through 7 (the Terraform module, workflows, and Databricks bundle generators) read architectural decisions from it. Step 8 then produces TODO.md by converting every "not stated in article" entry into a TODO item the operator must resolve before deployment. What I find worth pointing out is how little the output contract has actually moved since that very first commit. The implementation underneath has changed completely. Leaf skills emerged, generator scripts came in, validation rules got added, a soft-delete state machine showed up to handle Key Vault recovery. None of those existed at the start. But what the orchestrator delivers, the list of files it puts on disk, has stayed exactly the same. We have a much larger SKILL.md today that still mirrors the initial five-item output list. The contract itself has changed by exactly one line: the addition of "Design of the architecture" to section 5. SPEC.md : the structured, source-faithful read of the article, organised by the analysis checklist ( link ) TODO.md : the operator's checklist of everything the article didn't specify, plus the universal post-deploy actions ( link ) Terraform code under infra/terraform/ : the platform layer with networking, storage, identities, Key Vault, workspace ( link ) Databricks Asset Bundle under databricks-bundle/ : the workload layer with jobs, entry points, environment configuration ( link ) README.md : the operator runbook, with the architecture design diagram embedded ( link ) If the JSON contains an error, the orchestrator stops immediately. Per the skill rule "If fetch fails, stop and return the fetch error output. Do not retry," the error surfaces to the user rather than propagating downstream. So the script's output is the raw evidence pack: title, structure, prose, code, cloud hint. The agent uses it to fill the architecture spec, which parameterises every generated artifact. At this point the fetch_blog.py output is sent to Step 2 of the orchestrator, as shown in the code snippet below. ### 2. Analyse article Analyse the fetched article against the structured checklist in `.github/skills/blog-to-databricks-iac/references/blog-analysis-checklist.md`. The analysis covers the article text, diagrams, screenshots, and code snippets. And, much later in the orchestrator, Step 8 closes the loop by turning everything that's been recorded into the two operator-facing documents: ### 8. Generate README and TODO from templates Use the templates in `.github/skills/blog-to-databricks-iac/templates/`: - `README.md.template` -> `README.md` - `TODO.md.template` -> `TODO.md` 8. How this actually came together What I've described so far is how the orchestrator works currently. The reality of building it was much cumbersome , but also fun. I got from the first version to the current one by iterating. Rerun the orchestrator, find the defect, identify the rule that would have caught it, add the rule to the skill that owns the artifact, rerun. The reason I'm calling this out now, before walking through the rest of the pipeline, is that everything from this point on is a story about a specific lesson learned that way. The leaf skills exist because a single SKILL.md got too dense. The restricted-tenant guardrails exist because the deployment failed against a tenant that couldn't read Microsoft Graph. The validation harness exists because prose rules weren't catching the regressions that mattered. The soft-delete state machine exists because the same vault name kept colliding with a previous deploy. None of these rules were present from day-one. So in the next sections I'll walk through how the pipeline actually matured: how the single skill split into a graph, what the inner regenerate-fix loop felt like in practice, the day the project pivoted to support restricted tenants, the bugs that became rules, and the Key Vault soft-delete state machine that closed the project out. 9. From a single skill to a skill graph When I started, everything lived inside a single SKILL.md . It was simpler that way, and to be honest, at that point I didn't yet know which rules would actually matter. But as I kept rerunning the orchestrator on the article, a pattern emerged. Each rerun produced something that broke in a slightly different way, and the fix always belonged to a very specific concern: Terraform authoring, bundle structure, workflow generation, or the orchestration logic itself. Stuffing the rules for all of them into one file was making the orchestrator unreadable and, worse, was silently dropping rules when the context window got tight. So I split it. The orchestrator stayed at the top, kept routing the work and validating the result, and each concern got promoted to its own leaf skill. The Databricks bundle skill itself ended up needing one more split a few days later, it had got too dense, so I broke it into two leaves: databricks-yml-authoring ( link ) Python-entrypoints ( link ) The diagram below shows the shape the repo has today. The orchestrator now does almost no authoring. It owns the sequence of steps, the contract, and the validation gates, while everything else is delegated. This was the single biggest readability win. I wish I'd done it earlier. The REPO_CONTEXT.md is one extra node in that diagram that I want to call out But I'll come back to later in section 12. 10. The inner loop: rerun, fail, fix the skill If I had to describe the middle of this project in one sentence, it would be: every commit was a regeneration. I'd run the orchestrator end-to-end against the article, inspect the generated Terraform, the bundle, the workflows. I'd find a defect, identify the rule that would have prevented it, add that rule to the skill that owns the artifact, then rerun. As shown in the image below. This loop is what I think people miss when they treat AI-generated infrastructure code as a one-shot. The first run is never the deliverable. The deliverable is the skill that produces good runs. The generated files are disposable and can always be reproduced. The skill is what carries the knowledge forward. I had to actively resist the temptation to fix bugs in the generated code directly. Patching infra/terraform/main.tf by hand fixes today's run but not tomorrow's, because the rule that would prevent the bug doesn't exist anywhere. So I made it a discipline: never edit the output, always edit the skill, then regenerate. 11. Restricted-tenant compatibility The bug was simple to describe and brutal to fix: the deployment principal in the target tenant couldn't read Microsoft Graph. Any Terraform data source that resolved an Entra name to an object ID at plan time (e.g., azuread_user , azuread_group , azuread_service_principal ) blew up at terraform plan. My first instinct was to think "I just give the principal Graph permissions". But in a lot of real environments this is not possible. The principal that runs your IaC is governed by a security team, the team has a policy, and the policy says no Graph reads. The pivot was getting the skill to produce Terraform that never reads Graph. Object IDs are inputs, not lookups. They come in as trusted secrets, the workflow exports them as TF_VAR_* , and Terraform consumes them as variables. No data " azuread_* " block is allowed in the generated code, ever. I thought this was a simple fix. It wasn't. It cascaded into about six other things: App Registration vs Service Principal object IDs. The workflow was being given the wrong one. Role assignments need the Enterprise Application (Service Principal) object ID, not the App Registration object ID. The two are different objects in Entra with different IDs. I encoded the distinction in the skill as *_SP_OBJECT_ID (the Service Principal) versus *_CLIENT_ID (the App Registration's application ID). Naming carries the meaning now, so the wrong value is hard to pass. Single-principal mapping. In some tenants you only have one principal and it has to play both deployment and runtime roles. The skill grew a layer_sp_mode = existing input so the generator stops trying to create a new Service Principal and reuses the deployment one instead. Key Vault access policies, gone. Access policies were Graph-touching, and not all tenants support them anyway. The skill switched fully to RBAC role assignments (Key Vault Secrets User, and so on). A few cascading bugs followed, but this was the right call. It took some time to harden the Terraform skill against everything the restricted tenant was throwing back. Each iterations had the same shape, each orchestrator runs, hits a fresh provider error, I add the rule, run again, hit the next one. The commit subjects from that run are basically a transcript of the conversation I was having with the platform. 12. The bugs that became rules There are three bugs that I believe are worth telling the story of, because they each illustrate a slightly different lesson. The HCL trim() arity bug. The generator emitted trim(var.something) in a validation block. HCL's trim() takes two arguments, not one. The function I actually wanted was trimspace() . This is the kind of bug that any human would catch in a code review in two seconds, and which the model produced confidently because the shape of the call looked right. I added the rule to the Terraform skill ("for whitespace trimming use trimspace, never trim") and the bug never came back. Lesson: even for trivial syntactic mistakes, the fix belongs in the skill. The variable shadowing bug. The deploy workflow had a job-level env: block that set TF_VAR_key_vault_recover_soft_deleted to a static value. A detection step earlier in the workflow was supposed to compute the right value at runtime and write it via $GITHUB_ENV . The problem is that GitHub Actions resolves job-level environment variables before $GITHUB_ENV writes take effect, so the static value always won and the dynamic one was silently ignored. The fix was to never set the recovery flag at job level. It must be written in the detection step, on every code path, including the trivial "no recovery needed" path. Lesson: state must be explicit, not inherited. If a flag has three possible meanings, three code paths must each write it. The hardcoded -platform suffix. The workflow had a shell-side suffix that someone (let's be honest, the model) had invented to make the resource group name "look right". When recovery logic started running and the workflow looked for the canonical resource group, it looked for -platform instead of whatever the Terraform locals.tf actually emitted. The result was that the recovery handler was happily reaching past the real resource group and into a different one. I made it a rule in the orchestrator: workflow-invented suffixes are not permitted. Naming is owned by Terraform's locals.tf . There are seventeen more defects in the catalogue, and the pattern is the same in every case. The bug surfaces, the rule gets written, the rule lives in the skill that owns the affected artifact. There is no implementation-learnings.md in the repo. There used to be, but I've deleted it because a tracked log of past bugs, sitting next to a skill that's already supposed to encode the lessons from those bugs, is a duplication waiting to drift. I believe that if the rule is in the skill, the log is redundant. If the rule isn't in the skill, the log is an evidence that I haven't finished the work. Either way, the right place for bug history is git log. 13. Splitting "the skill" from "this repo's defaults" I then wanted the orchestrator to be portable, but every run kept needing the same handful of decisions. Which Azure region by default? Which environment names? Which catalog naming convention? These weren't part of the article. They weren't part of the Terraform skill either. They were specific to this repository's opinion about how things should be deployed. If I baked them into the orchestrator, the orchestrator stopped being portable. If I left them out, every run produced unhelpful "not stated in article" entries for the same five universal decisions. The answer was a new file called REPO_CONTEXT.md stored in the repo root. It's read by the orchestrator before generation and it carries the defaults that are owned by the repo, not by the skill. The split looks like this in practice: SKILL.md answers the question "how do I turn an article into a runnable repo?" It is portable. REPO_CONTEXT.md answers the question "what does this repo default to when the article doesn't say?" It is local. Cloning the orchestrator into another GitHub project is now a clean operation. You take the skill, you write your own REPO_CONTEXT.md , and the same generator produces output appropriate to your environment. 14. The Validations Most of the rules I'd written into the skills were prose. "Don't invent suffixes." "Object IDs are inputs, not lookups." "Every required Terraform variable must have a matching TF_VAR_* in the workflow." The model is good at following prose rules most of the time. So a few of the most regression-prone rules became executable. The most important one is scripts/validate_workflow_parity.sh . Every variable declared in infra/terraform/variables.tf must appear as a TF_VAR_* export in the deploy workflow. The script greps both files, diffs the sets, and exits non-zero if they don't match. It is run at the end of generation. If it fails, the run failed, even if everything else looks fine. This caught real bugs. The most embarrassing was a variable I'd added to variables.tf and forgot to wire through the workflow. Terraform plan would prompt interactively for it on a non-interactive runner, and the run would hang. The rule of thumb I've ended up with is: prose rules are the default, but if a rule has been violated more than twice, it gets promoted to an executable check. There's a short list of those checks now, and it's the load-bearing one. 15. Key Vault soft-delete state machine Key Vaults in Azure have soft delete on by default. When you delete a vault, it sticks around for ninety days in a "soft-deleted" state. If you try to create a vault with the same name in the same subscription during that window, the deploy fails. The right behaviour is to recover the soft-deleted vault, not create a new one. The first version of my recovery handler covered exactly one case: if the vault is soft-deleted, recover it. This worked the first time I ran it. The second time, the recovered vault came back into the previous resource group, not the new one I had just created. Terraform then tried to create a new vault in the correct resource group and failed because the name was already taken globally. The handler had no concept of "the recovered vault is in the wrong resource group." So I added that case. The third time, the previous resource group itself was gone, and the handler was looking for it to verify the move. So I added that case too. By the end, the state machine had three distinct cases and two preconditions, as shown in the diagram below. The reason I keep coming back to this state machine is that it captures something that I think is generally true about agent-generated infrastructure code. The happy path is easy and meaningless, while the value is in the failure modes. The first version that worked on a clean tenant was about ten lines of bash. The version that works on a tenant that has been deployed-into and partially-torn-down five times is six times longer, and every additional line of it corresponds to a real environmental condition that I had to learn the hard way. 16. What I've learned so far I'm not going to pretend the full list of principles below was clear to me on day one. Every single one of these was learned by getting it wrong first. Looking back at the history, though, they are the ones that survived contact with reality. The contract precedes the implementation. output-contract.md was committed before any generator existed. Locking the shape of the deliverable first meant every later change had a fixed reference point. Generators, not stencils. Workflows are produced by Python scripts that take parameters and emit YAML. When restricted-tenant logic and the soft-delete state machine arrived, they needed conditional structure that a static template can't express. Every bug becomes a rule. Patching the generated code is a tax on tomorrow's run. While patching the skill is an investment. Each concern has a clear owner. The orchestrator routes, the leaves author, and the repo context holds the local defaults. Restricted-tenant compatibility is non-negotiable. No Microsoft Graph reads from generated Terraform. Object IDs are trusted inputs. Single-principal mapping is supported. Naming is owned by Terraform. No suffixes invented in shell. The validation harness enforces this. State must be explicit, not inherited. Every workflow run writes its own flags. No reliance on env defaults from a previous step or a previous run. Validation is executable when a rule has been violated more than twice. Prose rules are the default. Promotion to a script is earned. Operator docs describe concepts, not commands. Command syntax ages out, while conceptual descriptions don't. The TODO template enforces this rule. Add strong testing at the end of the process, once all the files are generated. Each run may produce slightly different output and introduce bugs, even if the previous run was successful. End-to-end runs against dirty tenants are the truth. The acceptance test isn't a clean-room deploy. It's a deploy into a tenant that has soft-deleted vaults, lingering RGs, and existing role assignments. Until that works, the project isn't done. From time to time, skills need to be reviewed and consolidated. The summary above of the journey is the one I find most useful to share when people ask whether this approach actually goes anywhere. From an empty repo to a generator that produces a deployable, restricted-tenant-compatible infrastructure-as-code repository from a blog URL, with executable validation and a recovery state machine that survives a previously-deployed environment. The first commit was an empty workspace. The last commit was the one where the same orchestrator, run against the same blog, against a tenant carrying state from five previous runs, deployed cleanly with no manual intervention. That is what I what I was aiming to achieve when I started! Thanks for reading.697Views0likes0Comments