azure databricks
128 TopicsSimplify private connectivity for Azure Databricks Serverless with Private Network Gateway
Recently, we announced the public preview of Private Network Gateway (PNG) for Azure Databricks - a simpler way to connect Azure Databricks serverless workloads to resources accessible from your Azure Virtual Network. With a single managed connection into your network, PNG helps reduce connectivity complexity while letting you control which resources serverless workloads can access. In this post, we explain what PNG means for private connectivity and how to get started. PNG brings the serverless experience together with the Azure networking environment and controls organizations already use, helping make serverless practical for a broader set of enterprise workloads. One connection to your network Azure Databricks serverless compute runs in an Azure Databricks managed network. This removes infrastructure management overhead, but private resources still need an explicit network path from serverless compute. Today, connecting serverless compute to resources you manage such as databases, Kafka clusters, and internal APIs could require separate private endpoints, load balancers, and proxy VMs for individual resources. That complexity grows as workloads need to reach more services across virtual networks, peered networks, and on-premises environments. Private Network Gateway introduces a simpler model: one gateway to your network instead of separately creating connectivity infrastructure for each resource. With Private Network Gateway on Azure Databricks, you can: Simplify private data ingestion. Use Lakeflow Connect on serverless compute to ingest from supported databases across your virtual network and connected on-premises environments. Connect AI agents to private services. An agent built on Azure Databricks can call a private MCP server you host. Use private package repositories. Install Python libraries from a private PyPI, Artifactory, or Nexus repository inside your network. Route egress through your existing firewall. Send traffic through your firewall or content inspection service so egress can be filtered and logged using your own tools. Use your own source IP. SaaS applications such as Salesforce can see a source IP belonging to your organization. Getting started is straightforward Private Network Gateway is designed to simplify the setup needed to bring serverless compute into your network. You delegate one subnet in your Azure Virtual Network to Azure Databricks. Private Network Gateway then establishes a managed, encrypted gateway from serverless compute into that subnet. The gateway is configured within a Network Connectivity Configuration (NCC), the account-level object used for Azure Databricks serverless networking. You can attach the NCC to your workspaces, and supported serverless workloads can then reach the private destinations you allow. And because the gateway is managed for you, there are no gateway VMs for you to deploy, patch, or scale in your network. Keep control of your Azure network Simplifying connectivity doesn’t mean giving up control of your network boundary. Private Network Gateway provides a dedicated path into your network rather than a shared appliance carrying other customers’ traffic. The gateway applies workspace-level access controls before traffic leaves, and isolation is enforced through encapsulation and network security rules. Once traffic reaches your subnet, your existing Azure networking controls continue to determine what serverless workloads can reach. This includes your route tables, network security groups, DNS resolvers, and security appliances. You also control how much traffic travels through the gateway: Specific destinations: Send only the fully qualified domain names you specify through Private Network Gateway. Other traffic retains its normal path. All traffic: Route outbound traffic through your network, except traffic matching a more specific Private Link or service-endpoint path. This can be used when you want broader egress inspection through your firewall or want traffic to leave through your own IP addresses. Private Network Gateway is also additive to your existing connectivity architecture. It sits alongside the private connectivity and egress controls you already use and can be enabled or removed without changing the existing setup. Bringing serverless to more of your Azure Databricks workloads Azure Databricks combines Databricks capabilities with native integration across the Azure ecosystem. Private Network Gateway extends that Azure Databricks experience to private networking for serverless workloads. Instead of building connectivity infrastructure for every resource, you can establish one managed gateway from serverless compute to your network and keep using your existing Azure network controls to decide where traffic goes. The result is a simpler approach to connecting serverless workloads to private enterprise resources while keeping the network boundary in your control. Get started today Private network gateway - Azure Databricks | Microsoft Learn Introducing Private Network Gateway | Databricks Blog248Views1like0Comments
Optimize selective analytics reads in Azure Data Lake Storage with ABFS Vectored Read
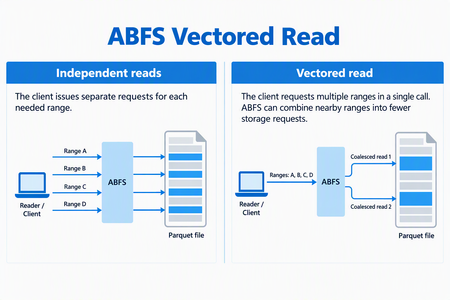
ABFS Vectored Read helps compatible analytics engines reduce request overhead when reading selected portions of columnar files in Azure Data Lake Storage. By coordinating multiple noncontiguous byte ranges through the Azure Blob File System (ABFS) driver, it can combine nearby ranges into fewer storage requests and execute those requests asynchronously. For data engineers working with selective Parquet queries, this brings the storage read pattern closer to what the query needs: a coordinated set of ranges rather than a collection of independent small reads. When the Parquet reader supports vectored I/O and the runtime includes a compatible ABFS client, Spark workloads that use higher-level APIs can enable this capability through configuration - without rewriting queries, changing application logic, or migrating data. Why selective reads need coordinated I/O Consider a query that selects a few columns from a Parquet dataset and filters out most row groups. The reader can skip much of the data the query doesn't need, but the data it needs may be spread across different parts of the file. Reading each range independently can create many small storage requests. Each request carries network and processing overhead, so selecting less data doesn't necessarily remove the cost of coordinating those reads. Vectored Read lets a compatible reader provide the ranges together, giving the client an opportunity to plan the I/O as a group. How ABFS Vectored Read works A compatible reader submits the file ranges it needs together. ABFS validates and sorts the ranges, combines nearby ranges when appropriate, and divides the resulting work to fit its read buffers. It then queues the storage requests asynchronously and returns the requested bytes to the corresponding range buffers. Illustrative request pattern, not a benchmark. Actual grouping depends on range layout and client configuration; coalesced storage requests can include bytes between the requested ranges. This is a client-side optimization. It does not change the file format or rewrite your stored data. The engine still receives the data for the ranges it requested. What this means for your workloads For compatible selective-read workloads, Vectored Read offers: Less request overhead: Combining nearby ranges can reduce separate storage requests and network round trips. Coordinated I/O: Asynchronous reads allow the client to work on multiple requested ranges without treating every range as an isolated operation. Configuration-based adoption: Compatible Spark workloads using the Hadoop Parquet and ABFS path can use the feature without rewriting their queries. The best starting point is a workload that reads selected portions of Parquet files through abfs:// or abfss://. Full sequential scans may see less benefit, and engines that bypass the Hadoop/ABFS path do not use this capability. Support depends on the Hadoop, hadoop-azure, and parquet-hadoop libraries included in the runtime, not only on the Spark version. See Availability and resources for the minimum versions and verification guidance. The benefit depends on the number, size, and spacing of requested ranges, the coalescing configuration, storage and network latency, concurrency and caching. Combining ranges can reduce requests and round trips, but it can also read additional bytes between noncontiguous requested ranges. Compare query duration, storage transactions, bytes read, and resource utilization against a controlled baseline using representative data and concurrency. Get started First, verify that your runtime contains Apache Hadoop 3.3.5 or later, including the hadoop-azure module, and parquet-hadoop 1.12.3 or later. The presence of an ABFS URI alone does not establish that the optimized implementation is installed. For Spark, enable the Parquet setting before the application starts, using the spark.hadoop. prefix: spark-submit \ --conf spark.hadoop.parquet.hadoop.vectored.io.enabled=true \ <other-options> \ <application> Replace the command placeholders with your normal submission options and application. Set the property explicitly rather than relying on a default, which can vary by packaged Parquet version. For managed services, use the service's supported cluster or session configuration mechanism. Availability and resources Azure Databricks does not currently support ABFS Vectored Read because its runtime ships an ABFS version that does not include this capability. In addition, Photon does not use the ABFS driver for data access, even when a workload uses an abfs:// or abfss:// URI. Therefore, the presence of an ABFS URI alone does not indicate that Vectored Read is available. For other packaged or managed runtimes, verify that the environment includes Apache Hadoop 3.3.5 or later with the hadoop-azure module, and parquet-hadoop 1.12.3 or later. Start with one representative selective-read workload and compare it with your baseline. For background, see the ABFS driver overview.134Views1like0CommentsACID Transactions on Azure Databricks: What Breaks Without Retry Logic
A warehouse has always guaranteed that updating two tables together either both succeed or both roll back. A lakehouse, historically, has not. Multi-table, multi-statement transactions reaching general availability on Unity Catalog close that gap directly on Delta Lake and Apache Iceberg tables, without a separate transactional system sitting in front of the lake. Transactions on Azure Databricks reached general availability on October 16, 2026. I covered the headline already in a shorter piece. This is the expanded version: both transaction modes in full, the four documented conflict scenarios, a staging-and-validation ETL pattern end to end, JDBC and Python client code with retry logic added on top of what the documentation shows, and the specific limitations worth knowing before a production pipeline leans on this. [INSERT IMAGE HERE using the editor's own Insert Image button, not pasted markup. Upload a diagram showing two tables being updated inside one atomic boundary, with a commit arrow joining both, or a screenshot of a BEGIN ATOMIC block running in the SQL Editor. Suggested alt text: "Two tables updated inside a single atomic transaction boundary on Azure Databricks".] 1. Why this used to need two separate systems Moving money between two accounts and writing an audit row look like three small operations, but a lakehouse without native transactions only gave you ACID guarantees per statement, per table. If the audit insert failed after both balance updates had already landed, nothing rolled the first two back automatically. Teams built custom reconciliation jobs to detect and repair that drift, or they ran the whole workflow on a separate warehouse system and synced results back into the lake afterward, duplicating both the data and the governance policy that protected it. Multi-statement, multi-table transactions remove that second system. The requirement is narrow but firm: every table written to must be a Unity Catalog managed table, Delta Lake or Iceberg, with catalog commits enabled. ALTER TABLE main.default.accounts SET TBLPROPERTIES ('delta.feature.catalogManaged' = 'supported'); My take: that single table property is doing more work than its one line suggests. It is the same catalog commits feature that cross-engine ABAC depends on for external reads, which means a table you enable for transactions is, incidentally, already a step closer to being safely readable from outside Azure Databricks too. Worth enabling deliberately on tables you expect to matter for governance later, not only the ones with an immediate transactional need. 2. Two modes, and two different conflict-detection granularities Non-interactive transactions use a `BEGIN ATOMIC ... END;` block. Azure Databricks commits automatically if every statement succeeds, and rolls back automatically if any statement fails. This mode runs on any SQL warehouse, serverless compute, or a cluster on Databricks Runtime 18.0 and above, and it accepts SQL, PySpark `spark.sql()` calls, and Scala `spark.sql()` calls alike: BEGIN ATOMIC UPDATE accounts SET balance = balance - 100 WHERE id = 1; UPDATE accounts SET balance = balance + 100 WHERE id = 2; INSERT INTO audit_log VALUES (1, 2, 100, current_timestamp()); END; Interactive transactions use `BEGIN TRANSACTION`, followed by an explicit `COMMIT` or `ROLLBACK`, and they only run on a SQL warehouse: BEGIN TRANSACTION; UPDATE accounts SET balance = balance - 100 WHERE id = 1; UPDATE accounts SET balance = balance + 100 WHERE id = 2; INSERT INTO audit_log VALUES (1, 2, 100, current_timestamp()); COMMIT; The two modes are not interchangeable conveniences, they detect conflict at a different granularity. Non-interactive transactions detect conflict at the row level: two transactions touching different rows in the same table do not conflict with each other. Interactive transactions detect conflict at the table level, except for unconditional appends. If your workload has many small transactions running concurrently against a shared table, that difference alone decides whether most of them succeed or most of them fail and retry. 3. Optimistic concurrency, consistent snapshots, and four ways to conflict Neither mode locks a row while a transaction is open. Both use optimistic concurrency: the transaction runs freely, and Azure Databricks checks for conflicting changes only at commit time. If another transaction modified the same data after yours began, your commit fails and the transaction needs to be retried against fresh data. The first read of a table inside a transaction fixes a snapshot, and every later read of that same table inside the same transaction uses that same snapshot, even if another session commits a change to it in between: BEGIN TRANSACTION; SELECT * FROM products WHERE product_id = 1001; -- another session now runs, and commits: -- UPDATE products SET price = 29.99 WHERE product_id = 1001; SELECT * FROM products WHERE product_id = 1001; -- still returns the original price, the snapshot was fixed -- at the first read, not re-taken on the second one COMMIT; Four distinct scenarios can cause a commit to fail: Write-write conflicts: two transactions update or delete the same rows. Write-read conflicts: another transaction modified rows that yours read, on a table your transaction also wrote to. This applies only under Serializable isolation. Phantom read conflicts: another transaction inserted new rows matching a predicate your transaction read. This applies under both WriteSerializable and Serializable isolation. Metadata conflicts: another transaction changed the table's schema or properties mid-transaction. Uncommitted changes inside an interactive transaction are visible only to your own session. A second session querying the same table sees nothing until you run `COMMIT`, which is the isolation guarantee that keeps one session from reading data another session might still roll back. 4. Hands-on: a staging, validate, and merge pattern The pattern that benefits most from this feature is the one almost every ETL pipeline already has informally: land data in staging, check it, then merge it into production only if it passes. Written as one atomic unit, a failed check rolls back the staging load too, instead of leaving half-validated rows sitting in a staging table for the next run to trip over: BEGIN ATOMIC -- Stage today's incoming rows INSERT INTO staging_customers SELECT * FROM external_customers WHERE ingest_date = current_date(); -- Fail the whole batch if any row looks malformed IF (SELECT COUNT(*) FROM staging_customers WHERE ingest_date = current_date() AND email NOT LIKE '%@%') > 0 THEN SIGNAL SQLSTATE '45000' SET MESSAGE_TEXT = 'Malformed email addresses in today''s batch'; END IF; -- Only reached if validation passed MERGE INTO customers AS target USING staging_customers AS source ON target.customer_id = source.customer_id WHEN MATCHED THEN UPDATE SET * WHEN NOT MATCHED THEN INSERT *; END; `SIGNAL` is what makes this work as a hard stop rather than a warning: raising it inside a `BEGIN ATOMIC` block triggers the same automatic rollback as any other statement failure, which means the staging insert from the first step also gets undone, not just the merge that never ran. 5. Error handling you control: SIGNAL, ROLLBACK, and GET DIAGNOSTICS Interactive transactions give you the same decision point without forcing it into a single block. You can insert, inspect the result with an ordinary query, and only then decide whether to commit or discard: BEGIN TRANSACTION; UPDATE inventory SET quantity = quantity - 50 WHERE product_id = 2001; -- inspect before deciding SELECT quantity FROM inventory WHERE product_id = 2001; -- if the number above is negative, discard everything: ROLLBACK; -- otherwise: -- COMMIT; For non-interactive transactions driven by business logic rather than manual inspection, combine `SIGNAL` with `GET DIAGNOSTICS` to retrieve how many rows the most recent statement actually touched, which is useful for asserting that an update affected exactly the rows you expected before letting the transaction proceed: BEGIN ATOMIC DECLARE rows_touched INT; UPDATE inventory SET quantity = quantity - 50 WHERE product_id = 2001; GET DIAGNOSTICS rows_touched = ROW_COUNT; IF rows_touched = 0 THEN SIGNAL SQLSTATE '45000' SET MESSAGE_TEXT = 'Product 2001 not found, nothing to deduct'; END IF; END; 6. Transactions from an external client, with retry logic the docs leave to you JDBC clients opt into interactive transactions by turning off autocommit explicitly: Connection conn = DriverManager.getConnection(jdbcUrl, properties); try { conn.setAutoCommit(false); Statement stmt = conn.createStatement(); stmt.executeUpdate("INSERT INTO orders (order_id, total) VALUES (1001, 500.00)"); stmt.executeUpdate("UPDATE customers SET last_order = CURRENT_DATE() WHERE customer_id = 5001"); conn.commit(); } catch (SQLException e) { conn.rollback(); throw e; } finally { conn.close(); } The Databricks SQL Connector for Python follows the same pattern with `autocommit=False` on the connection: from databricks import sql with sql.connect( server_hostname="dbc-a1b2345c-d6e7.cloud.databricks.com", http_path="sql/1.0/warehouses/abc123def456", access_token="your-access-token", autocommit=False ) as connection: with connection.cursor() as cursor: cursor.execute("INSERT INTO orders (order_id, total) VALUES (1001, 500.00)") cursor.execute("UPDATE customers SET last_order = CURRENT_DATE() WHERE customer_id = 5001") connection.commit() Neither example above retries on conflict, and under optimistic concurrency, a commit failing because another transaction got there first is not an edge case, it is the expected cost of allowing concurrency without locks. A client built on this feature needs retry logic as a first-class concern, not an afterthought: from databricks import sql import time def run_with_retry(connection_factory, statements, max_attempts=3): for attempt in range(1, max_attempts + 1): with connection_factory() as connection: with connection.cursor() as cursor: try: for statement in statements: cursor.execute(statement) connection.commit() return except Exception as exc: connection.rollback() if attempt == max_attempts: raise # Back off before retrying against fresh data, # the conflict was detected at commit time, so the # transaction must be re-run from the start, not resumed. time.sleep(0.5 * attempt) My take: treat that retry wrapper as mandatory infrastructure, not optional polish, for any application code that writes through an interactive transaction under real concurrency. A transaction that silently never retries will look correct in every single-user test and then fail intermittently the day two users actually collide, which is exactly the kind of bug that is hard to reproduce on demand and easy to misdiagnose as something else. 7. What this doesn't solve The scope has real edges that matter before redesigning a pipeline around this feature: DDL operations, `CREATE TABLE`, `ALTER TABLE`, `DROP TABLE`, must run outside any transaction. Metadata operations that enumerate objects, `SHOW TABLES`, `SHOW DATABASES`, `DatabaseMetaData` calls over JDBC, ODBC catalog functions, and queries against system tables, are not supported inside a transaction on any protocol. Time travel cannot be used inside a transaction. A single transaction can read from or write to up to 100 tables combined, and read from up to 100 views, with up to 100 intermediate commits per table. Every transaction rolls back automatically after 48 hours total duration. Interactive transactions additionally roll back after 10 minutes of inactivity, and still require an explicit `ROLLBACK` afterward to clear the session's transaction state if the session itself is still connected. Row-level concurrency for `MERGE` is not available on AWS GovCloud or on single-user clusters, where `MERGE` falls back to table-level concurrency regardless of which transaction mode you use. Reading a non-transactional external source, Parquet, Avro, CSV, JSON, or a federated JDBC table, inside a transaction requires the explicit `allow_nontransactional_read` hint, and that read is not repeatable: concurrent changes to the source during the transaction can produce an inconsistent read. That last point deserves its own code, because the failure mode if you skip the hint is a hard error, not a silent gap: BEGIN TRANSACTION; INSERT INTO transactional_table SELECT col1, col2 FROM external_json_table WITH (allow_nontransactional_read = true); COMMIT; 8. My perspective on this The detail I keep coming back to is that non-interactive and interactive transactions are not two ways to write the same thing, they are two different concurrency models wearing similar syntax. Row-level conflict detection under `BEGIN ATOMIC` and table-level detection under `BEGIN TRANSACTION` will behave identically in a demo with one writer and completely differently under real concurrent load. Picking between them by which syntax feels more familiar, rather than by which conflict granularity the workload actually needs, is the single most likely way to end up confused about why a transaction "randomly" fails in production when it never failed in testing. I would also flag the metadata-conflict scenario as the one most teams forget to test for. Write-write and phantom-read conflicts are intuitive, two things touching the same data. A schema change landing mid-transaction and invalidating an in-flight commit is a rarer trigger, but it is exactly the kind of event a migration or a parallel DDL job can cause without anyone connecting it to a transaction failing somewhere else at the same time. And the 10-minute idle timeout on interactive transactions is worth building defensively around rather than discovering in an incident: any interactive session that pauses for user input, a manual approval step, a human reading a validation result before deciding whether to commit, needs either a much shorter human-review window than 10 minutes or a design that does not leave a transaction open while waiting on that human at all. Conclusion Multi-table, multi-statement transactions do not make Azure Databricks a warehouse, they remove the specific reason a workload needed a separate warehouse system just to get atomicity across two related writes. The two modes, the four conflict scenarios, and the retry logic a real client needs to add on top of the SDK examples are the parts most likely to matter the first time this runs under genuine concurrency rather than in an isolated test. Build the retry path in from the start, choose the transaction mode based on the conflict granularity your workload actually needs, and treat the limitations list as a design constraint, not fine print to revisit only after something breaks. Official references Microsoft Learn, "Transactions - Azure Databricks" (learn.microsoft.com/en-us/azure/databricks/transactions/) Microsoft Learn, "Transaction modes - Azure Databricks" (learn.microsoft.com/en-us/azure/databricks/transactions/transaction-modes) Microsoft Learn, "Tutorial: Coordinate transactions across tables - Azure Databricks" (learn.microsoft.com/en-us/azure/databricks/transactions/tutorial) Microsoft Learn, "Catalog commits - Azure Databricks" (learn.microsoft.com/en-us/azure/databricks/tables/features/catalog-commits) Microsoft Learn, "Isolation levels and write conflicts - Azure Databricks" (learn.microsoft.com/en-us/azure/databricks/optimizations/isolation/) Microsoft Learn, "Row-level concurrency - Azure Databricks" (learn.microsoft.com/en-us/azure/databricks/optimizations/isolation/row-level-concurrency)36Views0likes0CommentsCross-Engine ABAC on Azure Databricks: Governing External Spark Reads
Unity Catalog's row filters, column masks, and ABAC policies have always assumed the query comes from inside Azure Databricks. Cross-engine ABAC removes that assumption, and it does it by routing the external engine's read through a Databricks-managed enforcement layer rather than by trusting the external engine to respect the policy on its own. On October 1, 2026, cross-engine attribute-based access controls (ABAC) reached general availability on Azure Databricks. I covered the headline in a shorter post already. This article goes a layer deeper: the exact requirements, the Spark configuration for both Delta and Iceberg, the one concurrency caveat worth testing before you trust this in production, and how to watch what it costs. [INSERT IMAGE HERE using the editor's own Insert Image button, not pasted markup. Upload a screenshot of the Unity Catalog metastore Details tab with the "External data access" toggle visible, or a diagram showing an external Spark client, the Azure Databricks serverless enforcement layer, and the underlying Delta/Iceberg table. Suggested alt text: "External Spark client querying a Unity Catalog managed table through the Azure Databricks serverless ABAC enforcement layer".] 1. Why ABAC used to stop at the Databricks engine door Every previous expansion of Unity Catalog's ABAC surface, metastore-wide policies, identity attributes from Microsoft Entra ID, context attributes that distinguish an agent from a person, explicit DENY, policies on views, shared one assumption: the engine reading the data is Azure Databricks itself. That assumption holds for most workspaces, but it breaks down the moment a genuinely multi-engine estate has an external Apache Spark job, a Flink pipeline, or a BI tool reading the same Unity Catalog managed table directly. Before cross-engine ABAC, the only way to protect that external read was to duplicate the policy logic inside the external engine itself, or to accept that the external path saw unfiltered data. Neither option scales once the policy changes on one side and someone forgets to mirror it on the other. 2. The mechanism: a serverless layer sits between the external engine and the table Cross-engine ABAC does not ask the external engine to evaluate the policy. Instead, when an external engine queries a table with an ABAC policy, a row filter, or a column mask attached, Azure Databricks routes the read through a specialized serverless compute layer. That layer evaluates the policy, filters and masks the data server-side, and only then returns the sanitized result to the external engine. The external engine never sees the unfiltered rows, and it does not need to know the policy exists. This is deliberately narrow in scope today: the only supported external engine is Apache Spark, reading either Delta tables through the Unity REST API or Iceberg tables through the Unity Catalog Iceberg REST endpoint. 3. Turning it on: metastore access, grants, and catalog commits Four things have to be true before an external Spark job can read a single filtered row. Enable external data access on the metastore This is disabled by default, on purpose, to prevent unauthorized external access. A metastore admin has to turn it on explicitly, and the option only appears for sufficiently privileged users: In a workspace attached to the metastore, open Catalog. Click the gear icon at the top of the Catalog pane and select Metastore. On the Details tab, enable External data access. Grant EXTERNAL USE SCHEMA explicitly This privilege is intentionally excluded from ALL PRIVILEGES, and a schema owner does not have it by default, both specifically to prevent accidental data exfiltration through an external path nobody was watching. Only the parent catalog owner can grant it, and it must always be granted explicitly: GRANT EXTERNAL USE SCHEMA ON SCHEMA catalog_name.schema_name TO `email address removed for privacy reasons` The querying principal also needs the ordinary SELECT on the table, USE CATALOG on its parent catalog, and USE SCHEMA on its parent schema, exactly as it would for an internal read. If the workload creates external tables rather than only reading managed ones, it additionally needs CREATE TABLE on the schema and both CREATE EXTERNAL TABLE and EXTERNAL USE LOCATION on the target external location, and EXTERNAL USE LOCATION carries the same explicit-grant-only rule as EXTERNAL USE SCHEMA: GRANT EXTERNAL USE LOCATION ON EXTERNAL LOCATION external_location_name TO `email address removed for privacy reasons` Enable catalog commits on the table Fine-grained enforcement for external reads only works against a managed table with catalog commits enabled, which requires Databricks Runtime 16.4 or above for a brand-new table, or Databricks Runtime 18.0 or above to turn it on for a table that already exists. Creating a new table with catalog commits enabled from the start: CREATE TABLE catalog_name.schema_name.table_name (id INT, name STRING) USING delta TBLPROPERTIES ('delta.feature.catalogManaged' = 'supported'); Upgrading a table that already exists: ALTER TABLE catalog_name.schema_name.table_name SET TBLPROPERTIES ('delta.feature.catalogManaged' = 'supported'); Only after this step can you attach an ABAC policy, a row filter, or a column mask to the table and expect an external Spark read to respect it. 4. Connecting Apache Spark: Delta and Iceberg take different configuration The two paths share the same authorization model but need different Spark packages and session configuration, so keep them separate rather than guessing at a hybrid. Delta tables, via the Unity REST API This path needs Delta-Spark 4.1 or above and Unity Catalog Spark connector 0.4 or above. Using OAuth machine-to-machine authentication, which handles credential and token renewal automatically and is the right choice for a long-running job: "spark.sql.extensions": "io.delta.sql.DeltaSparkSessionExtension", "spark.sql.catalog.spark_catalog": "org.apache.spark.sql.delta.catalog.DeltaCatalog", "spark.sql.catalog.uc_catalog": "io.unitycatalog.spark.UCSingleCatalog", "spark.sql.catalog.uc_catalog.uri": "https://adb-1234567890123456.12.azuredatabricks.net", "spark.sql.catalog.uc_catalog.auth.type": "oauth", "spark.sql.catalog.uc_catalog.auth.oauth.uri": "https://adb-1234567890123456.12.azuredatabricks.net/oidc/v1/token", "spark.sql.catalog.uc_catalog.auth.oauth.clientId": "<oauth-client-id>", "spark.sql.catalog.uc_catalog.auth.oauth.clientSecret": "<oauth-client-secret>", "spark.sql.catalog.uc_catalog.ServerSidePlanning.enabled": "true", "spark.sql.defaultCatalog": "uc_catalog", "spark.jars.packages": "io.delta:delta-spark_2.13:4.1.0,io.delta:delta-iceberg_2.13:4.1.0,io.unitycatalog:unitycatalog-spark_2.13:0.4.0,org.apache.hadoop:hadoop-azure:3.4.2" Setting ServerSidePlanning.enabled to true is not optional decoration, it is the specific switch that routes the read through the enforcement layer instead of letting Spark plan the scan on its own. Miss that one line and the external job will read the table, just without any of the row filters or column masks applied. Iceberg tables, via the Unity Catalog Iceberg REST endpoint This path needs Iceberg-Spark 1.11 or above and Apache Spark 4.0 or above: "spark.sql.extensions": "org.apache.iceberg.spark.extensions.IcebergSparkSessionExtensions", "spark.sql.catalog.uc_catalog": "org.apache.iceberg.spark.SparkCatalog", "spark.sql.catalog.uc_catalog.type": "rest", "spark.sql.catalog.uc_catalog.uri": "https://adb-1234567890123456.12.azuredatabricks.net/api/2.1/unity-catalog/iceberg-rest/", "spark.sql.catalog.uc_catalog.credential": "<oauth-client-id>:<oauth-client-secret>", "spark.sql.catalog.uc_catalog.oauth2-server-uri": "https://adb-1234567890123456.12.azuredatabricks.net/oidc/v1/token", "spark.sql.catalog.uc_catalog.warehouse": "uc_catalog", "spark.sql.catalog.uc_catalog.cache-enabled": "false", "spark.sql.defaultCatalog": "uc_catalog" Once either configuration is in place, the query itself is ordinary Spark SQL, the enforcement is invisible from the client side: SELECT * FROM uc_catalog.schema_name.table_name; 5. What actually gets enforced, and where the hard edges are ABAC policies, standalone row filters, and column masks are all enforced on the external read, dynamically, the same way they would be for a query running inside Azure Databricks. That is the entire value proposition. But the current scope has real edges, not just minor rough patches: Only reads are supported from an external engine under fine-grained access control. To write, the writing principal must be exempted from the ABAC policy entirely, there is no write-path enforcement yet. Dynamic views are not supported. Projecting a VARIANT column is not supported. Filtering on a BINARY column is not supported. A column-masking function whose return type differs from the original column's type is not supported. Large aggregations can see real performance degradation, since every row still passes through the serverless enforcement layer before it reaches the external engine. And one warning from the documentation is worth repeating verbatim rather than paraphrasing away its force: concurrent writes during query planning can cause the same table to be read from different table snapshots within a single self-join or multi-scan query, which can produce incorrect results. If your external workload runs a self-join or anything that scans the same table more than once inside one query, and the table sees concurrent writes, test that specific pattern under write load before trusting its output in production. This is not a theoretical edge case, it is a named, documented failure mode. 6. Watching what it costs The enforcement layer is serverless compute, and Azure Databricks charges for it under its own billing line, separate from ordinary warehouse or job compute. Anyone with access to the billing system table can see exactly how much a given user's external reads are costing, broken down by SKU and by the identity that ran the query: SELECT usage_date, sku_name, identity_metadata.run_as, SUM(usage_quantity) AS dbus_consumed_by_cross_engine_abac FROM system.billing.usage WHERE usage_date BETWEEN '2026-06-01' AND '2026-07-01' AND billing_origin_product = 'EXTERNAL_COMPATIBILITY' GROUP BY 1, 2, 3 ORDER BY 1; If an external Spark job reading a heavily policy-protected table runs more often than its consumers actually need fresh data, that EXTERNAL_COMPATIBILITY line is where the cost of that habit shows up first, not in the external engine's own compute bill. 7. My perspective on this Every ABAC expansion I have covered before this one assumed the reader was inside the platform. This is the first one that assumes the opposite, and the caution in the scope reflects that: read-only, one external engine, a documented snapshot-consistency warning stated plainly rather than buried. That restraint is the right call for a first general-availability release of a capability whose entire failure mode is "the external engine saw data it should not have seen." The detail I would not skip past is ServerSidePlanning.enabled. It is one line in a long configuration block, easy to leave out by copying an older Delta-Spark config that predates this feature, and leaving it out does not produce an error, it produces an unfiltered read that looks identical to a correctly filtered one until someone notices the wrong person saw the wrong row. Treat that flag as a required field, not an optional tuning parameter, and verify it is present in code review for any external Spark job that touches a governed table. I would also budget real test time for the concurrency warning before this goes anywhere near a production pipeline that both writes to and externally reads from the same table. A silent correctness bug that only appears under concurrent writes during self-joins is exactly the kind of failure that passes every test run in a quiet environment and then shows up the first time two jobs actually overlap in production. Conclusion Cross-engine ABAC does not ask external Spark to respect your governance policy, it makes respecting that policy the external engine's only option, by interposing a serverless enforcement layer it cannot see around. The setup cost is real: a metastore-level toggle only an admin can flip, an explicit grant that intentionally does not come bundled with broader privileges, and a table property that most existing managed tables do not have yet. For a genuinely multi-engine estate, that cost is still far lower than the alternative, which was duplicating policy logic in every external engine and hoping nobody let the two copies drift apart. Official references Microsoft Learn, "Cross-engine attribute-based access controls (ABAC) - Azure Databricks" (learn.microsoft.com/en-us/azure/databricks/external-access/cross-engine-abac) Microsoft Learn, "Access Databricks tables from Delta clients - Azure Databricks" (learn.microsoft.com/en-us/azure/databricks/external-access/unity-rest) Microsoft Learn, "Enable external data access to Unity Catalog - Azure Databricks" (learn.microsoft.com/en-us/azure/databricks/external-access/admin) Microsoft Learn, "Catalog commits - Azure Databricks" (learn.microsoft.com/en-us/azure/databricks/tables/features/catalog-commits) Microsoft Learn, "Row filters and column masks - Azure Databricks" (learn.microsoft.com/en-us/azure/databricks/data-governance/unity-catalog/filters-and-masks/) Microsoft Learn, "Authorize service principal access to Azure Databricks with OAuth" (learn.microsoft.com/en-us/azure/databricks/dev-tools/auth/oauth-m2m)114Views0likes0CommentsAzure Databricks Cost Governance: Budgets, Tags, and Alerts Before the Invoice Arrives
Cost visibility on Azure Databricks does not have to wait for the monthly invoice, and for Azure customers specifically, the attribution trail can run straight into Azure Cost Management, not just Databricks system tables. On October 7, 2026, Databricks published a practical guide on setting budgets and alerts for cloud data warehouse costs. The original post is written in general, cross-cloud terms. This article walks through the same problem from the Azure Databricks side specifically, using the account console, the REST API, and the system tables as they actually behave on Azure today, including two capabilities that go further than what the original post describes: per-user Unity Gateway budgets with usage blocking, and serverless usage policies whose tags propagate directly into Azure's own cost analysis tools. [INSERT IMAGE HERE using the editor's own Insert Image button, not pasted markup. Upload a screenshot of the Azure Databricks account console Budgets tab (Usage > Budgets), or if the editor accepts an external URL, use a relevant Microsoft Learn budgets screenshot. Suggested alt text: "Azure Databricks account console showing the Budgets tab with monthly threshold and burn-rate chart".] 1. Why the bill always arrives as a surprise The pattern repeats across data teams on any cloud: usage is not attributed to a team or a query, no team owns a budget number, the overspend only surfaces a billing cycle later, and manual spreadsheet review does not scale past a handful of warehouses. None of this is a tooling gap specific to Databricks, it is what happens when cost tracking is bolted on after the fact instead of built into how compute gets created in the first place. Azure Databricks addresses this with four layers that build on each other: tag-based attribution, the system.billing.usage table as the source of truth, budgets scoped to workspaces or tags in the account console, and alerts that run on a schedule instead of waiting for a human to check a dashboard. 2. Attribution: tags, and the Azure-native alternative to tagging by hand The baseline mechanism is the same one most clouds use: key-value tags on a SQL warehouse, set at creation or edit time, that later show up in the custom_tags column of the billing system table. Tagging a warehouse through the REST API curl -X POST "https://${DATABRICKS_HOST}/api/2.0/sql/warehouses" \ -H "Authorization: Bearer ${DATABRICKS_TOKEN}" \ -H "Content-Type: application/json" \ -d '{ "name": "finance-analytics", "cluster_size": "Small", "warehouse_type": "PRO", "tags": { "custom_tags": [ { "key": "team", "value": "finance" }, { "key": "cost-center", "value": "1234" } ] } }' Two details matter when you actually run this. The warehouse tagging limit is under 45 tags per warehouse, and if a custom tag key collides with one of Databricks' own default tags (Vendor, ClusterId, SqlEndpointId, Creator), the custom one gets an x_ prefix during propagation rather than overwriting the default. Plan tag key names with that collision rule in mind. Query tags: tagging at the session or statement level (Public Preview) Warehouse tags attribute an entire warehouse to a team, but a shared warehouse serving multiple teams needs finer granularity than that. Query tags (Public Preview) solve this by letting you tag individual sessions or individual statements, independent of which warehouse they run on. From the SQL editor, a notebook, or a dashboard, set tags for the rest of the session with the SET QUERY_TAGS statement: -- Tag every subsequent query in this session SET QUERY_TAGS['team'] = 'marketing', QUERY_TAGS['cost_center'] = '701'; -- Inspect what's currently set SET QUERY_TAGS; -- Clear a tag when the session changes purpose SET QUERY_TAGS['cost_center'] = UNSET; Session-level tags apply to every statement that follows until changed. Statement-level tags are a separate, narrower mechanism: pass a query_tags array in the request body of the Statement Execution API, and only that one statement carries the tag, with the session reverting to its own tags afterward: curl -X POST "https://${DATABRICKS_HOST}/api/2.0/sql/statements" \ -H "Authorization: Bearer ${DATABRICKS_TOKEN}" \ -H "Content-Type: application/json" \ -d '{ "warehouse_id": "abc123", "statement": "SELECT * FROM samples.nyctaxi.trips LIMIT 10", "query_tags": [ { "key": "team", "value": "engineering" }, { "key": "env", "value": "prod" } ] }' Tags land in the query_tags column of system.query.history, which needs its own access grant from an account admin if you do not already have it. Query it directly to see spend by query rather than by whole warehouse: SELECT statement_id, query_tags, executed_by, start_time FROM system.query.history WHERE MAP_CONTAINS_KEY(query_tags, 'team') AND query_tags['team'] = 'marketing' ORDER BY start_time DESC LIMIT 100 The limits are tight enough to plan around: 20 user-specified tags per query, 10 KB of tags per session, 128 characters per key or value, and tag keys cannot contain commas, colons, hyphens, slashes, equals signs, or periods. A key starting with @@ is reserved, that is the prefix dbt and Power BI use for their own automatically applied tags (@@dbt_model_name, @@powerbi_report_id, and similar). Set a tag using a session configuration parameter instead of SQL and an invalid key gets silently dropped with a tag_invalid: true sentinel; set it through SET QUERY_TAGS and an invalid key fails the statement outright at execution time, which is the behavior worth relying on if you want bad tags to be loud rather than quiet. The Azure-specific upgrade: serverless usage policies Tagging every warehouse by hand does not scale, and nothing stops a team from forgetting it on the one warehouse that ends up costing the most. For serverless compute specifically, Azure Databricks has a more structural answer: serverless usage policies (Public Preview). A policy bundles a set of tags and gets assigned to users; any serverless notebook, job, pipeline, serving endpoint, or app that user creates inherits the policy's tags automatically, with no manual tagging step per resource. The detail that matters most for an Azure-focused reader: serverless usage policy tags propagate directly into the billing records emitted to Azure Cost Analysis, not only into Databricks' own system.billing.usage table. That means the same tag you use to scope a Databricks budget is also what your FinOps team sees inside the Azure portal's own cost views, without a separate mapping step. Known limitations worth planning around: existing notebooks, jobs, and pipelines do not retroactively pick up a policy, you have to assign it manually to each existing asset; classic (non-serverless) compute is not covered at all; and a pipeline triggered by a job does not inherit the job's policy, the pipeline needs its own. 3. The source of truth: system.billing.usage Every budget, every alert, and every dashboard ultimately reads from one Unity Catalog system table: system.billing.usage. Records typically land within 12 hours. The schema includes, among other columns, custom_tags (a map, populated by both manual warehouse tags and serverless usage policy tags), usage_metadata.warehouse_id, usage_quantity (in the unit given by usage_unit, typically DBU), and record_type, which can be ORIGINAL, RETRACTION, or RESTATEMENT when Databricks issues a billing correction. Note that query tags from the previous section live in system.query.history, not here, custom_tags on this table only reflects warehouse-level and policy-level tags. The two tables are separate for this reason, use system.query.history for query-level cost investigation and this table for warehouse and account-level aggregation. That last detail is not cosmetic. A naive SUM(usage_quantity) without accounting for retractions can overcount. The pattern that handles it correctly: SELECT usage_metadata.job_id, usage_start_time, usage_end_time, SUM(usage_quantity) AS usage_quantity FROM system.billing.usage GROUP BY ALL HAVING usage_quantity != 0 Aggregating before filtering lets the retraction record cancel out the original it corrects, so a corrected job's usage does not get double-counted. Applied to the attribution problem directly, two queries worth keeping in a cost dashboard: -- SQL warehouse spend by team, last 30 days SELECT custom_tags['team'] AS team, usage_metadata.warehouse_id, SUM(usage_quantity) AS dbus_consumed FROM system.billing.usage WHERE billing_origin_product = 'SQL' AND usage_date >= current_date() - INTERVAL 30 DAYS GROUP BY ALL ORDER BY dbus_consumed DESC -- Unattributed SQL usage: the attribution gap, should trend to zero SELECT usage_date, SUM(usage_quantity) AS unattributed_dbus FROM system.billing.usage WHERE billing_origin_product = 'SQL' AND (custom_tags['team'] IS NULL OR custom_tags['team'] = '') GROUP BY usage_date ORDER BY usage_date DESC For a dollar figure rather than a DBU count, join against the system.billing.list_prices system table on sku_name and the price's effective date range. I am not reproducing that join here because I have not verified its exact column names against the current schema, and getting a pricing join subtly wrong is worse than not showing it. Check the list prices system table reference on Microsoft Learn (learn.microsoft.com/en-us/azure/databricks/admin/system-tables/pricing) before writing that query yourself. 4. Budgets in the account console: more than a threshold and an email Budgets live in the Azure Databricks account console (accounts.azuredatabricks.net), under Usage > Budgets. A budget can scope to specific workspaces, to custom tags, or to both, and if you leave both empty it tracks your entire account. What the Azure documentation describes goes further than a single alert value: Up to four monthly thresholds per budget, each with its own email recipient list. Up to 1,000 budgets per account. Budgets scoped to Unity Gateway (the routing layer in front of Pay-Per-Token foundation model inference, batch ai_query, and external model provider usage) support a per-user spend threshold, on top of the shared thresholds. Cross a per-user threshold and that specific user's requests can optionally be blocked, with the option to grant named users or groups a higher override limit. Budget visibility and editing is governed by a dedicated permission role, not just account admin status, so a team lead can see their own budget without account-wide access. The important caveat, stated plainly in the documentation: budgets are a monitoring mechanism, not a hard spending cap, except specifically for Unity Gateway and Genie budgets, where the optional "Block usage" setting does enforce a stop. Even there, enforcement is approximate, based on a near-real-time cost estimate, so a user can be blocked slightly before or after the literal threshold. For standard SQL and compute budgets, nothing stops the spend, the budget's job is to get a human's attention fast. A layered pattern, adapted for Azure, that tends to hold up in practice: a BI Serving + Production budget at $8,000/month scoped to UseCase:BIServing and Env:Prod, alerting the platform team; an Analytics Ad-Hoc budget at $3,000/month scoped to UseCase:AdHoc, alerting the analytics manager; a Marketing Analytics budget at $2,500/month scoped to Team:Marketing, alerting the marketing data lead; and an account-wide safety net at $25,000/month with no tag scope, alerting the CTO and FinOps. Team-level budgets for accountability, plus one account-wide budget as the net that catches whatever slips past every tag filter. The values above are illustrative, size them against your own baseline. 5. Alerts that run before the threshold, not after Databricks SQL alerts run a query on a schedule and evaluate a condition against the result, independent of whether anyone opens a dashboard. On Azure Databricks, the current alert engine resolves to one of three states: OK, TRIGGERED, or ERROR, a simplification from the legacy alert system's extra UNKNOWN state. A daily threshold alert, scheduled once a day, built on the team-attribution query above: SELECT custom_tags['team'] AS team, SUM(usage_quantity) AS dbus_today FROM system.billing.usage WHERE billing_origin_product = 'SQL' AND usage_date = current_date() GROUP BY ALL HAVING dbus_today > 500 -- adjust to your own per-team daily baseline A threshold alert only catches a problem on the day it happens. A pacing alert catches it earlier, by projecting month-end spend from the days elapsed so far: WITH month_to_date AS ( SELECT SUM(usage_quantity) AS mtd_dbus, DAY(current_date()) AS days_elapsed, DAY(LAST_DAY(current_date())) AS days_in_month FROM system.billing.usage WHERE billing_origin_product = 'SQL' AND usage_date >= DATE_TRUNC('MONTH', current_date()) ) SELECT mtd_dbus, mtd_dbus / days_elapsed * days_in_month AS projected_month_end_dbus FROM month_to_date HAVING projected_month_end_dbus > 15000 -- adjust to your monthly DBU budget Schedule the pacing alert every four hours and route it to Slack or email through the alert's notification settings, the same pattern the original Databricks post recommends. Running it more often than that mostly adds noise, since system.billing.usage itself only refreshes every few hours. One cost that neither alert catches on its own: materialized view refreshes bill as serverless pipeline usage, under billing_origin_product = 'DLT', not as warehouse usage. If your team only watches SQL spend, a materialized view refreshed far more often than its source data actually changes can run invisibly. Align refresh frequency to real data freshness, and include DLT in your cost queries, not only SQL. 6. Where this still needs a human None of the above replaces judgment on the two levers that move cost the most: warehouse type and warehouse size. Azure Databricks documentation still points to SQL Serverless as the default starting point for most workloads, since it starts in seconds, scales to zero between queries, and bills only for execution time, and to predictive optimization (learn.microsoft.com/en-us/azure/databricks/optimizations/predictive-optimization), enabled by default on accounts created after November 11, 2024, to keep OPTIMIZE, VACUUM, and clustering key maintenance running automatically on managed Unity Catalog tables, instead of a scheduled job someone has to remember to run. Auto-stop is worth checking explicitly rather than trusting the default: Pro and Classic warehouses default to 45 minutes of idle time before stopping, serverless defaults to 10 minutes, and serverless can be brought down to as low as 1 minute through the API, below what the UI exposes. For a warehouse that serves a handful of scheduled queries a day, 45 idle minutes can be the single biggest line item. 7. My perspective on this The feature set here is more capable on Azure specifically than the general cross-cloud framing suggests, and the detail that stands out to me is the Azure Cost Analysis propagation for serverless usage policy tags. That is not a Databricks convenience feature, it closes the exact gap that usually breaks cost governance in a real organization: the Databricks admin owns one view of spend, the cloud FinOps team owns another, and reconciling the two by hand is where attribution efforts actually die. If the same tag shows up in both without a manual export step, that reconciliation work goes away. I would start with serverless usage policies before hand-tagging every warehouse, specifically because the policy approach survives a new team member forgetting to tag something, while manual tagging does not. The known limitation that existing assets do not retroactively inherit a new policy is real friction, budget time for a one-time pass over your current notebooks, jobs, and pipelines when you adopt this, it will not happen automatically. And treat every budget as a monitoring signal, not a spending cap, with the explicit exception of Unity Gateway and Genie budgets where blocking is actually available. Assuming the wrong one of those two behaviors for a given budget is how a team ends up either silently overspending or unexpectedly blocked mid-production. Conclusion Cost governance on Azure Databricks is not a single feature, it is tags feeding a system table, a system table feeding budgets and alerts, and budgets feeding back into how the next warehouse gets created. The Azure-specific pieces, Unity Gateway per-user budgets with blocking and serverless usage policy tags flowing into Azure Cost Analysis, are worth adopting even if you came from the general cross-cloud version of this guide expecting less. Official references Databricks Blog, "Set Budgets and Alerts for Cloud Data Warehouse Costs" (www.databricks.com/blog/set-budgets-and-alerts-cloud-data-warehouse-costs) Microsoft Learn, "Create and monitor budgets - Azure Databricks" (learn.microsoft.com/en-us/azure/databricks/admin/account-settings/budgets) Microsoft Learn, "Attribute usage with serverless usage policies - Azure Databricks" (learn.microsoft.com/en-us/azure/databricks/admin/usage/budget-policies) Microsoft Learn, "Billable usage system table reference - Azure Databricks" (learn.microsoft.com/en-us/azure/databricks/admin/system-tables/billing) Microsoft Learn, "Databricks SQL alerts - Azure Databricks" (learn.microsoft.com/en-us/azure/databricks/sql/user/alerts/) Microsoft Learn, "Use tags to attribute and track usage - Azure Databricks" (learn.microsoft.com/en-us/azure/databricks/admin/account-settings/usage-detail-tags) Microsoft Learn, "Query tags - Azure Databricks" (learn.microsoft.com/en-us/azure/databricks/sql/user/queries/query-tags) Microsoft Learn, "Governance Hub - Azure Databricks" (learn.microsoft.com/en-us/azure/databricks/admin/governance-hub/)134Views0likes0CommentsLTAP Direct Writes: Loading Terabytes into Lakebase Postgres Without Touching Your Live Application
A new beta capability that removes the classic bottleneck of bulk-loading data into a live Postgres database on Azure Databricks. On October 8, 2026, Databricks published details on LTAP Direct Writes, a Beta capability of the LTAP (Lake Transactional/Analytical Processing) architecture that accelerates large data loads into Lakebase Postgres. Until now, bulk-loading billions of rows into a live transactional Postgres database meant competing directly with the application for the same CPU and memory. Every write, regardless of its origin, has to pass through a single primary instance. One Databricks customer loading close to 1 billion rows per day through Synced Tables needed more than 8 hours per load, and had to overprovision OLTP compute just to absorb that peak without degrading the application. LTAP Direct Writes attacks this problem by moving the heavy construction work out of the primary instance entirely. Databricks reports loading 1 TB of data in under 5 minutes with this approach, up to 147 times faster, without consuming resources from the live application. [INSERT IMAGE HERE using the editor's own Insert Image button, not pasted markup. Upload the file, or if the editor accepts an external URL, use: https://www.databricks.com/sites/default/files/blog_images/load-tbs-in-minutes-into-postgres-blog-img-6.png . Suggested alt text: "LTAP architecture diagram showing Lakebase compute streaming the WAL to a storage layer that transcodes data into columnar Parquet, readable through Delta and Iceberg".] 1. Why a single Postgres primary cannot scale bulk loads linearly In any standard Postgres deployment, every write, no matter where it originates, passes through the primary instance. This is not a configuration limitation, it is the engine's transactional guarantee: the primary has to coordinate commit order, maintain consistency, and manage the write-ahead log as a single sequence. Throwing more parallelism at the client side does not help much when the bottleneck sits in the one process that can actually write. This is why bulk loads of billions of rows have historically competed directly with the production application for the same CPU and memory on the primary, forcing a choice between load throughput and application latency. 2. What LTAP Direct Writes changes LTAP separates compute from storage in Lakebase. As data is materialized to object storage, it is transcoded from Postgres's row-oriented representation into columnar Parquet, readable through Delta or Iceberg. This creates a single logical copy of the data, served by two specialized engines: Postgres for transactional workloads, an analytical engine for OLAP, with no external CDC pipeline to keep in sync. Synced Tables, the capability that serves lakehouse data back into Lakebase, is one concrete implementation of this architecture, and it is exactly where LTAP Direct Writes comes in to accelerate the initial load. The mechanism moves data construction out of the primary and runs it in parallel, outside of it: Parallel page building: Each Spark executor runs an isolated, sandboxed Postgres instance in binary-upgrade mode, the same mechanism `pg_upgrade` uses internally. Each sandbox reuses the destination's catalog OIDs, and the driver assigns non-overlapping OID ranges so concurrent objects cannot collide. Frozen binary COPY: Inside each sandbox, a binary `COPY` with `FREEZE` builds that executor's slice of the heap. Frozen tuples are treated as already committed, so the sandbox does not need to maintain transaction history. Per-page checksums: Each worker computes a checksum for its own constructed page. Lakebase's pageserver validates this on ingest, so a corrupted page never becomes authoritative. Index building without downloading the full heap: Each worker exports key columns and tuple IDs to object storage. A custom table access method feeds these into Postgres's standard B-tree builder, shifting each tuple pointer by the cumulative size of earlier slices. The full heap never has to be downloaded back to build the index. Atomic handoff: The Spark driver writes a manifest and calls a single SQL function. The primary records the import as a compact WAL entry, carrying only the import's description rather than the full data volume. The pageserver claims the files, warms them on local SSD, and the primary atomically swaps the staged data into the user-visible table. Until that commit, the imported table stays isolated. The team behind this is explicit that the technique uses a Postgres extension and a custom table access method, without modifying Postgres core. 3. What this unlocks for Azure Databricks users specifically For teams already running Lakebase on Azure Databricks, this closes a gap that used to force an uncomfortable choice: either accept a multi-hour load window with degraded application performance, or keep bulk analytical datasets out of Lakebase entirely and pay the cost of a separate reverse-ETL pipeline just to avoid that degradation. With Direct Writes, feeding a Lakebase-backed application with a large batch of enriched lakehouse data (a nightly scoring table, a freshly computed feature set, a reference dataset rebuilt from scratch) no longer means scheduling that load for a maintenance window. It becomes a background operation that the live application does not feel. 4. Hands-on: creating a Synced Table with Direct Writes The capability that benefits from Direct Writes today is the creation of a Synced Table. Direct Writes itself is currently a checkbox in the Create synced table dialog in the UI, not yet an explicit field documented in the CLI or SDK JSON spec, so the examples below show the general synced table creation flow that Direct Writes accelerates. Creating the synced table with the Databricks CLI databricks postgres create-synced-table main.sales.orders_sync \ --json '{ "spec": { "source_table_full_name": "main.sales.orders", "branch": "projects/my-project/branches/production", "primary_key_columns": ["order_id"], "scheduling_policy": "SNAPSHOT", "postgres_database": "mydb", "create_database_objects_if_missing": true } }' Creating the synced table with the Python SDK from databricks.sdk import WorkspaceClient from databricks.sdk.service.postgres import ( SyncedTable, SyncedTableSyncedTableSpec, SyncedTableSyncedTableSpecSyncedTableSchedulingPolicy, ) w = WorkspaceClient() synced_table = w.postgres.create_synced_table( synced_table=SyncedTable(spec=SyncedTableSyncedTableSpec( source_table_full_name="main.sales.orders", branch="projects/my-project/branches/production", primary_key_columns=["order_id"], scheduling_policy=SyncedTableSyncedTableSpecSyncedTableSchedulingPolicy.SNAPSHOT, postgres_database="mydb", create_database_objects_if_missing=True, )), synced_table_id="main.sales.orders_sync", ).wait() print(f"Synced table created: {synced_table.name}") Querying the loaded data directly from Postgres Once the load completes, applications query the result with a standard Postgres driver, no different from any other table: SELECT * FROM sales.orders_sync WHERE order_id = 48213; 5. Checking load status programmatically For a load that might take anywhere from seconds to minutes depending on volume, polling status through the SDK is more practical than watching the UI: from databricks.sdk import WorkspaceClient w = WorkspaceClient() table = w.postgres.get_synced_table("synced_tables/main.sales.orders_sync") print(f"State: {table.status.detailed_state}") print(f"Last sync: {table.status.last_sync_time}") print(f"Message: {table.status.message}") This is useful to wire into a Lakeflow Job as a dependency gate: downstream tasks can wait for `detailed_state` to report a completed sync before reading from the table, instead of assuming a fixed load duration. 6. What Direct Writes accelerates, and what it does not yet LTAP Direct Writes accelerates the initial load in every sync mode. For subsequent syncs, the acceleration applies specifically to Snapshot mode, because that mode performs a full refresh on every cycle. In Triggered and Continuous modes, later updates are already incremental through Change Data Feed, not bulk loads, so Direct Writes only matters for their initial load. The team behind the feature is upfront about its current scope: The 147x benchmark measures heap-building time only. Index building is not parallelized the same way yet, and the team describes this as active, ongoing work. LTAP Direct Writes is Beta, and requires a Lakebase project running Postgres 16, 17, or 18. It can only be selected when a synced table is created, not added to an existing one. To use it with an existing synced table, you delete it and create a new one. A table with many secondary indexes will likely not see the same proportional gain as the simple table used in the published benchmark, since index construction is the part still being parallelized. 7. My perspective on this change The performance number is the headline, but the architectural detail that matters more is where the heavy work moved to. The load no longer competes with your live application inside the primary instance, it becomes isolated Spark work that happens alongside it. That is the problem the cited customer actually had: not "slow load" in isolation, but "slow load competing for resources with production." I would test this first on a table without complex secondary indexes before assuming the 147x gain repeats identically on any schema, given the team's own disclosure that index building is still catching up to the heap-building speedup. For Azure Databricks teams already committed to Lakebase as their operational Postgres, this is one more argument for keeping large, bulk-refreshed datasets inside Lakebase instead of routing them through a separate reverse-ETL tool just to avoid the old load-time penalty. Conclusion LTAP Direct Writes is not an isolated feature, it is separating compute from storage applied all the way down into the bulk-load process itself. For teams already using Synced Tables and feeling the weight of large loads on the primary, it is worth testing the Beta before assuming overprovisioning the OLTP side is the only way out. Official references Databricks Blog, "Load terabytes of data in minutes into Lakebase Postgres" Microsoft Learn, "LTAP architecture - Azure Databricks" Microsoft Learn, "Serve lakehouse data with synced tables" Microsoft Learn, "Lakebase architecture - Azure Databricks" Databricks Blog, "Lakebase LTAP: rethinking database storage"138Views0likes0CommentsMultiple Triggers in Azure Databricks Lakeflow Jobs: Simplifying Data Orchestration
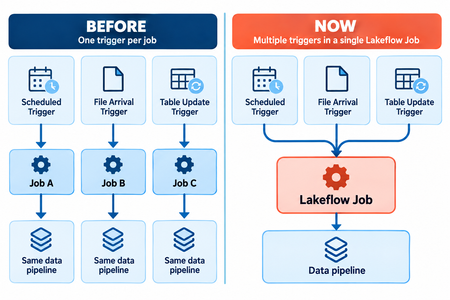
A new feature that simplifies event-driven pipeline execution in Azure Databricks. On October 5, 2026, Databricks announced support for Multiple Triggers in Lakeflow Jobs, currently available in Beta. Until now, a Job could have only one configured trigger. This created an interesting limitation in data engineering projects: what happens when the same pipeline needs to run under different conditions? Imagine a data ingestion pipeline that needs to run when a new file arrives in storage, when a Delta table is updated, or every day at a specific time, regardless of those events. Previously, a common solution was to create separate Jobs, each with its own trigger, while reusing or duplicating the processing logic. Another option was to create intermediate Jobs responsible for calling the main pipeline. Both approaches work, but they introduce additional components and increase maintenance effort. With Multiple Triggers, we can now configure different execution conditions directly within the same Job. 1. How did it work before? Let's consider a pipeline responsible for processing sales data. This pipeline has three requirements: - Process new files arriving in a Unity Catalog Volume. - Reprocess data whenever a source Delta table is updated. - Run every day at 8 AM to ensure scheduled processing. Before Multiple Triggers, each Job supported only one trigger configuration. One possible approach was to create three separate Jobs, each responsible for a specific trigger type, pointing to the same processing logic. Although notebooks and tasks could be shared across these Jobs, we still needed to manage separate Job definitions, permissions, parameters, and execution settings. In enterprise environments, this complexity can grow as the number of pipelines and dependencies increases. 2. What changed with Multiple Triggers? Azure Databricks now allows us to configure up to five triggers within a single Lakeflow Job, including combinations of different trigger types. For example: Scheduled Trigger: Runs the Job at a predefined time. File Arrival Trigger: Runs when new files are detected. Table Update Trigger: Runs when specific tables are updated. Model Update Trigger: Runs based on updates to models registered in Unity Catalog. The execution logic is straightforward: when any active trigger meets its condition, it can initiate a Job run. This means we no longer need to maintain separate Jobs just to support multiple execution conditions. Another useful feature is the ability to pause or resume each trigger independently. For example, during maintenance, we can temporarily pause the Table Update Trigger while keeping the daily schedule active. 3. Practical example: Configuring Multiple Triggers Let's create a Job responsible for processing sales data. In this example, we will configure three execution conditions: Trigger 1: New files arriving in a Unity Catalog Volume. Trigger 2: Updates to the bronze.sales.orders table. Trigger 3: Daily execution at 8 AM, using the São Paulo time zone. We can configure these triggers through the Azure Databricks interface by opening the Job and adding triggers under Schedules & Triggers. We can also use the Jobs API to automate this configuration. Example using the Jobs API The following JSON illustrates a Job configuration using the triggers array. { "name": "sales_processing_job", "max_concurrent_runs": 1, "tasks": [ { "task_key": "process_sales", "notebook_task": { "notebook_path": "/Shared/pipelines/process_sales" }, "existing_cluster_id": "<CLUSTER_ID>" } ], "triggers": [ { "file_arrival": { "url": "/Volumes/bronze/sales/landing" }, "pause_status": "UNPAUSED" }, { "table_update": { "table_names": [ "bronze.sales.orders" ], "condition": "ANY_UPDATED" }, "pause_status": "UNPAUSED" }, { "schedule": { "quartz_cron_expression": "0 0 8 * * ?", "timezone_id": "America/Sao_Paulo" }, "pause_status": "UNPAUSED" } ] } In this example, we have a single Job with three independent execution conditions. The triggers field contains an array of trigger configurations, allowing multiple triggers to be defined without relying on the legacy top-level schedule, trigger, or continuous fields. The example uses an existing cluster for simplicity. In production environments, the compute configuration should be selected according to workload requirements and organizational policies. Creating the Job with Python We can submit the configuration using Python and the requests library. import os import json import requests workspace_url = os.environ["DATABRICKS_HOST"].rstrip("/") token = os.environ["DATABRICKS_TOKEN"] with open("sales_job.json", encoding="utf-8") as file: job_settings = json.load(file) response = requests.post( f"{workspace_url}/api/2.1/jobs/create", headers={ "Authorization": f"Bearer {token}", "Content-Type": "application/json" }, json=job_settings, timeout=30 ) response.raise_for_status() print("Job created:", response.json()["job_id"]) The sales_job.json file contains the JSON configuration shown earlier. For enterprise implementations, I recommend using service principals and secure authentication mechanisms instead of embedding credentials directly in the code. 4. What happens when two triggers fire at the same time? This is an important architectural consideration. Imagine a new file arriving at exactly 8 AM, when the scheduled execution is also expected to run. Both triggers may request an execution of the same Job. However, this does not necessarily mean that two runs will execute simultaneously. The behavior depends on the Job's concurrency settings. By default, a Job allows only one active run at a time. Therefore, we need to consider concurrency limits and how additional runs are handled. Another important consideration is idempotency. In simple terms, running the same pipeline multiple times against the same data should not produce duplicate records or inconsistent results. In Azure Databricks, we can use Delta Lake features and MERGE operations to implement idempotent processing strategies. Multiple Triggers improves execution flexibility, but it does not replace proper pipeline design. 5. Monitoring Jobs using System Tables One capability I find particularly useful is the possibility of monitoring trigger configurations through Databricks System Tables. The system.lakeflow.jobs table provides information about Jobs, including the trigger_type and triggers fields. When a Job has multiple triggers, the trigger_type field can contain the value MULTIPLE. We can identify these Jobs using SQL: WITH current_jobs AS ( SELECT workspace_id, job_id, name, trigger_type, triggers, ROW_NUMBER() OVER ( PARTITION BY workspace_id, job_id ORDER BY change_time DESC ) AS rn FROM system.lakeflow.jobs ) We can also expand the triggers array to inspect the individual configurations associated with each Job. WITH current_jobs AS ( SELECT workspace_id, job_id, name, triggers, ROW_NUMBER() OVER ( PARTITION BY workspace_id, job_id ORDER BY change_time DESC ) AS rn FROM system.lakeflow.jobs ) SELECT workspace_id, job_id, name, trigger FROM current_jobs LATERAL VIEW EXPLODE(triggers) AS trigger WHERE rn = 1; This approach can support governance and observability dashboards, especially in environments with hundreds or thousands of Jobs. 6. Limitations and considerations Since Multiple Triggers is currently in Beta, there are some important limitations and requirements: Each Job can have up to five triggers. The Multiple Triggers feature must be enabled in the workspace Preview settings. Each trigger can be paused or resumed independently. Continuous triggers cannot be combined with other trigger types. When updating the triggers array through the Jobs API, the entire existing trigger list is replaced. The last point is particularly important when working with infrastructure automation or CI/CD pipelines. When updating trigger configurations through the API, we need to make sure that all triggers we want to preserve are included in the new definition. 7. My perspective on this change Based on my experience working with data architecture and data engineering projects, one recurring challenge is avoiding unnecessary complexity in orchestration. The problem is not always related to data processing itself. Sometimes, it comes from the number of components we need to maintain just to execute relatively simple logic. Multiple Triggers does not change how we build tasks within a Job, but it improves how we define when those tasks should run. I see significant value in this feature for incremental ingestion, event-driven processing, and pipelines that need to combine data updates with scheduled execution. I also appreciate the ability to manage triggers independently, which can make maintenance and operational control easier. It may seem like a relatively small configuration change, but it can lead to meaningful architectural simplification in certain scenarios. Conclusion With Multiple Triggers support, Azure Databricks Lakeflow Jobs provides greater flexibility for configuring different execution conditions within a single Job. This feature reduces the need for auxiliary Jobs or duplicated Job definitions, making orchestration architectures simpler and easier to maintain. We still need to consider concurrency, idempotency, governance, and observability, but we now have another option for building event-driven pipelines without introducing unnecessary components. For anyone working with Azure Databricks, this feature is worth exploring to identify opportunities to simplify existing orchestration workflows. Official references Databricks: Automate jobs with schedules and triggers Databricks Release Notes, October 2026 Databricks Jobs API Databricks System Tables: Jobs175Views0likes0CommentsAzure Databricks Cost and Workload Assessment: a Local Web UI
Introduction To review an Azure Databricks environment, you need to know what it costs, how its compute is used, and which jobs need attention. That information is spread across Azure billing and Databricks. The Assessment & Optimization Workbench is a local web application that brings these details together. Select your workspaces and dates, check access, and run an assessment. You can then explore the results in your browser and download a report to discuss with your team. The walkthrough below shows each step. 1. What you can assess The assessment covers costs, workload behavior, and selected configuration checks: Area What you can inspect Cost Actual and Amortized costs, top drivers, attribution gaps, and commitment scenarios with eligible hourly inputs. Efficiency CPU/memory samples, idle observations, sizing candidates, query duration, and queueing. Job health Failures, retries, failure notifications, and network observations. Inventory and posture Workspace assets, IP access list settings, and Unity Catalog metastore assignment. Evidence Collection coverage, snapshots, raw-data imports, and offline re-analysis. Handoff Prioritized findings, optional review decisions, formatted reports, and Excel exports. If some data could not be collected, the UI shows what is missing. Recommendations are suggestions for you to review and test; the assessment does not apply them automatically. Actual savings must be measured after you make the recommended changes. 2. The five-step workflow The UI guides you from choosing what to assess to downloading a report. First, select your workspaces and check access. Then start the assessment, explore the results, and export what you need. The walkthrough below shows each step. Configure → Validate → Run analysis → Visualize results → Review & export Configure This Configure step defines what the assessment will cover: which workspaces to review, the date range, and the data to collect. These choices prepare the assessment; they do not start collection. The GIF shows the scope selection, warehouse choices, and date settings before moving to validation. Select the scope: choose the subscriptions, resource groups, and Databricks workspaces to include. Set the dates and cost basis: choose the period to assess. ActualCost shows charges as recorded; AmortizedCost spreads eligible commitment costs over time. Choose the collection profile: use Standard for core assessment data, Extended to include workspace asset metadata, or Custom to select optional data and analysis modules. Select SQL Warehouses: choose a warehouse for each workspace that needs system-table queries. Selection does not start compute. Queries can incur charges, so warehouse use requires approval in Validate. Next: Select Validate configuration. Validate Validation checks your setup and access to the selected Azure and Databricks data. It helps you identify missing permissions or approvals before starting the assessment. Select Run validation, approving warehouse auto-start if required. The UI shows which checks are running, which have passed, and what needs attention. The GIF shows an approval issue being resolved, followed by the access checks. Fix any blockers that prevent the assessment from running, and read warnings about data that may be limited or unavailable. If permissions are missing, the permission panel provides commands for an authorized administrator to run. Validation itself does not grant access. Next: Once validation allows you to proceed, select Continue to run below the permission panel. You will review the setup and start the assessment separately. Run analysis This step collects data from your selected Azure and Databricks workspaces, analyzes it, and creates the assessment report. You can follow the progress and see which sources returned data. Review the selected workspaces and date range, then select Start read-only assessment. The screen shows: Progress: the current stage, from initial checks and collection through analysis and report generation, plus elapsed time. Collection sources: cards grouped into Azure data and Databricks workspaces. Each card shows its status and the number of items collected, such as cost records, inventory, or billing data. Console: detailed messages to help explain delays or collection problems. When the run finishes, green means collection and analysis succeeded, not that every workload is healthy. Red means the run failed or some data needs attention. A skipped source was not collected, often because an optional check was not selected. The report and collected data are saved locally, including any reported gaps. Next: Select Visualize results to explore the saved assessment. Visualize results This step turns the collected data into charts, tables, and findings you can explore. Start with the overall cost and collection summary, then look at individual workspaces, compute resources, and jobs to understand what needs attention. You are viewing saved results, so switching tabs does not collect data again. The GIF follows the results from cost and workload details through findings, data quality, and a proposed roadmap. The tabs are grouped into Overview, Technical, and Decisions. Overview: understand the cost Executive summary: see total cost, spending mapped to workspaces, optimization candidates, and collection status. Check whether the detailed costs match the billing total and how much supporting data is available. Cost analysis: use Cost evidence to compare Actual and Amortized trends. Break down spending by Service, Meter category, SKU, Resource group, Workspace, or Owner tag, then inspect the largest cost drivers and unmapped spend. Commitment opportunities lets you enter a proposed number of committed nodes and calculate a scenario when the required hourly usage and pricing data is available. It does not purchase a commitment. Technical: inspect resources and workloads Compute and SQL has five views: Inventory: cluster and warehouse settings, including node types, worker counts, Photon, and automatic shutdown, plus job run and failure summaries. Utilization: CPU, memory, idle observations, and sample counts. Select a resource and a driver or worker instance to view its CPU and memory chart. Sizing: current node and worker configuration, with candidates to benchmark before resizing. Job health: runs, failures, notification settings, tasks, and retry policies. Network: data sent and received by nodes, plus CPU-wait measurements. These are traffic observations, not billed network charges. Queries: switch between Individual queries, Warehouse summaries, and User summaries. Review durations, queue times, and failures; search and sort to find queries that need investigation. Posture: inspect IP access list settings and Unity Catalog metastore assignment. Each check shows its observed value and outcome; this is not a full security audit. Assets: browse collected repositories, notebook metadata, MLflow experiments, serving endpoints, SQL alerts, Genie spaces, and Unity Catalog volumes. These appear only when the relevant optional data was collected. Decisions: check findings and plan the next steps Findings: browse recommendations by category, status, and confidence. Select a row to read what was observed, the recommended next step, supporting records, and any limitations. Evidence quality: see coverage by workspace, missing data, failed or skipped sources, and records excluded from scope. Open Inspect effective rules / create another analysis to review or change analysis settings, then Create child analysis to rerun them on saved data without changing the original snapshot. Roadmap: review proposed work across Days 0-30, 31-60, and 61-90, including owners and dependencies. The measurement plan explains the baseline for checking savings after a change; the roadmap is not an approved implementation schedule. Use Filters to narrow findings by subscription, resource group, workspace, workload, category, confidence, or status. Scope selections also apply to supported technical tables, which have their own search, sorting, and paging controls. Select a resource name to inspect its saved details. If data is unavailable, check Evidence quality before drawing a conclusion. A missing measurement does not mean that a resource was unused. Next: Select Review & export to read the report or download the results. Review & export This final step lets you read the assessment report and download files to discuss with your team. You can also record decisions on individual findings. Review is optional, so you do not need to approve every finding before exporting. The GIF shows a finding being reviewed, the formatted report and supporting files being opened, and an Excel workbook being generated and downloaded. Read the report: select Preview report to move directly to the formatted report in your browser. Use its contents links to jump to sections, and open supporting evidence links to inspect the saved files. Download the report: select Download report to save the original Markdown version. Downloading a file completes this workflow step, but does not approve findings or apply changes. Record a decision: expand Record a decision, choose a finding and decision, then enter the reviewer and an optional note. Select Save review decisions to retain the changes. A decision other than pending requires a reviewer. Inspect supporting files: use Run artifacts to preview supported files or download individual outputs. Reports appear as formatted pages; CSV and JSON previews show the file contents as text. Create an Excel workbook: choose the modules under Excel workbook, then select Generate workbook artifact and download the generated file. It includes summary, rules, quality, findings, saved review decisions, and the selected module sheets. It covers the full saved assessment, not just the rows currently filtered in the UI. Save or discard pending review edits before generating a workbook. Exports include saved decisions only. Check the files before sharing them because supporting evidence can contain sensitive environment details. Optional dashboard publication is a separate cloud action for publishing coverage counts, not the full assessment. It requires a destination workspace and warehouse, a preview of the publication plan, and explicit approval of the write and possible warehouse charges. 3. Reopen saved assessments A snapshot is a locally saved assessment, including the selected scope, collected data, findings, reports, and review decisions. It lets you return to earlier results, continue a review, or download files later without querying Azure or Databricks again. Reopen an assessment: choose a run from Saved snapshots. Entries show the run date, customer, status, and run ID, with the newest first. You can then explore its results or continue in Review & export. Try different analysis settings: open Evidence quality, expand Inspect effective rules / create another analysis, adjust the settings, and select Create child analysis. This creates a separate assessment using the same saved data. The original remains unchanged, and the new findings need their own review. Remove old assessments: use Manage snapshots to delete individual snapshots or clear the saved history. Deletion requires confirmation and permanently removes the selected runs, including their evidence, reports, and review decisions. Back up important runs first. Snapshots show what was collected at the time, not the current environment. To get newer data or collect a missing source, start a new assessment. 4. Architecture and collection flow The workbench runs on your machine, with a browser interface connected to a local Python server at http://127.0.0.1:8765. Azure and Databricks supply the data; collection scripts, analysis, and saved results stay local. No Azure-hosted application is needed. The diagram follows an assessment through seven stages: Configure: the React and TypeScript browser UI captures your selected workspaces, dates, and collection options. Coordinate: the Python API receives requests from the browser, launches assessment processes, and tracks progress. Check access: validation checks the selected scope, permissions, and required approvals. These checks use live access, but full collection starts only when you select Start read-only assessment. Collect: PowerShell scripts read Azure resource inventory and billing data, plus Databricks APIs and system tables. Requests to these external sources use HTTPS. Save evidence: each run stores the returned data, configuration, source outcomes, and logs in a local folder. Analyze: Python combines the saved data, checks costs against billing totals, identifies data gaps, and applies rules to produce findings and reports. Review and export: the API returns saved results to the browser, where you explore findings, record decisions, and download reports or data files. Keep in mind: the assessment does not apply recommendations. SQL Warehouse queries can incur charges, and exported files should be checked for sensitive details before sharing. 5. Get started Try it Prerequisites: PowerShell 7+, Python 3, Node.js 22.12+/npm for the build, and Azure CLI signed in. Collection needs Azure Reader/Cost Management Reader and the required Databricks source access. From the repository root: Set-Location .\ui npm ci npm run build Set-Location .. .\ui\Start-AssessmentUi.ps1 Open http://127.0.0.1:8765 and keep the launcher running. If already built, only the final command is needed. Learn more User guide Required permissions Test record and limitations Contribute Report issues in the repository with reproduction steps and redacted source statuses. Never include credentials or raw customer evidence. Publishing check: redact environment identifiers in GIFs and upload media when posting outside the repository. Displayed timings and amounts are not benchmarks or savings claims.439Views5likes3Comments
Engineering an Azure Data Layer for Odoo Analytics Without Changing the ERP
One thing I have learned from working on ERP-driven data projects is that the ERP is rarely the place where you want to solve every analytics problem. We saw this firsthand in a manufacturing engagement where Odoo was being used across finance, inventory, procurement, and manufacturing, but reporting still involved substantial manual extraction and Excel-based consolidation. The interesting engineering question wasn't “How do we replace the ERP?” It was: “How do we build a reliable analytical layer around it without changing the transactional system?” That shaped the architecture. We used Odoo APIs and Azure Data Factory for ingestion, landing the data in Azure Data Lake Storage Gen2. From there, the data was organized into Bronze, Silver, and Gold layers: Bronze: Source-aligned Odoo data was retained with minimal transformation. Silver: Data was cleansed, standardized, and prepared across finance, inventory, procurement, and manufacturing domains. Gold: Analytics-ready data was prepared for downstream reporting and consumption. Azure Databricks with Spark handled transformation and KPI standardization, while Synapse/SQL layers provided structured analytical models for reporting. Power BI datasets consumed the prepared data, with Row-Level Security applied for role-based access. Why did this separation matter for the project? The important architectural boundary was: Odoo → transactional operations Azure data platform → ingestion, storage, transformation, standardization Power BI → analytical consumption That separation meant the reporting layer did not have to repeatedly extract and reshape data directly from the ERP. It also gave us a dedicated place to handle historical data and standardize information across business domains before it reached the reporting layer. What changed? The implementation automated 15+ Odoo-based reports and provided governed Power BI dashboards to 60+ business users. More importantly, teams moved away from repeated ERP extraction and spreadsheet consolidation toward a reusable analytical data layer. For our team, the bigger takeaway was that ERP modernization does not necessarily mean modifying the ERP. For teams building Azure data platforms around ERP systems, how are you drawing the boundary between API ingestion, historical storage, transformation, and analytical modeling?120Views0likes0CommentsComplete Guide to Azure Databricks Cost Optimization for Data Engineers
Co-Authored by: Aladdin Alchalabi AladdinAlchalabi, Sanjeev Nair Sanjeev Nair and Rafia Aqil Rafia_Aqil This guide walks through a proven approach to Azure Databricks cost optimization, structured in three phases: 1. Discovery, 2. Cluster/Data/Code Best Practices, and 3. Team Alignment & Next Steps. Phase 1: Discovery Assessing Your Current State The following questions are designed to guide your initial assessment and help you identify areas for improvement. Documenting answers to each will provide a baseline for optimization and inform the next phases of your cost management strategy. Environment & Organization Cluster Management Cost Optimization Data Management Performance Monitoring Future Planning What is the current scale of your Databricks environment? How many workspaces do you have? How are your workspaces organized (e.g., by environment type, region, use case)? How many clusters are deployed? How many users are active? What are the primary use cases for Databricks in your organization? Data engineering Data science Machine learning Business intelligence How are clusters currently managed? Manual configuration Automated scripts Databricks REST API Cluster policies What is the average cluster uptime? Hours per day Days per week What is the average cluster utilization rate? CPU usage Memory usage What is the current monthly spend on Databricks? Total cost Breakdown by workspace Breakdown by cluster What cost management tools are currently in use? Azure Cost Management Third-party tools Are there any existing cost optimization strategies in place? Reserved instances Spot instances Cluster auto-scaling What is the current data storage strategy? Data lake Data warehouse Hybrid What is the average data ingestion rate? GB per day Number of files What is the average data processing time? ETL jobs Machine learning models What types of data formats are used in your environment? Delta Lake Parquet JSON CSV Other formats relevant to your workloads What performance monitoring tools are currently in use? Databricks Ganglia Azure Monitor Third-party tools What are the key performance metrics tracked? Job execution time Cluster performance Data processing speed Are there any planned expansions or changes to the Databricks environment? New use cases Increased data volume Additional users What are the long-term goals for Databricks cost optimization? Reducing overall spend Improving resource utilization & cost attribution Enhancing performance Understanding Databricks Cost Structure Total Cost = Cloud Cost + DBU Cost Cloud Cost: Compute (VMs, networking, IP addresses), storage (ADLS, MLflow artifacts), other services (firewalls), cluster type (serverless compute, classic compute) DBU Cost: Workload size, cluster/warehouse size, photon acceleration, compute runtime, workspace tier, SKU type (Jobs, Delta Live Tables, All Purpose Clusters, Serverless), model serving, queries per second, model execution time Diagnose Cost and Issues Effectively diagnosing cost and performance issues in Databricks requires a structured approach. Use the following steps and metrics to gain visibility into your environment and uncover actionable insights. 1. Identify Costly Workloads Account Console Usage Reports: Review usage reports to identify usage breakdowns by product, SKU name, and custom tags. Usage Breakdown by Product and SKU: Helps you understand which services and compute types (clusters, SQL warehouses, serverless options) are consuming the most resources. Custom Tags for Attribution: Tags allow you to attribute costs to teams, projects, or departments, making it easier to identify high-cost areas. Workflow and Job Analysis: By correlating usage data with workflows and jobs, you can pinpoint long-running or resource-heavy workloads that drive costs. Focus on Long-Running Workloads: Examine workloads with extended runtimes or high resource utilization. Key Question: Which pipelines or workloads are driving the majority of your costs? Governance Hub: is a centralized, account-level UI for monitoring and managing governance across Databricks. Note this is a beta feature, we will update this article as we get more information and use-cases on this feature. Now That You’ve Identified Long-Running Workloads, Review These Key Areas: 2. Review Cluster Metrics CPU Utilization: Track guest, iowait, idle, irq, nice, softirq, steal, system, and user times to understand how compute resources are being used. Memory Utilization: Monitor used, free, buffer, and cached memory to identify over- or under-utilization. Key Question: Is your cluster over- or under-utilized? Are resources being wasted or stretched too thin? 3. Review SQL Warehouse Metrics Live Statistics: Monitor warehouse status, running/queued queries, and current cluster count. Time Scale Filter: Analyze query and cluster activity over different time frames (8 hours, 24 hours, 7 days, 14 days). Peak Query Count Chart: Identify periods of high concurrency. Completed Query Count Chart: Track throughput and query success/failure rates. Running Clusters Chart: Observe cluster allocation and recycling events. Query History Table: Filter and analyze queries by user, duration, status, and statement type. Key Question: Is your SQL Warehouse over- or under-utilized? Are resources being wasted or stretched too thin? 4. Review Spark UI Stages Tab: Look for skewed data, high input/output, and shuffle times. Uneven task durations may indicate data skew or inefficient data handling. Jobs Timeline: Identify long-running jobs or stages that consume excessive resources. Stage Analysis: Determine if stages are I/O bound or suffering from data skew/spill. Executor Metrics: Monitor memory usage, CPU utilization, and disk I/O. Frequent garbage collection or high memory usage may signal the need for better resource allocation. 4.1. Spark UI: Storage & Jobs Tab Storage Level: Check if data is stored in memory, on disk, or both. Size: Assess the size of cached data. Job Analysis: Investigate jobs that dominate the timeline or have unusually long durations. Look for gaps caused by complex execution plans, non-Spark code, driver overload, or cluster malfunction. 4.2. Spark UI: Executor Tab Storage Memory: Compare used vs. available memory. Task Time (Garbage Collection): Review long tasks and garbage collection times. Shuffle Read/Write: Measure data transferred between stages. 5. Additional Diagnostic Methods System Tables in Unity Catalog: Query system tables for cost attribution and resource usage trends. Cost Observability Queries Tagging Analysis: Use tags to identify which teams or projects consume the most resources. Dashboards & Alerts: Set up cost dashboards and budget alerts for proactive monitoring. Phase 2: Cluster/Code/Data Best Practices Alignment Cluster UI Configuration and Cost Attribution Effectively configuring clusters/workloads in Databricks is essential for balancing performance, scalability, and cost. Tunning settings and features when used strategically can help organizations maximize resource efficiency and minimize unnecessary spending. Key Configuration Strategies 1. Reduce Idle Time: Clusters to incur costs even when not actively processing workloads. To avoid paying for unused resources: Enable Auto-Terminate: Set clusters automatically shut down after a period of inactivity. This simple setting can significantly reduce wasted spending. Enable Autoscaling: Workloads fluctuate in size and complexity. Autoscaling allows clusters to dynamically adjust the number of nodes based on demand: Automatic Resource Adjustment: Scale up for heavy jobs and scale down for lighter loads, ensuring you only pay for what you use. It significantly enhances cost efficiency and overall performance. For serverless and streaming, using Delta Live Tables with autoscaling is recommended. This approach leads to better resource management and reliability. Use Spot Instances: For batch processing and non-critical workloads, spot instances offer substantial cost savings: Lower VM Costs: Spot instances are typically much cheaper than standard VMs. However, they are not recommended for jobs requiring constant uptime due to potential interruptions. Considerations: Azure Spot VMs are intended for non-critical, fault-tolerant tasks. They can be evicted without notice, risking production stability. No SLA guarantees mean potential downtime for critical applications. Using Spot VMs could lead to reliability issues in production environments. Leverage Photon Engine: Photon is Databricks’ high-performance, vectorized query engine: Accelerate Large Workloads: Photon can dramatically reduce runtime for compute-intensive tasks, improving both speed and cost efficiency. Keep Runtimes Up to Date: Using the latest Databricks runtime ensures optimal performance and security: Benefit from Improvements: Regular updates include performance enhancements, bug fixes, and new features. Apply Cluster Policies: Cluster policies help standardize configurations and enforce cost controls across teams: Governance and Consistency: Policies can restrict certain settings, enforce tagging, and ensure clusters are created with cost-effective defaults. Optimize Storage: type impacts both performance and cost: Switch from HDDs to SSDs: SSDs provide faster caching and shuffle operations, which can improve job efficiency and reduce runtime. Tag Clusters for Cost Attribution: Tagging clusters enables granular tracking and reporting: Visibility and Accountability: Use tags to attribute costs to specific teams, projects, or environments, supporting better budgeting and chargeback processes. Select the Right Cluster Type: Different workloads require different cluster types, see table below for Serverless vs Classic Compute: Feature Classic Compute Serverless Compute Control Full control over config & network Minimal control, fully managed by Databricks Startup Time Slower (unless pre-warmed) Instant Cost Model Hourly, supports reservations Pay-per-use, elastic scaling Security VNet injection, private endpoints NCC-based private connectivity Best For Heavy ETL, ML, compliance workloads Interactive queries, unpredictable demand Job Clusters: Ideal for scheduled jobs and Delta Live Tables. All-Purpose Clusters: Suited for ad-hoc analysis and collaborative work. Single-Node Clusters: Efficient for simple exploratory data analysis or pure Python tasks. Serverless Compute: Scalable, managed workloads with automatic resource management. 11. Monitor and Adjust Regularly: review cluster metrics and query history: Continuous Optimization: Use built-in dashboards to monitor usage, identify bottlenecks, and adjust cluster size or configuration as needed. Code Best Practices Avoid Reprocessing Large Tables Use a CDC (Change Data Capture) architecture with Delta Live Tables (DLT) to process only new or changed data, minimizing unnecessary computation. Ensure Code Parallelizes Well Write Spark code that leverages parallel processing. Avoid loops, deeply nested structures, and inefficient user-defined functions (UDFs) that can hinder scalability. Reduce Memory Consumption Tweak Spark configurations to minimize memory overhead. Clean out legacy or unnecessary settings that may have carried over from previous Spark versions. Prefer SQL Over Complex Python Use SQL (declarative language) for Spark jobs whenever possible. SQL queries are typically more efficient and easier to optimize than complex Python logic. Modularize Notebooks Use %run to split large notebooks into smaller, reusable modules. This improves maintainability. Use LIMIT in Exploratory Queries When exploring data, always use the LIMIT clause to avoid scanning large datasets unnecessarily. Monitor Job Performance Regularly review Spark UI to detect inefficiencies such as high shuffle, input, or output. Review the below table for optimization opportunities: Spark stage high I/O - Azure Databricks | Microsoft Learn Databricks Code Performance Enhancements & Data Engineering Best Practices By enabling the below features and applying best practices, you can significantly lower costs, accelerate job execution, and build Databricks pipelines that are both scalable and highly reliable. For more guidance review: Comprehensive Guide to Optimize Data Workloads | Databricks. Feature / Technique Purpose / Benefit How to Use / Enable / Key Notes Disk Caching Accelerates repeated reads of Parquet files Set spark.databricks.io.cache.enabled = true Dynamic File Pruning (DFP) Skips irrelevant data files during queries, improves query performance Enabled by default in Databricks Low Shuffle Merge Reduces data rewriting during MERGE operations, less need to recalculate ZORDER Use Databricks runtime with feature enabled Adaptive Query Execution (AQE) Dynamically optimizes query plans based on runtime statistics Available in Spark 3.0+, enabled by default Deletion Vectors Efficient row removal/change without rewriting entire Parquet file Enable in workspace settings, use with Delta Lake Materialized Views Faster BI queries, reduced compute for frequently accessed data Create in Databricks SQL Optimize Compacts Delta Lake files, improves query performance Run regularly, combine with ZORDER on high-cardinality columns ZORDER Physically sorts/co-locates data by chosen columns for faster queries Use with OPTIMIZE, select columns frequently used in filters/joins Auto Optimize Automatically compacts small files during writes Enable optimizeWrite and autoCompact table properties Liquid Clustering Simplifies data layout, replaces partitioning/ZORDER, flexible clustering keys Recommended for new Delta tables, enables easy redefinition of clustering keys File Size Tuning Achieve optimal file size for performance and cost Set delta.targetFileSize table property Broadcast Hash Join Optimizes joins by broadcasting smaller tables Adjust spark.sql.autoBroadcastJoinThreshold and spark.databricks.adaptive.autoBroadcastJoinThreshold Shuffle Hash Join Faster join alternative to sort-merge join Prefer over sort-merge join when broadcasting isn’t possible, Photon engine can help Cost-Based Optimizer (CBO) Improves query plans for complex joins Enabled by default, collect column/table statistics with ANALYZE TABLE Data Spilling & Skew Handles uneven data distribution and excessive shuffle Use AQE, set spark.sql.shuffle.partitions=auto, optimize partitioning Data Explosion Management Controls partition sizes after transformations (e.g., explode, join) Adjust spark.sql.files.maxPartitionBytes, use repartition() after reads Delta Merge Efficient upserts and CDC (Change Data Capture) Use MERGE operation in Delta Lake, combine with CDC architecture Data Purging (Vacuum) Removes stale data files, maintains storage efficiency Run VACUUM regularly based on transaction frequency Phase 3: Team Alignment and Next Steps Implementing Cost Observability and Taking Action Effective cost management in Databricks goes beyond configuration and code—it requires robust observability, granular tracking, and proactive measures. Below outlines how your teams can achieve this using system tables, tagging, dashboards, and actionable scripts. Cost Observability with System Tables Databricks Unity Catalog provides system tables that store operational data for your account. These tables enable historical cost observability and empower FinOps teams to analyze spend independently. System Tables Location: Found inside the Unity Catalog under the “system” schema. Key Benefits: Structured data for querying, historical analysis, and cost attribution. Action: Assign permissions to FinOps teams so they can access and analyze dedicated cost tables. Enable Tags for Granular Tracking Tagging is a powerful feature for tracking, reporting, and budgeting at a granular level. Classic Compute: Manually add key/value pairs when creating clusters, jobs, SQL Warehouses, or Model Serving endpoints. Use cluster policies to enforce custom tags. Serverless Compute: Create budget policies and assign permissions to teams or members for serverless workloads. Action: Tag all compute resources to enable detailed cost attribution and reporting. Track Costs with Dashboards and Alerts Databricks offers prebuilt dashboards and queries for cost forecasting and usage analysis. Dashboards: Visualize spend, usage trends, and forecast future costs. Prebuilt Queries: Use top queries with system tables to answer meaningful cost questions. Budget Alerts: Set up alerts in the Account Console (Usage > Budget) to receive notifications when spend approaches defined thresholds. Build Culture of Efficiency To go beyond technical fixes and build a culture of efficiency, by focusing on the below strategic actions: Collaborate with Internal Engineers: Spend time with engineering teams to understand workload patterns and optimization opportunities. Peer Reviews and Code Audits: Conduct regular code review sessions and peer reviews to ensure best practices are followed for Spark jobs, data pipelines, and cluster configurations. Create Internal Best Practice Documentation: Develop clear guidelines for writing optimized code, managing data, and maintaining clusters. Make these resources easily accessible for all teams. Implement Observability Dashboards: Use Databricks’ built-in features to create dashboards that track spend, monitor resource utilization, and highlight anomalies. Set Alerts and Budgets: Configure alerts for long-running workloads and establish budgets using prebuilt Databricks capabilities to prevent cost overruns. 5. Azure Reservations and Azure Savings Plan When optimizing Databricks costs on Azure, it’s important to understand the two main commitment-based savings options: Azure Reservations and Azure Savings Plans. Both can help you reduce compute costs, but they differ in flexibility and how savings are applied. Which Should You Choose? Reservations are ideal if you have stable, predictable Databricks workloads and want maximum savings. Savings Plans are better if you expect your compute needs to change, or if you want a simpler, more flexible way to save across multiple services. Pro Tip: You can combine both options—use Reservations for your baseline, always-on Databricks clusters, and Savings Plans for bursty, variable, or new workloads. Summary Table: Action Steps It’s critical to monitor costs continuously and align your teams with established best practices, while scheduling regular code review sessions to ensure efficiency and consistency. Area Best Practice / Action System Tables Use for historical cost analysis and attribution Tagging Apply to all compute resources for granular tracking Dashboards Visualize spend, usage, and forecasts Alerts Set budget alerts for proactive cost management Scripts/Queries Build custom analysis tools for deep insights Cluster/Data/Code Review & Align Regularly review best practices, share findings, and align teams on optimization Save on your Usage Consider Azure Reservations and Azure Savings Plan905Views2likes0Comments