azure database for postgresql flexible server
126 Topics
End-to-end workload observability with Query Store for primary and replicas
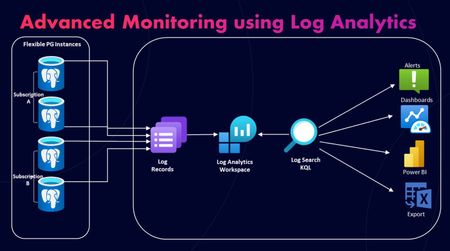
Query performance doesn’t stop at the primary Most PostgreSQL architectures don’t run on a single node anymore. Reads get offloaded. Replica chains grow. And when performance issues hit, the hardest part is often simple: where did the queries actually run? With the latest query store capabilities in Azure Database for PostgreSQL flexible server, you can now capture workload executed not just on the primary, but also on read replicas—including cascading read replicas—and export the captured runtime stats, wait stats, and query text into Azure Monitor Logs (Log Analytics workspace / LAWS). See the real hotspot: isolate which node (primary vs replica) is slow. Know why: break down time by waits (CPU, I/O, locks) per query. Connect the dots: correlate query IDs to query text, and inspect sampled parameters locally in azure_sys on the primary when you need input context (parameters aren’t exported to LAWS). Centralize analysis: query everything with KQL in LAWS, across servers. What you’ll build This post walks through a reproducible demo that provisions a primary server, a read replica, and a cascading read replica, then runs a TPC-H–based workload across all three to generate query store data you can analyze locally and in Log Analytics. Enable query store capture (including query text) and parameter sampling for parameterized queries. Enable wait sampling so query store can record wait statistics. Export runtime stats, wait stats, and SQL text to LAWS using resource-specific tables. Validate capture on read replicas and cascading read replicas (not just the primary). Prerequisites Azure CLI logged in (az login) and permission to create a resource group, Log Analytics workspace, and PostgreSQL flexible servers. psql and curl available on your machine. PostgreSQL flexible server on General Purpose or Memory Optimized tier (query store and replicas aren’t supported on Burstable). PostgreSQL 14+ to test out cascading replicas. Networking: the script opens firewall access broadly for demos—tighten for production. Architecture (primary + replica chain + LAWS) You’ll deploy four resources: Primary server: read/write node. Read replica (level 1): read-only node created from the primary. Cascading read replica (level 2): read-only node created from replica level 1. Log Analytics workspace (LAWS): central place to query Query Store telemetry across all nodes. If Diagnostic Settings is properly configured, each server streams query store telemetry to LAWS—but how it’s kept locally differs by role. On the primary, query store data is recorded in-memory, then persisted locally in the azure_sys database, and then exported to LAWS. On read replicas (including cascading replicas), query store data is recorded in-memory only and then exported to LAWS. Bottom line: use LAWS for fleet-wide visibility, and use the primary’s azure_sys when you need deep local inspection (like parameter samples). Deploy the demo environment The fastest way to reproduce the scenario is to run the end-to-end bash script which you can download from https://raw.githubusercontent.com/Azure-Samples/azure-postgresql-query-store/refs/heads/main/may2026/script/query_store_demo.sh Save the file to a local directory in your Linux shell, and name the file query_store_demo.sh. To invoke the script, at minimum, you must assign a string password for the administrator login of the instances of the flexible servers it creates, and invoke the script like this: ADMIN_PASSWORD=<Your_Strong_Password> ./query_store_demo.sh Optionally, you can also override default values for other environment variables used by the script: Variable Purpose Default SUBSCRIPTION_ID Azure subscription ID to use (current default subscription) BASE_NAME Base name for all resources (used in naming servers, resource groups, etc.) pgqswait{YYYYMMDDHHMMSS} RESOURCE_GROUP Azure resource group name rg-{BASE_NAME} LOCATION Azure region for resources southeastasia PRIMARY_SERVER Name of primary PostgreSQL server {BASE_NAME}-primary REPLICA_1 Name of first-level read replica {BASE_NAME}-readreplica REPLICA_2 Name of second-level cascading read replica {BASE_NAME}-cascadereadreplica LOG_ANALYTICS_WORKSPACE Log Analytics workspace name law-{BASE_NAME} LOG_ANALYTICS_LOCATION Azure region for Log Analytics workspace southeastasia ADMIN_USER PostgreSQL admin username pgadmin ADMIN_PASSWORD PostgreSQL admin password (REQUIRED) SKU_NAME PostgreSQL server SKU (compute tier) Standard_D4ds_v5 TIER PostgreSQL pricing tier GeneralPurpose STORAGE_SIZE Storage size in GB 64 VERSION PostgreSQL version (minimum 14 for cascading replicas) 17 PRIMARY_DATABASE Initial database name postgres SQL_BASE_URL Base URL for downloading SQL scripts https://raw.githubusercontent.com/Azure-Samples/azure-postgresql-query-store/refs/heads/main/may2026/script/query_store_demo.sh TPCH_DDL_URL URL for TPC-H schema DDL file {SQL_BASE_URL}/schema/tpch_ddl.sql WORKLOAD_REPETITIONS Number of times to execute each workload query (minimum 5) 10 AUTO_APPROVE Skip confirmation prompt and proceed automatically false If, for example, you want to not only pass the ADMIN_PASSWORD but also override the LOCATION, you could do it like this: ADMIN_PASSWORD=<Your_Strong_Password> LOCATION=canadacentral ./query_store_demo.sh In a bit over 1 hour, the script will do the following steps: Step 1 — Provision first part of the infrastructure The infrastructure provisioned in this phase consists of: A resource group in which all resources are deployed. An instance of Log Analytics workspace, where all flexible server instances will send their query store related logs. A primary (read-write) flexible server. Step 2 — Configure primary server Now it's time to configure one new server parameters on your primary server so that query store emits query text to LAWS, so that we can correlate quey IDs to something recognizable. Query IDs are great for aggregation—but you still need the SQL. Turn on query text emission so you can correlate runtime and waits back to the actual statement text. Do this by setting pg_qs.emit_query_text to on. Refer to our documentation to learn how to set the value of a server parameter. Step 3 — Provision second part of the infrastructure The infrastructure provisioned in this phase consists of: A read replica (read-only) whose source is the primary server. A cascade read replica (read-only), whose source is the previously created read replica. Notice that when read replicas are created, they inherit the server parameter values from their source server. Because we have configured query store related settings on the primary server already, the intermediate read replica inherits its server parameters from that primary, and the cascade read replica inherits them from the intermediate replica. Step 4 — Export query store to Log Analytics (LAWS) Now for the payoff, we want to stream the data to Log Analytics so you can query across nodes, build dashboards, and alert. The script configures diagnostic settings on the primary and both replicas to send logs to a Log Analytics workspace using resource-specific tables. This is the key to cross-node visibility: each server exports its own captured telemetry, and you can slice by resource in a single KQL query. Query store runtime stats: execution counts, elapsed time, and other performance counters. Query store wait stats: wait breakdown attributed to queries. Query store SQL text: query text to decode query IDs. Note: Query store parameter samples are not included in the Log Analytics export. Parameters are stored locally per server in azure_sys, and on read replicas azure_sys is read-only—so don’t depend on replicas for parameter inspection. LAWS receives runtime stats, wait stats, and query text. Diagnostics settings for an instance of flexible server can be configured via portal. In the resource menu, under Monitoring, select Diagnostic settings. Add a new diagnostic setting, select a destination Log Analytics workspace, and the individual log catergories which you want to stream to that LAWS, and save the changes. For Destination table it's highly recommended to use Resource specific (one table per signal with proper schema) over Azure diagnostics (legacy one table for everything). With Azure diagnostics, all logs from all resource types land into a single table (AzureDiagnostics). It's a wide table with many columns. New columns get added as services emit new fields. If the 500 column limit is hit, extra fields go into the AdditionalFields column (a dynamic JSON). Querying on attributes stored in that column might have huge performance and query cost impact. The schema is inconsistent and difficult to discover. You must always filter events in that table by ResourceType and Category. On the other hand, with Resource specific, logs are written to separate tables per resource type and category. Therefore, each table has a well-defined schema and columns are strongly typed. Tables are smaller and faster to query. Queries on these tables are simpler don't need filtering by ResourceType and Category. Performance-wise, they also support faster ingestion and faster querying. They also support selecting different table plans and retention settings for each table. And, more importantly, role-based access control (RBAC) permissions can be applied at table level, allowing you to control access to telemetry in a more granular way. Note: If you want to see any of the images in this article in better quality, click on them to see them in their original size. This can also be configured using Azure CLI command az monitor diagnostic-settings create. Make sure that the --export-to-resource-specific parameter is set to true, which is the equivalent of selecting Resource specific for Destination table in portal UI. Setting this parameter to false, would mean that you want to use AzureDiagnostics as the destination table, which we don't recommend using. Step 5 — Run some workload In this phase the script loads a TPC-H schema and executes workload SQL across different nodes so that you can prove replica capture. Query it in Log Analytics Once the workload completed and data was streamed to Log Analytics, you can open your Log Analytics workspace, and start querying the relevant tables. If you don't know how to start issuing queries in a Log Analytics workspace, refer to Get started with log queries in Azure Monitor Logs. In your Log Analytics workspace, when you select Logs in the resource menu, you can access the Queries hub. By default, it should open automatically unless you have configured it to not show, in which case you can open by selecting Queries hub on the top right corner of the Logs home screen. If you add a filter in the queries hub for Resource type equals Azure Database for PostgreSQL Flexible Server, you'll be able to access multiple examples of queries which might help you get started querying the log categories we support for our service. You can run any of them by selecting Run on the summarization card that describes the query or, if you hover the mouse over the card, you can select Load to editor so that the query is copied over to the active query window, and you can run it or modified it further. Following, there are a few more query examples which can be useful to analyze the workload executed in this experiment. Top queries by total time (across all nodes) To get the list of 10 queries with higher duration from the ones that ran on any of the three nodes. KQL PGSQLQueryStoreRuntime | summarize total_time_ms = sum(TotalExecDurationMs) by QueryId, LogicalServerName | top 10 by total_time_ms desc Results Important: Results might be slightly different on each execution of the experiment. Where queries wait on each node List the most frequent wait events observed on user initiated queries across all nodes. KQL PGSQLQueryStoreWaits | join kind=inner (PGSQLQueryStoreRuntime) on QueryId | summarize total_waits_sampled = sum(Calls) by Event, EventType, LogicalServerName | order by total_waits_sampled desc Results Important: Results might be slightly different on each execution of the experiment. Decode query IDs (join runtime stats with SQL text) Top 20 queries the most frequent wait events observed on user initiated queries across all nodes. KQL PGSQLQueryStoreRuntime | join kind=inner (PGSQLQueryStoreQueryText) on QueryId | where QueryType == 'select' | project LogicalServerName, QueryId, TotalExecDurationMs, QueryText | top 20 by TotalExecDurationMs desc Results Important: Results might be slightly different on each execution of the experiment. Compare primary vs replicas (workload distribution) Find total number of query executions and accumulated duration of all those executions for each node. KQL PGSQLQueryStoreRuntime | summarize execs = sum(Calls), total_time_ms = sum(TotalExecDurationMs) by LogicalServerName | order by total_time_ms desc Results Important: Results might be slightly different on each execution of the experiment. Replica-only hotspots (find what’s slow off the primary) Find top 10 queries executed by their aggregated duration, focusing on what was executed on read replicas only. KQL let Replicas = dynamic(["pgqswait20260505220501-readreplica", "pgqswait20260505220501-cascadereadreplica"]); PGSQLQueryStoreRuntime | where LogicalServerName in (Replicas) | summarize total_time_ms = sum(TotalExecDurationMs) by QueryId, LogicalServerName | top 10 by total_time_ms desc Results Important: Results might be slightly different on each execution of the experiment. QPI now supports query store stats collected on replicas You can now use Query Performance Insight workbooks to analyze query store information not only on your primary server, as you were used to, but you can also get that valuable information on your read replicas. Why replica workload capture is a big deal This is the unlock: you can now answer performance questions in replica-heavy architectures without stitching together partial signals. Per-node truth: see the slow queries on the node where they actually ran (primary vs replica vs cascading replica). Faster root cause: runtime + waits gives you “slow” and “why” in one place. Replica tuning that sticks: identify replica-specific bottlenecks (I/O saturation, lock waits, CPU pressure) and tune with evidence. Centralized observability: export to LAWS so you can build dashboards, alerts, and cross-server comparisons with KQL. Unlock query visibility: Access query text without database permissions. Fine grain control on who can view query text: Using resource specific tables in LAWS, you can decide which users can access the table in which text of the queries is kept. Parameter-aware debugging: sampled parameters can help reproduce issues and explain plan changes, but they’re stored locally in azure_sys and not exported to LAWS. In practice, rely on the primary for parameter inspection (replicas have read-only azure_sys). Operational notes (quick but important) Expect a delay: Query store stats and LAWS ingestion aren’t instant. Give it a few minutes after running workload. Mind retention: Query store retention and Log Analytics retention are separate knobs. Tune them to balance troubleshooting value and cost. Production hygiene: don’t use wide-open firewall rules outside of a demo. Clean up When you’re done, delete the resource group: az group delete --name <RESOURCE_GROUP> --yes --no-wait Bottom line Query store in Azure Database for PostgreSQL flexible server now matches how modern architectures run—across primary, read replicas, and cascading replicas—and LAWS gives you a single place to query, compare, and act.676Views13likes0CommentsPostgreSQL for the enterprise: scale, secure, simplify
This week at Microsoft Ignite, along with unveiling the new Azure HorizonDB cloud native database service, we’re announcing multiple improvements to our fully managed open-source Azure Database for PostgreSQL service, delivering significant advances in performance, analytics, security, and AI-assisted migration. Let’s walk through nine of the top Azure Database for PostgreSQL features and improvements we’re announcing at Microsoft Ignite 2025. Feature Highlights New Intel and AMD v6-series SKUs (Preview) Scale to multiple nodes with Elastic Clusters (GA) PostgreSQL 18 (GA) Realtime analytics with Fabric Mirroring (GA) Analytical queries inside PostgreSQL with the pg_duckdb extension (Preview) Adding Parquet to the azure_storage extension (GA) Meet compliance requirements with the credcheck, anon & ip4r extensions (GA) Integrated identity with Entra token-refresh libraries for Python AI-Assisted Oracle to PostgreSQL Migration Tool (Preview) Performance and scale New Intel and AMD v6 series SKUs (Preview) You can run your most demanding Postgres workloads on new Intel and AMD v6 General Purpose and Memory Optimized hardware SKUs, now availble in preview These SKUs deliver massive scale for high-performance OLTP, analytics and complex queries, with improved price performance and higher memory ceilings. AMD Confidential Compute v6 SKUs are also in Public Preview, enabling enhanced security for sensitive workloads while leveraging AMD’s advanced hardware capabilities. Here’s what you need to know: Processors: Powered by 5th Gen Intel® Xeon® processor (code-named Emerald Rapids) and AMD's fourth Generation EPYC™ 9004 processors Scale: VM size options scale up to 192 vCores and 1.8 TiB IO: Using the NVMe protocol for data disk access, IO is parallelized to the number of CPU cores and processed more efficiently, offering significant IO improvements Compute tier: Available in our General Purpose and Memory Optimized tiers. You can scale up to these new compute SKUs as needed with minimal downtime. Learn more: Here's a quick summary of the v6 SKUs we’re launching, with links to more information: Processor SKU Max vCores Max Mem Intel Ddsv6 192 768 GiB Edsv6 192 1.8 TiB AMD Dadsv6 96 384 GiB Eadsv6 96 672 GiB DCadsv6 96 386 GiB ECadsv6 96 672 GiB Scale to multiple nodes with Elastic clusters (GA) Elastic clusters are now generally available in Azure Database for PostgreSQL. Built on Citus open-source technology, elastic clusters bring the horizontal scaling of a distributed database to the enterprise features of Azure Database for PostgreSQL. Elastic clusters enable horizontal scaling of databases running across multiple server nodes in a “shared nothing” architecture. This is ideal for workloads with high-throughput and storage-intensive demands such as multi-tenant SaaS and IoT-based workloads. Elastic clusters come with all the enterprise-level capabilities that organizations rely upon in Azure Database for PostgreSQL, including high availability, read replicas, private networking, integrated security and connection pooling. Built-in sharding support at both row and schema level enables you to distribute your data across a cluster of compute resources and run queries in parallel, dramatically increasing throughput and capacity. Learn more: Elastic clusters in Azure Database for PostgreSQL PostgreSQL 18 (GA) When PostgreSQL 18 was released in September, we made a preview available on Azure on the same day. Now we’re announcing that PostgreSQL 18 is generally available on Azure Database for PostgreSQL, with full Major Version Upgrade (MVU) support, marking our fastest-ever turnaround from open-source release to managed service general availability. This release reinforces our commitment to delivering the latest PostgreSQL community innovations to Azure customers, so you can adopt the latest features, performance improvements, and security enhancements on a fully managed, production-ready platform without delay. ^Note: MVU to PG18 is currently available in the NorthCentralUS and WestCentralUS regions, with additional regions being enabled over the next few weeks Now you can: Deploy PostgreSQL 18 in all public Azure regions. Perform in-place major version upgrades to PG18 with no endpoint or connection string changes. Use Microsoft Entra ID authentication for secure, centralized identity management in all PG versions. Enable Query Store and Index Tuning for built-in performance insights and automated optimization. Leverage the 90+ Postgres extensions supported by Azure Database for PostgreSQL. PostgreSQL 18 also delivers major improvements under the hood, ranging from asynchronous I/O and enhanced vacuuming to improved indexing and partitioning, ensuring Azure continues to lead as the most performant, secure, and developer-friendly PostgreSQL managed service in the cloud. Learn more: PostgreSQL 18 open-source release announcement Supported versions of PostgreSQL in Azure Database for PostgreSQL Analytics Real-time analytics with Fabric Mirroring (GA) With Fabric mirroring in Azure Database for PostgreSQL, now generally available, you can run your Microsoft Fabric analytical workloads and capabilities on near-real-time replicated data, without impacting the performance of your production PostgreSQL databases, and at no extra cost. Mirroring in Fabric connects your operational and analytical platforms with continuous data replication from PostgreSQL to Fabric. Transactions are mirrored to Fabric in near real-time, enabling advanced analytics, machine learning, and reporting on live data sets without waiting for traditional batch ETL processes to complete. This approach eliminates the overhead of custom integrations or data pipelines. Production PostgreSQL servers can run mission-critical transactional workloads without being affected by surges in analytical queries and reporting. With our GA announcement Fabric mirroring is ready for production workloads, with secure networking (VNET integration and Private Endpoints supported), Entra ID authentication for centralized identity management, and support for high availability enabled servers, ensuring business continuity for mirroring sessions. Learn more: Mirroring Azure Database for PostgreSQL flexible server Adding Parquet support to the azure_storage extension (GA) In addition to mirroring data directly to Microsoft Fabric, there are many other scenarios that require moving operational data into data lakes for analytics or archival. The complexity of building and maintaining ETL pipelines can be expensive and time-consuming. Azure Database for PostgreSQL now natively supports Parquet via the azure_storage extension, enabling direct SQL-based read/write to Parquet files in Azure Storage. This makes it easy to import and export data in Postgres without external tools or scripts. Parquet is a popular columnar storage format often used in big data and analytics environments (like Spark and Azure Data Lake) because of its efficient compression and query performance for large datasets. Now you can use the azure_storage extension to can skip an entire step: just issue a SQL command to write to and query from a Parquet file in Azure Blob Storage. Learn more: Azure storage extension in Azure Database for PostgreSQL Analytical queries inside PostgreSQL with the pg_duckdb extension (Preview) DuckDB’s columnar engine excels at high performance scans, aggregations and joins over large tables, making it particularly well-suited for analytical queries. The pg_duckdb extension, now available in preview for Azure Database for PostgreSQL combines PostgreSQL’s transactional performance and reliability with DuckDB’s analytical speed for large datasets. Together pg_duckdb and PostgreSQL are an ideal combination for hybrid OLTP + OLAP environments where you need to run analytical queries directly in PostgreSQL without sacrificing performance., To see the pg_duckdb extension in action check out this demo video: https://aka.ms/pg_duckdb Learn more: pg_duckdb – PostgreSQL extension for DuckDB Security Meet compliance requirements with the credcheck, anon & ip4r extensions (GA) Operating in a regulated industry such as Finance, Healthcare and Government means negotiating compliance requirements like HIPAA and PCI-DSS, GDPR that include protection for personalized data and password complexity, expiration and reuse. This week the anon extension, previously in preview, is now generally available for Azure Database for PostgreSQL adding support for dynamic and static masking, anonymized exports, randomization and many other advanced masking techniques. We’ve also added GA support for the credcheck extension, which provides credential checks for usernames, and password complexity, including during user creation, password change and user renaming. This is particularly useful if your application is not using Entra ID and needs to rely on native PostgreSQL users and passwords. If you need to store and query IP ranges for scenarios like auditing, compliance, access control lists, intrusion detection and threat intelligence, another useful extension announced this week is the ip4r extension which provides a set of data types for IPv4 and IPv6 network addresses. Learn more: PostgreSQL Anonymizer credcheck – PostgreSQL username/password checks IP4R - IPv4/v6 and IPv4/v6 range index type for PostgreSQL The Azure team maintains an active pipeline of new PostgreSQL extensions to onboard and upgrade to Azure Database for PostgreSQL For example, another important extension upgraded this week is pg_squeeze which removes unused space from a table. The updated 1.9.1 version adds important stability improvements. Learn more: List of extensions and modules by name Integrated identity with Entra token-refresh libraries for Python In a modern cloud-connected enterprise, identity becomes the most important security perimeter. Azure Database for PostgreSQL is the only managed PostgreSQL service with full Entra integration, but coding applications to take care of Entra token refresh can be complex. This week we’re announcing a new Python library to simplify Entra token refresh. The library automatically refreshes authentication tokens before they expire, eliminating manual token handling and reducing connection failures. The new python_azure_pg_auth library provides seamless Azure Entra ID authentication and supports the latest psycopg and SQLAlchemy drivers with automatic token acquisition, validation, and refresh. Built-in connection pooling is available for both synchronous and asynchronous workloads. Designed for cross-platform use (Windows, Linux, macOS), the package features clean architecture and flexible installation options for different driver combinations. This is our first milestone in a roadmap to add token refresh for additional programming languages and frameworks. Learn more, with code samples to get started here: https://aka.ms/python-azure-pg-auth Migration AI-Assisted Oracle to PostgreSQL Migration Tool (Preview) Database migration is a challenging and time-consuming process, with multiple manual steps requiring schema and apps specific information. The growing popularity, maturity and low cost of PostgreSQL has led to a healthy demand for migration tooling to simplify these steps. The new AI-assisted Oracle Migration Tool preview announced this week greatly simplifies moving from Oracle databases to Azure Database for PostgreSQL. Available in the VS Code PostgreSQL extension the new migration tool combines GitHub Copilot, Azure OpenAI, and custom Language Model Tools to convert Oracle schema, database code and client applications into PostgreSQL-compatible formats. Unlike traditional migration tools that rely on static rules, Azure’s approach leverages Large Language Models (LLMs) and validates every change against a running Azure Database for PostgreSQL instance. This system not only translates syntax but also detects and fixes errors through iterative re-compilation, flagging any items that require human review. Application codebases like Spring Boot and other popular frameworks are refactored and converted. The system also understands context by querying the target Postgres instance for version and installed extensions. It can even invoke capabilities from other VS Code extensions to validate the converted code. The new AI-assisted workflow reduces risk, eliminates significant manual effort, and enables faster modernization while lowering costs. Learn more: https://aka.ms/pg-migration-tooling Be sure to follow the Microsoft Blog for PostgreSQL for regular updates from the Postgres on Azure team at Microsoft. We publish monthly recaps about new features in Azure Database for PostgreSQL, as well as an annual blog about what’s new in Postgres at Microsoft.4KViews9likes0Commentspg_signal_autovacuum_worker Role for Managing Autovacuum in Azure Database for PostgreSQL
Have you ever faced a situation where your database is taking longer than expected to execute a DDL command? It can be a frustrating experience when a pending command execution blocks your workflow. If you’re wondering which process might be blocking your DDL command, there could be different reasons. One of the primary reasons could be when autovacuum process is executing for the table in the background. Let me explain this with the help of an example. Consider we have a table "accounts” in our Azure Database for PostgreSQL flexible server instance database. We want to add a field and execute an ALTER statement on it. When this statement is in the process of execution, you may observe the database has significantly slowed down or stopped responding to the read/write queries for a while, resulting in a latency spike. In this scenario, the first approach would be to make sure there are no concurrent processes working on the table before executing the ALTER statement. If one of these processes is autovacuum, you will have to wait until the autovacuum process is executed on the table, which will cause a delay in committing this statement. In managed services, giving a system-level access to users can cause severe security and database integrity concerns, so users cannot manage the critical background processes like autovacuum in a controlled manner. With the recent update, we have backported 'pg_signal_autovacuum_worker' role from PostgreSQL version 18, with this approach it is now possible to control the autovacuum process without giving system level access to the users by using 'pg_terminate_backend' command in Azure Database for PostgreSQL Flexible Server in PostgreSQL versions 15 and higher. This role helps non-super users interact with autovacuum process in a secure and controlled manner. Let’s learn more about the autovacuum process and how this new role 'pg_signal_autovacuum_worker' helps you to manage the process more securely with controlled access for non-super users. What is the autovacuum process? PostgreSQL uses various maintenance processes to handle heavy server loads, one of them being autovacuum. Autovacuum removes obsolete versions of tuples that were created by UPDATE or DELETE statements, and that aren’t accessible anymore by any outstanding transaction. The autovacuum_naptime and autovacuum_max_workers are important parameters for the autovacuum process. This process gets launched every autovacuum_naptime seconds, the autovacuum worker gets triggered based on the number of proportion of dead tuples in the table. You can read more about the autovacuum process and how it’s triggered here. Common Problems with autovacuum Autovacuum process is an important background process as it helps with regular cleanup of dead tuples. However if it conflicts with a long running transaction or in a write-heavy environment there can be following issues: Autovacuum Blocking DDL Operations: Normal Autovacuum: Autovacuum jobs cancel themselves after deadlock_timeout (default value is 1 second) when a user triggers DDL on the table. But in some cases, users can experience significant latency up to the value of deadlock_timeout while executing read/write queries on the table. Wraparound protection Autovacuum: This type of autovacuum does not cancel itself and blocks DDL until the job is completed. Challenges with Updating Parameters in Ongoing Autovacuum Processes: Autovacuum configuration can be tuned using server parameters like autovacuum_naptime, autovacuum_max_workers, autovacuum_analyze_scale_factor etc. When you have an autovacuum process that is running for a long time, the changed parameters do not get reflected in already running autovacuum process. Azure Database for PostgreSQL - Flexible Server customers have faced the challenge of not being able to terminate the process securely with more granular control over the autovacuum process. If the autovacuum process is triggered simultaneously with a business-critical DDL process and users do not have controlled access on this process, it can lead to frustrating experience. In our latest release, we have implemented a solution that is secure, backward-compatible, and easy to integrate. New role pg_signal_autovacuum_worker We addressed this challenge by backporting the ‘pg_signal_autovacuum_worker’ role (which will be introduced in PostgreSQL 18) to all Azure Database for PostgreSQL flexible server versions 15 and higher. The ‘pg_signal_autovacuum_worker’ role helps you manage autovacuum tasks more effectively and allows non-superusers to terminate the autovacuum processes. Users get controlled access for the autovacuum process with this new role. Advantages of backporting the pg_signal_autovacuum_worker role Backporting the 'pg_signal_autovacuum_worker' role has some important advantages: Compatibility: Backporting this role to previous versions ensures a seamless upgrade experience for existing PostgreSQL servers. Security: Users do not have access to this role by default. The role is granted to non-superusers without granting broader system-level access. It gives a more granular and secure way to manage autovacuum processes without compromising database integrity. Steps to add pg_signal_autovacuum_worker role 1. Let's create a new user using the below command: CREATE USER john WITH PASSWORD 'Pass123'; 2. Next, grant 'pg_signal_autovacuum_worker' role to the newly created user GRANT pg_signal_autovacuum_worker TO john; 3. Now, confirm if 'pg_signal_autovacuum_worker' role is assigned SELECT oid, rolname FROM pg_roles WHERE Pg_has_role('john', oid, 'member'); oid | rolname -------+----------------------------- 8916 | pg_signal_autovacuum_worker 24826 | john 4. Now 'john' without being a member of 'azure_superuser' can terminate the autovacuum process. SELECT Pg_terminate_backend(pid) FROM pg_stat_activity WHERE backend_type = 'autovacuum worker'; Conclusion Managing autovacuum processes has always been tricky, especially for non-superusers who couldn’t directly control them in a managed service environment. Now with the introduction of the 'pg_signal_autovacuum_worker' role available in Azure Database for PostgreSQL flexible server, this is possible. Database users have a secure and flexible way to manage autovacuum process without needing superuser access, making database maintenance easier and more efficient.1.2KViews7likes4Comments