azure data factory
405 TopicsSQL Data Sync Is Retiring: How to Choose the Right Replacement
SQL Data Sync has a retirement date. Your synchronization requirements don't. Data Sync will be retired on 30 September 2027. Most teams already know they have to move off it. What they're less sure about is which replacement will keep the behavior their application relies on. Microsoft lists several alternatives, including Azure Data Factory, Azure Functions, transactional replication, active geo-replication, read replicas and Fabric mirroring. They all move data, but they solve very different problems, so none of them is a drop-in replacement. This post walks through a requirements-first way to choose. What's changing Data Sync synchronizes the tables you select between Azure SQL Database and SQL Server databases, in both directions. Customers mostly use it for three things: Hybrid sync between SQL Server and Azure SQL Database Reporting copies, which move read workloads to another database Globally distributed reads, with copies of the data in other regions As the retirement gets closer, you may find that some operations, such as creating new sync groups, are blocked. That's expected as part of the retirement, not a provisioning fault, so start planning the move rather than troubleshooting the error. Step 1: Take inventory You can't choose a replacement until you know what you have. For each sync group, record its hub, its members, and the tables and columns it syncs. You can list sync groups in the portal or with PowerShell: Get-AzSqlSyncGroup -ResourceGroupName "<rg>" -ServerName "<server>" -DatabaseName "<hub-db>" Get-AzSqlSyncMember -ResourceGroupName "<rg>" -ServerName "<server>" -DatabaseName "<hub-db>" -SyncGroupName "<group>" Data Sync also adds tracking triggers and metadata to every database in the group. To see where it's present: SELECT OBJECT_SCHEMA_NAME(parent_id) AS schema_name, OBJECT_NAME(parent_id) AS table_name, name AS trigger_name FROM sys.triggers WHERE name LIKE '%[_]dss[_]%'; SELECT name FROM sys.tables WHERE schema_id = SCHEMA_ID('DataSync'); Next, find out who actually uses the synced data. Check the reports, jobs and applications that read from each member. That will tell you how much latency and drift you can accept. Step 2: Classify each workload Fill in this worksheet once per sync group: Question Example answer Source platform SQL Server 2019 on-premises Destination platform Azure SQL Database Direction One-way / bidirectional Is the destination written to? Read-only / writable Acceptable latency Seconds / minutes / hours Conflict handling needed? None / last-writer-wins / custom Daily change volume ~2 million rows Recovery expectation Resume from last point / full reload acceptable Your answers to direction and writable destination will rule out most of the options straight away. Step 3: Use the requirements to rule options out Requirement Rules out Still in play Bidirectional, both sides writable Geo-replication, read replicas, transactional replication (standard), Fabric mirroring Redesign to a single writer, or a custom solution (ADF / Functions) with your own conflict logic Read-only copy in the same database Everything heavier than needed Read scale-out (read replicas) Read-only copy in another region Read scale-out Active geo-replication, ADF incremental copy SQL Server → Azure SQL Database, near real time ADF batch schedules (if latency is tight) Transactional replication (Azure SQL Database as push subscriber) Azure SQL Database as the source of replication Transactional replication (Azure SQL Database can't be a publisher) ADF, Azure Functions, geo-replication Subset of tables or columns, with transformation Geo-replication, read replicas (whole database only) ADF, Azure Functions Analytics in Fabric – Fabric mirroring One point catches people out: active geo-replication and read replicas are not general-purpose sync. They give you a read-only copy of the whole database. You can't write to the secondary, and you can't pick tables. Bidirectional sync is the hardest case. No managed service replaces it directly. Before you build custom two-way sync, check whether the application really needs to write in two places. Moving to a single writer is often simpler and more reliable. Step 4: One-way incremental copy example For many reporting workloads, one-way incremental sync is all you need. Change tracking keeps it cheap. Run this on the source: ALTER DATABASE CURRENT SET CHANGE_TRACKING = ON (CHANGE_RETENTION = 7 DAYS, AUTO_CLEANUP = ON); ALTER TABLE dbo.Orders ENABLE CHANGE_TRACKING; On each run, pull only the rows that changed since the last version you stored: DECLARE @last bigint = (SELECT LastVersion FROM dbo.SyncWatermark WHERE TableName = 'dbo.Orders'); DECLARE @current bigint = CHANGE_TRACKING_CURRENT_VERSION(); IF @last < CHANGE_TRACKING_MIN_VALID_VERSION(OBJECT_ID('dbo.Orders')) THROW 50001, 'Watermark is older than retention. Full reload required.', 1; SELECT ct.SYS_CHANGE_OPERATION, ct.OrderId, o.* FROM CHANGETABLE(CHANGES dbo.Orders, @last) AS ct LEFT JOIN dbo.Orders AS o ON o.OrderId = ct.OrderId; -- After the destination applies the batch successfully: UPDATE dbo.SyncWatermark SET LastVersion = @current WHERE TableName = 'dbo.Orders'; You can run this from an ADF pipeline or an Azure Function. If a table has a reliable ModifiedDate column and you don't need to track deletes, a timestamp watermark also works. Compare that with a bidirectional requirement. There, you'd also have to detect when both sides changed the same row, choose a winner, and prevent your own writes from echoing back. That's a lot more to build and test, which is why it's worth confirming you really need it. Step 5: Pilot, run both, then validate Don't switch over in one go. Run the new pipeline alongside Data Sync for a while and compare the results. Row counts: SELECT COUNT_BIG(*) AS row_count FROM dbo.Orders; A quick content check (run it on both sides and compare). Checksums can collide, so treat a match as a strong signal rather than proof: SELECT CHECKSUM_AGG(BINARY_CHECKSUM(*)) AS table_checksum FROM dbo.Orders; Latency: SELECT DATEDIFF(SECOND, MAX(ModifiedDate), SYSUTCDATETIME()) AS seconds_behind FROM dbo.Orders; Also test recovery. Stop the pipeline for longer than your normal interval, start it again, and confirm it catches up without losing or duplicating rows. Step 6: Decommission Data Sync cleanly Once the new path has been stable through your validation period: Delete the sync group. This stops sync and removes the group's configuration. Uninstall the Data Sync agent from any on-premises SQL Server hosts. Check that the _dss_ triggers and DataSync schema objects are gone from every member. If any are left, drop them in a maintenance window, because leftover triggers add overhead to every write. Remove firewall rules and credentials that only Data Sync used. Migration checklist All sync groups and members inventoried Worksheet completed for each workload Bidirectional needs confirmed or designed out Replacement chosen using the decision table Pilot running in parallel with Data Sync Row count, checksum, latency and recovery checks passed Consumers switched to the new path Sync groups deleted, agents removed, metadata cleaned up Finished well before 30 September 2027 Final thought Turning off Data Sync is the easy part. The real work is understanding what your application expects from it today. Start with the requirements, and the right replacement usually becomes obvious. Reference: SQL Data Sync retirement migration - Azure SQL Database | Microsoft Learn
Microsoft Integration Runtime Download 5.68.9705.1
There is a new Runtime version, 5.68.9705, released today, however it looks like the release notes are protected and can not be opened once downloaded: https://www.microsoft.com/en-gb/download/details.aspx?id=39717&msockid=3edfc848eac467411552dd76ebf56680650Views0likes6Comments
Migrating ~100 SSIS Packages to Azure: Acceleration Strategies & ADF vs. Fabric Guidance
Hi everyone, Our team is currently planning to migrate approximately 100 SSIS packages (including several large and highly complex workflows) to Azure. We are evaluating two primary paths: a lift-and-shift using Azure Data Factory (ADF) SSIS Integration Runtime (SSIS-IR) vs. a full rewrite. Current Architecture / Tech Stack: Azure, VMs, Azure SQL Managed Instance (SQL MI) We would appreciate insights on the following: Accelerated Rewrite Options: If we decide to rewrite, are there automation tools, frameworks, or best practices to expedite the transition rather than manually rebuilding every activity in ADF? ADF vs. Microsoft Fabric: Given Microsoft’s strategic push toward Fabric, is ADF still the ideal migration target, or should we consider targeting Fabric Data Pipelines directly? Thank you in advance for any inputs, advice, or shared experiences!495Views0likes2CommentsAzure Data Factory: How do you handle late-arriving records in incremental loads?
I am looking at approaches for implementing incremental loads in Azure Data Factory when records can arrive late or existing records can be updated after the initial load. A watermark based on a source timestamp works for many scenarios, but a strict timestamp > last_watermark filter can miss records if multiple rows share the same timestamp or if updates arrive outside the expected window. For a reliable pipeline, would you recommend: Using an overlapping extraction window and deduplicating records in the target? Tracking a source-specific change version or change tracking mechanism? Using a combination of a watermark and periodic reconciliation? The source is a relational database, and the target needs to remain consistent without reloading the entire dataset every time. What approach would you recommend, and what edge cases should be considered when implementing this in Azure Data Factory?102Views0likes2CommentsThe Pipeline Is Slow, or Is SQL Waiting? Diagnosing Synapse-to-Azure SQL Regressions
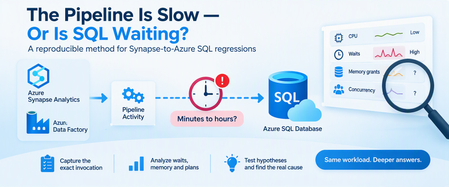
A query can consume very little CPU and still keep a pipeline waiting for hours. A pipeline activity that normally finishes in minutes suddenly starts taking hours. Nothing obvious has changed: The pipeline definition looks the same. The stored procedure looks the same. Azure SQL Database isn't showing sustained high CPU. Pipeline monitoring still points toward the SQL activity. At this point, saying "SQL is slow" isn't enough. The request may actually be: Executing expensive work. Waiting for memory. Blocked by another transaction. Reading more data than before. Running with a different execution plan. Competing with concurrent pipeline activities. Experiencing different cardinality because of different parameter values. The key is to connect the pipeline invocation to the database execution and determine where elapsed time is really going. 1. Define the Regression Precisely Before troubleshooting SQL, establish what actually changed. Capture: Expected pipeline duration. Observed pipeline duration. Pipeline activity involved. Stored procedure or statement invoked. Exact parameter values. Affected and unaffected executions. Pipeline concurrency. Retry behavior. Connection and command timeout. Deployment or configuration changes. For example: Evidence Baseline Regression Pipeline duration Minutes Much longer Stored procedure Same Same Parameter range A B Concurrent activities Low Higher Azure SQL CPU Normal Normal/moderate SQL wait behavior Unknown To investigate The most important rule is: Don't assume the SQL workload is identical simply because the stored procedure is identical. Different parameters can result in dramatically different: Row counts. Join choices. Memory grants. Sort requirements. Execution plans. Total duration. 2. Preserve the Exact Invocation One of the easiest ways to lose a performance regression is to reproduce it with different parameters. Capture the invocation before testing: Procedure name. Parameter values. Date range. Entity or partition identifier. Batch size. Pipeline run ID. Retry number. Number of parallel activities. Relevant timeout configuration. Then sanitize any business-sensitive values before sharing them outside your organization. The diagnostic principle is simple: Reproduce the same workload before trying to improve the workload. 3. Reproduce Safely Whenever possible, reproduce the issue using: A nonproduction database containing representative data. A controlled production troubleshooting window. The same stored procedure. The same parameter pattern. Comparable concurrency. For a controlled test, SQL execution statistics can help: SET STATISTICS IO ON; SET STATISTICS TIME ON; EXEC dbo.SampleProcedure @StartDate = '2026-01-01', @EndDate = '2026-01-31', @EntityID = 100; SET STATISTICS TIME OFF; SET STATISTICS IO OFF; Replace these synthetic names and values with the sanitized equivalent of the invocation you're investigating. Capture: Elapsed time. CPU time. Logical reads. Physical reads when relevant. Execution plan. Returned row count. The goal isn't simply to reproduce "slow." The goal is to understand why it is slow. 4. First Question: Is SQL Running or Waiting? This distinction changes the entire investigation. During the slow execution, examine the active request. SELECT r.session_id, r.request_id, r.status, r.command, r.start_time, r.cpu_time, r.total_elapsed_time, r.wait_type, r.wait_time, r.last_wait_type, r.wait_resource, r.blocking_session_id, r.reads, r.writes, r.logical_reads, r.row_count FROM sys.dm_exec_requests AS r WHERE r.database_id = DB_ID() ORDER BY r.total_elapsed_time DESC; sys.dm_exec_requests is supported for Azure SQL Database and exposes information about currently executing requests. Pay particular attention to the relationship between: cpu_time and: total_elapsed_time Suppose a request has: Very high elapsed time. Relatively little accumulated CPU time. A significant current wait. That's a strong reason to investigate waiting, rather than immediately treating the problem as insufficient CPU. Conversely: High elapsed time. High accumulated CPU. High logical reads. points more strongly toward expensive execution. 5. Identify Blocking Another request may be preventing the pipeline's SQL request from progressing. Start with: SELECT session_id, status, wait_type, wait_time, wait_resource, blocking_session_id, cpu_time, total_elapsed_time FROM sys.dm_exec_requests WHERE blocking_session_id <> 0 ORDER BY wait_time DESC; Blocking can explain a scenario where: Pipeline duration increases dramatically. Database CPU remains moderate. The SQL activity appears "active" for a long time. Microsoft documents sys.dm_exec_requests as one of the tools for identifying requests suspended on lock-related waits and tracing blocking behavior in Azure SQL Database. Don't confuse: "The SQL call took two hours." with: "SQL executed for two hours." Those statements aren't necessarily equivalent. 6. Look at the SQL That's Actually Running During an active incident, retrieve the request and its current SQL text: SELECT r.session_id, r.status, r.command, r.cpu_time, r.total_elapsed_time, r.wait_type, r.blocking_session_id, r.logical_reads, txt.text AS batch_text FROM sys.dm_exec_requests AS r CROSS APPLY sys.dm_exec_sql_text(r.sql_handle) AS txt WHERE r.database_id = DB_ID() ORDER BY r.total_elapsed_time DESC; sys.dm_exec_sql_text accepts the sql_handle exposed by sys.dm_exec_requests and returns the associated SQL batch text. This helps validate an important cross-service question: Is the database executing the statement we think the pipeline invoked? 7. Investigate Memory Grants Some operations need execution memory before they can proceed efficiently. Common examples include: Sorts. Hash joins. Hash aggregates. Some index operations. sys.dm_exec_query_memory_grants exposes queries that: Requested a memory grant and received one. Requested a memory grant and are still waiting. It is supported for Azure SQL Database. SELECT mg.session_id, mg.request_id, mg.dop, mg.request_time, mg.grant_time, mg.requested_memory_kb, mg.granted_memory_kb, mg.required_memory_kb, mg.used_memory_kb, mg.max_used_memory_kb, mg.query_cost, mg.timeout_sec, mg.resource_semaphore_id FROM sys.dm_exec_query_memory_grants AS mg ORDER BY mg.requested_memory_kb DESC; Interpret the important columns carefully: requested_memory_kb Memory requested by the query. granted_memory_kb Memory actually granted. required_memory_kb Minimum memory required for execution. used_memory_kb Memory currently being used. max_used_memory_kb Maximum used so far. grant_time NULL when the requested grant hasn't yet been granted. Microsoft specifically documents that queries waiting for memory grants appear in this DMV, and that grant_time remains NULL until the grant is provided. 8. Find Waiting Memory Grants During the active regression, focus specifically on requests that haven't received their grants: SELECT mg.session_id, mg.request_id, mg.request_time, mg.grant_time, mg.requested_memory_kb, mg.required_memory_kb, mg.granted_memory_kb, mg.timeout_sec, mg.dop, mg.query_cost FROM sys.dm_exec_query_memory_grants AS mg WHERE mg.grant_time IS NULL ORDER BY mg.request_time; If the affected session repeatedly appears here, you now have meaningful evidence supporting a memory-grant contention hypothesis. But that's still not enough to state: "Memory grants caused the pipeline regression." You should also establish: Whether the waiting session is actually the pipeline request. How long it remained waiting. Whether other statements were consuming large grants. Whether concurrency changed. Whether the execution plan requested unusually large memory. Why the query requested that amount of memory. That last question is particularly important. Memory-grant problems can be downstream symptoms of: Poor cardinality estimates. Large sorts. Large hash joins. Plan changes. Data growth. Parameter sensitivity. Microsoft's memory-grant troubleshooting guidance emphasizes that operations such as sorts and hash operations can require execution-memory reservations and that these grants exist for the lifetime of the query. Memory-grant contention is a diagnostic hypothesis until the evidence supports causality. 9. Pipeline Concurrency Is Database Concurrency This connection is easy to overlook. Suppose one stored-procedure invocation performs acceptably. Now imagine the orchestration layer starts: 2 copies concurrently. 5 copies concurrently. 10 copies concurrently. 20 copies concurrently. Each execution may individually be reasonable. Together, they can compete for: CPU. Workers. Memory grants. Buffer pool resources. I/O. Locks. This means: A pipeline concurrency change is also a database workload change. Even when: SQL code hasn't changed. Database configuration hasn't changed. Stored procedure code hasn't changed. As part of troubleshooting, compare: Single-execution performance. Typical production concurrency. Regression-period concurrency. Temporarily reducing pipeline concurrency can also be a valuable diagnostic experiment, provided the change is safe for the workload. 10. Capture the Live Execution Plan For a request that's still executing, Azure SQL Database supports sys.dm_exec_query_statistics_xml(), which returns Showplan XML containing transient execution statistics for an in-flight request. First identify the target session: SELECT session_id, request_id, status, command, cpu_time, total_elapsed_time, wait_type, logical_reads FROM sys.dm_exec_requests WHERE database_id = DB_ID() ORDER BY total_elapsed_time DESC; Then, for a known session: DECLARE @SessionID smallint = 123; SELECT qsx.session_id, qsx.request_id, qsx.query_plan FROM sys.dm_exec_query_statistics_xml(@SessionID) AS qsx; Replace 123 with the session being investigated. The live plan can help answer: Which operator is consuming time? How many rows are flowing through operators? Are estimates diverging significantly from runtime behavior? Are large joins or sorts involved? Where does execution appear to be spending time? Microsoft describes access to execution-plan runtime information as particularly useful when investigating long-running queries, because the information can be inspected without waiting for the query to finish. Use live-plan collection purposefully, especially on heavily loaded production systems. 11. Compare Historical Behavior in Query Store A live snapshot explains what's happening now. Query Store helps answer: What was happening when the query used to be fast? For example, find queries with multiple retained Query Store plans: SELECT TOP (50) q.query_id, COUNT(DISTINCT p.plan_id) AS plan_count, COUNT(DISTINCT p.query_plan_hash) AS distinct_plan_shapes, MIN(p.first_execution_time) AS first_plan_execution, MAX(p.last_execution_time) AS last_plan_execution FROM sys.query_store_query AS q JOIN sys.query_store_plan AS p ON q.query_id = p.query_id GROUP BY q.query_id HAVING COUNT(DISTINCT p.plan_id) > 1 ORDER BY plan_count DESC; Multiple plans aren't automatically evidence of a problem. Instead, investigate whether plan changes correlate with: Pipeline regressions. Duration changes. CPU changes. Logical-read changes. Memory behavior. Different parameter populations. 12. Compare Runtime Distributions, Not Just Averages Averages can hide regression patterns. Consider: Most executions take 10 seconds. A few take 45 minutes. The average won't fully describe the operational impact. For a known Query Store query_id, compare plans and runtime intervals: DECLARE @QueryID bigint = 123; SELECT p.plan_id, rsi.start_time, rsi.end_time, SUM(rs.count_executions) AS execution_count, CAST(AVG(rs.avg_duration) / 1000.0 AS decimal(18,2)) AS avg_duration_ms, CAST(MAX(rs.max_duration) / 1000.0 AS decimal(18,2)) AS max_duration_ms, CAST(AVG(rs.avg_cpu_time) / 1000.0 AS decimal(18,2)) AS avg_cpu_ms, CAST(AVG(rs.avg_logical_io_reads) AS decimal(18,2)) AS avg_logical_reads FROM sys.query_store_query AS q JOIN sys.query_store_plan AS p ON q.query_id = p.query_id JOIN sys.query_store_runtime_stats AS rs ON p.plan_id = rs.plan_id JOIN sys.query_store_runtime_stats_interval AS rsi ON rs.runtime_stats_interval_id = rsi.runtime_stats_interval_id WHERE q.query_id = @QueryID GROUP BY p.plan_id, rsi.start_time, rsi.end_time ORDER BY rsi.start_time DESC, p.plan_id; Replace 123 with the Query Store ID being investigated. Compare: Fast periods. Slow periods. Plans. Execution counts. CPU. Duration. Logical reads. This often produces a better picture than looking at lifetime averages. 13. Don't Force the Fastest Historical Plan Yet Suppose Query Store shows: Plan A took 30 seconds. Plan B takes 20 minutes. It might be tempting to immediately force Plan A. But first ask: How many times did Plan A execute? Which parameters used Plan A? Was the data distribution comparable? Was workload concurrency comparable? Did Plan A perform well repeatedly? Is the query parameter sensitive? A plan that was excellent for one parameter combination might be disastrous for another. The goal isn't to find the lowest historical duration. The goal is to find the plan behavior that's safe for the intended workload. If plan forcing is tested, define rollback criteria before deployment. 14. Test One Hypothesis at a Time Avoid simultaneously changing: Statistics. Indexes. Query code. Pipeline concurrency. Plan forcing. Compute tier. Doing everything together may improve performance, but you'll learn very little about why. Instead: Hypothesis: stale or inaccurate statistics Test: Appropriate statistics maintenance. Same parameters. Same concurrency. Then measure again. Hypothesis: memory-grant contention Test safely with: Reduced concurrency. Same parameter set. Same procedure. Same database configuration. Then compare: Grant wait behavior. Elapsed time. CPU time. Query plan. Hypothesis: plan regression Compare: Historical plans. Representative parameters. Runtime distributions. Only then evaluate targeted plan intervention. Hypothesis: poor cardinality Look for: Estimate-to-actual row differences. Parameter sensitivity. Implicit conversions. Sort/hash behavior. Excessive memory requests. This approach turns troubleshooting from guesswork into experimentation. 15. Correlation Is Not Root Cause This is perhaps the most important principle in cross-service troubleshooting. Suppose you see: A slow pipeline. A SQL memory-grant wait. Several concurrent activities. Those facts are correlated. They don't yet prove: "Memory contention caused the pipeline regression." A stronger conclusion requires a causal chain such as: The pipeline invokes the identified SQL request. That request repeatedly waits for execution memory during the regression. Competing queries hold substantial memory grants during the same period. Reducing the competing concurrency removes or materially reduces the grant wait. The same SQL invocation then returns toward its normal runtime. Repeating the workload reproduces the relationship. Now the evidence for causality is much stronger. This distinction matters because Azure SQL memory pressure can arise from several sources, including the chosen service objective, aggregate workload demand, and individual query memory demand. 16. Build a Cross-Service Evidence Package For difficult Synapse or Data Factory to Azure SQL regressions, both teams should be able to work from the same timeline. Capture: Pipeline evidence Pipeline run ID. Activity name. Activity start and end times. Sanitized parameters. Retry count. Timeout. Concurrent activities. Azure SQL evidence Session/request identification when captured live. Query Store query_id. Query Store plan_id. Runtime intervals. CPU time. Elapsed time. Logical reads. Wait type. Blocking session. Memory grant information. Execution plan. Investigation evidence Separate everything into: Facts Pipeline execution took longer than baseline. SQL request was identified. Request waited for memory. Multiple pipeline activities overlapped. A different plan appeared during the regression. Hypotheses Pipeline concurrency created memory-grant contention. Cardinality changes increased the requested memory grant. Parameter sensitivity caused a plan regression. Blocking contributed to runtime. Resource contention amplified an otherwise acceptable query. Experiments Document: What changed. Why it changed. Test duration. Result. Whether the hypothesis was strengthened or weakened. This prevents the pipeline and database teams from investigating two different incidents that simply happened at the same time. A Practical Decision Tree When a Synapse or Data Factory pipeline's Azure SQL activity suddenly becomes slow: 1. Can you identify the exact invocation? No Capture it before continuing. Yes Reproduce with equivalent parameters and concurrency. 2. Is SQL consuming significant CPU? Yes Investigate: Execution plan. Logical reads. Cardinality. Indexing. Parameter sensitivity. No Look at waits. 3. Is the request blocked? Yes Investigate: Blocking session. Transaction duration. Locking pattern. No Continue. 4. Is the request waiting for a memory grant? Yes Investigate: Requested versus granted memory. Other active grants. Sorts and hash operations. Cardinality estimates. Pipeline concurrency. No Investigate the actual current wait. 5. Did the execution plan change? Yes Compare: Runtime distributions. Parameter sets. CPU. Reads. Memory requirements. No Continue correlating waits, workload volume, and concurrency. 6. Does reducing concurrency improve the same invocation? Yes Resource competition becomes a stronger hypothesis. No Continue investigating query-specific behavior. Final Takeaway When a pipeline goes from minutes to hours, the fact that the Azure SQL activity is taking a long time doesn't automatically mean Azure SQL is spending all that time executing. The request might be spending much of its lifetime: Waiting for memory. Waiting behind another transaction. Waiting for another resource. Executing with a different plan. Processing a different parameter population. Competing with concurrent pipeline activities. A reliable investigation connects two perspectives: Pipeline context What exactly was invoked? With which parameters? At what time? At what concurrency? Database context Was the SQL request executing or waiting? How much CPU did it actually consume? What was it waiting for? Which plan did it use? How much memory did it request? What else was happening concurrently? sys.dm_exec_requests can identify active requests and their current execution state, while sys.dm_exec_query_memory_grants exposes statements that have requested or received execution memory. Azure SQL Database also supports obtaining transient plan information for in-flight requests through sys.dm_exec_query_statistics_xml(). Most importantly: Treat waits, memory grants, plan changes, and concurrency as evidence to test, not automatic root causes. That is how "the pipeline is slow" becomes a reproducible, evidence-backed performance diagnosis.172Views0likes0CommentsEngineering an Azure Data Layer for Odoo Analytics Without Changing the ERP
One thing I have learned from working on ERP-driven data projects is that the ERP is rarely the place where you want to solve every analytics problem. We saw this firsthand in a manufacturing engagement where Odoo was being used across finance, inventory, procurement, and manufacturing, but reporting still involved substantial manual extraction and Excel-based consolidation. The interesting engineering question wasn't “How do we replace the ERP?” It was: “How do we build a reliable analytical layer around it without changing the transactional system?” That shaped the architecture. We used Odoo APIs and Azure Data Factory for ingestion, landing the data in Azure Data Lake Storage Gen2. From there, the data was organized into Bronze, Silver, and Gold layers: Bronze: Source-aligned Odoo data was retained with minimal transformation. Silver: Data was cleansed, standardized, and prepared across finance, inventory, procurement, and manufacturing domains. Gold: Analytics-ready data was prepared for downstream reporting and consumption. Azure Databricks with Spark handled transformation and KPI standardization, while Synapse/SQL layers provided structured analytical models for reporting. Power BI datasets consumed the prepared data, with Row-Level Security applied for role-based access. Why did this separation matter for the project? The important architectural boundary was: Odoo → transactional operations Azure data platform → ingestion, storage, transformation, standardization Power BI → analytical consumption That separation meant the reporting layer did not have to repeatedly extract and reshape data directly from the ERP. It also gave us a dedicated place to handle historical data and standardize information across business domains before it reached the reporting layer. What changed? The implementation automated 15+ Odoo-based reports and provided governed Power BI dashboards to 60+ business users. More importantly, teams moved away from repeated ERP extraction and spreadsheet consolidation toward a reusable analytical data layer. For our team, the bigger takeaway was that ERP modernization does not necessarily mean modifying the ERP. For teams building Azure data platforms around ERP systems, how are you drawing the boundary between API ingestion, historical storage, transformation, and analytical modeling?180Views0likes0Comments
OData Connector for Dynamics Business Central
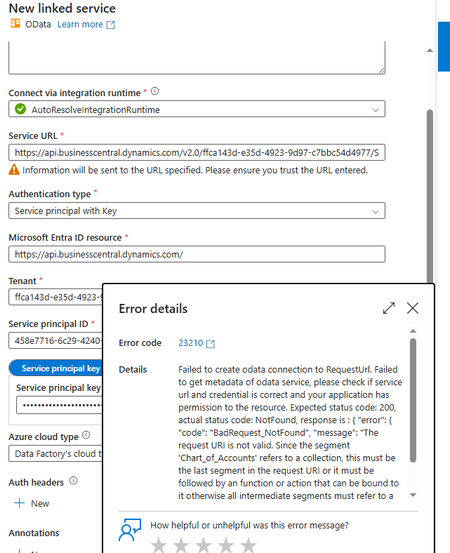
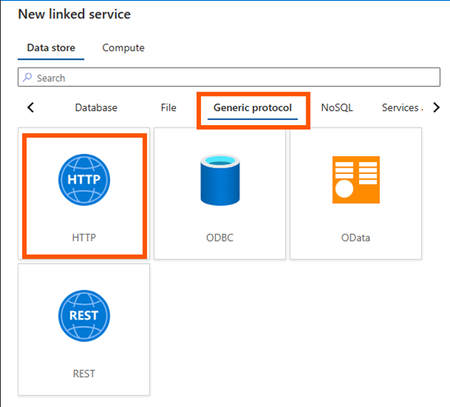
Hey Guys, I'm trying to connect Dynamics Business Central OData API in ADF but I'm not sure what I'm doing wrong here because the same Endpoint is returning data on Postman but returning an error in ADF LinkedService. https://api.businesscentral.dynamics.com/v2.0/{tenant-id}/Sandbox-UAT/ODataV4/Company('company-name')/Chart_of_Accounts899Views1like2Comments
ADF - REST API Copy Data Activity - Best Practices
Hey everyone, I'm relatively new to Azure and am using Azure Data Factory (ADF) to extract data from Vonigo via their API. Everything is working, but I'm looking for ways to improve efficiency. Right now it takes 30+ minutes to pull all franchise data for a given report. The challenge is that Vonigo only allows reports to be run for one franchise at a time, and switching franchises requires a separate API call. My current process is: Select a franchise from a list Run all required reports for that franchise Save the results to Blob Storage Move to the next franchise and repeat (We'll eventually ingest the files into our silver layer for transformation.) Speed Issue One thing that significantly slows the pipeline down is that many activities are running sequentially. If I disable sequential execution, I've seen cases where data gets written to the wrong destination or associated with the wrong franchise. Has anyone successfully parallelized a similar process while maintaining data integrity? Are there specific points in the workflow where parallel execution would be safe? Pagination / Loop Issue Originally, I used a Lookup activity to inspect the most recently created file. An If activity would then determine whether the file contained any records: If records existed, increment the page number and continue. If no records existed, end the loop. This worked, but the Lookup activity added noticeable overhead. To improve performance, I changed the logic to use the Copy Activity output instead. Specifically, I'm checking the amount of data read from the last API call. Pages with no records appear to consistently return the same data-read value, so I use that to determine when to stop paging. This approach is much faster, but it feels more fragile since it's relying on an indirect indicator rather than the actual record count. Would you trust the Copy Activity output in this scenario, stick with the Lookup approach, or recommend a different pattern altogether? Thanks for any suggestions.810Views0likes6Comments
Azure Data Factory ForEach Loop Fails Despite Inner Activity Error Handling - Seeking Best Practices
Hello Azure Data Factory Community, I'm encountering a persistent issue with my ADF pipeline where a ForEach loop is failing, even though I've implemented error handling for the inner activities. I'm looking for insights and best practices on how to prevent internal activity failures from propagating up and causing the entire ForEach loop (and subsequently the pipeline) to fail, while still logging all outcomes. My Setup: My pipeline processes records using a ForEach loop. Inside the loop, I have a Web activity (Sample_put_record) that calls an external API. This API call can either succeed or fail for individual records. My current error handling within the ForEach iteration is structured as follows: 1.Sample_put_record (Web Activity): Makes the API call. 2.Conditional Logic: I've tried two main approaches: •Approach A (Direct Success/Failure Paths): The Sample_put_record activity has a green arrow (on success) leading to a Log Success Items (Script activity) and a red arrow (on failure) leading to a Log Failed Items (Script activity). Both logging activities are followed by Wait activities (Dummy Wait For Success/Failure). •Approach B (If Condition Wrapper): I've wrapped the Sample_put_record activity and its success/failure logging within an If Condition activity. The If Condition's expression is @equals(activity('Sample_put_record').status, 'Succeeded'). The True branch contains the success logging, and the False branch contains the failure logging. The intention here was for the If Condition to always report success, regardless of the Sample_put_record outcome, to prevent the ForEach from failing. The Problem: Despite these error handling attempts, the ForEach loop (and thus the overall pipeline) still fails when an Sample_put_record activity fails. The error message I typically see for the ForEach activity is "Activity failed because an inner activity failed." When using the If Condition wrapper, the If Condition itself sometimes fails with the same error, indicating that an activity within its True or False branch is still causing a hard failure. For example, a common failure for Sample_put_record is: "valid":false,"message":"WARNING: There was no xxxxxxxxxxxxxxxxxxxxxxxxx scheduled..." (a user configuration/data issue). Even when my Log Failed Items script attempts to capture this, the ForEach still breaks. What I've Ensured/Considered: •Wait Activity Configuration: Wait activities are configured with reasonable durations and do not appear to be the direct cause of failure. •No Unhandled Exceptions: I'm trying to ensure no unhandled exceptions are propagating from my error handling activities. •Pipeline Status Goal: My ultimate goal is for the overall pipeline status to be Succeeded as long as the pipeline completes its execution, even if some Sample_put_record calls fail and are logged. I need to rely on the logs to identify actual failures, not the pipeline status. My Questions to the Community: 1.What is the definitive best practice in Azure Data Factory to ensure a ForEach loop never fails due to an inner activity failure, assuming the inner activity's failure is properly logged and handled within that iteration? 2.Are there specific nuances or common pitfalls with If Condition activities or Script activities within ForEach loops that could still cause failure propagation, even with try-catch and success exits? 3.How do you typically structure your ADF pipelines to achieve this level of resilience where internal failures are logged but don't impact the overall pipeline success status? 4.Are there any specific configurations on the ForEach activity itself (e.g., Continue on error setting, if it exists for ForEach?) or other activities that I might be overlooking? Any detailed examples, architectural patterns, or debugging tips would be greatly appreciated. Thank you in advance for your help!805Views0likes1Comment
Copy Data Activity Failed with Unreasonable Cause
It is a simple set up but it has baffled me a lot. I'd like to copy data to a data lake via API. Here are the steps I've taken: Created a HTTP linked service as below: Created a dataset with a HTTP Binary data format as below: Created a pipeline with a Copy Data activity only as shown below: Made sure linked service and dataset all working fine as below: Created a Sink dataset with 3 parameters as shown below: Passed parameters from pipeline to Sink dataset as below: That's all. Simple, right? But the pipeline failed with a clear message "usually this is caused by invalid credentials." as below: Summary: No need to worry about the Sink side of parameters etc. which I have used same thing for years on other pipelines and all succeeded. This time the API failed to reach a data lake from source side as said "invalid credentials". In Step 4 above one could see the linked service and dataset connections were succeeded, ie. credentials have been checked and passed already. How come it failed in data copy activity complaining an invalid credentials? Pretty weird. Any advice and suggestions will be welcomed.521Views0likes1Comment