alerts
130 TopicsYour Sentinel AMA Logs & Queries Are Public by Default - AMPLS Architectures to Fix That
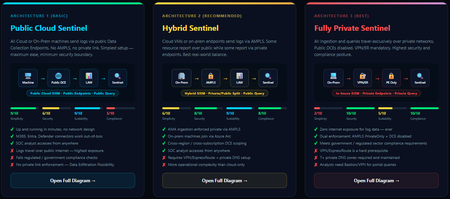
When you deploy Microsoft Sentinel, security log ingestion travels over public Azure Data Collection Endpoints by default. The connection is encrypted, and the data arrives correctly — but the endpoint is publicly reachable, and so is the workspace itself, queryable from any browser on any network. For many organisations, that trade-off is fine. For others — regulated industries, healthcare, financial services, critical infrastructure — it is the exact problem they need to solve. Azure Monitor Private Link Scope (AMPLS) is how you solve it. What AMPLS Actually Does AMPLS is a single Azure resource that wraps your monitoring pipeline and controls two settings: Where logs are allowed to go (ingestion mode: Open or PrivateOnly) Where analysts are allowed to query from (query mode: Open or PrivateOnly) Change those two settings and you fundamentally change the security posture — not as a policy recommendation, but as a hard platform enforcement. Set ingestion to PrivateOnly and the public endpoint stops working. It does not fall back gracefully. It returns an error. That is the point. It is not a firewall rule someone can bypass or a policy someone can override. Control is baked in at the infrastructure level. Three Patterns — One Spectrum There is no universally correct answer. The right architecture depends on your organisation's risk appetite, existing network infrastructure, and how much operational complexity your team can realistically manage. These three patterns cover the full range: Architecture 1 — Open / Public (Basic) No AMPLS. Logs travel to public Data Collection Endpoints over the internet. The workspace is open to queries from anywhere. This is the default — operational in minutes with zero network setup. Cloud service connectors (Microsoft 365, Defender, third-party) work immediately because they are server-side/API/Graph pulls and are unaffected by AMPLS. Azure Monitor Agents and Azure Arc agents handle ingestion from cloud or on-prem machines via public network. Simplicity: 9/10 | Security: 6/10 Good for: Dev environments, teams getting started, low-sensitivity workloads Architecture 2 — Hybrid: Private Ingestion, Open Queries (Recommended for most) AMPLS is in place. Ingestion is locked to PrivateOnly — logs from virtual machines travel through a Private Endpoint inside your own network, never touching a public route. On-premises or hybrid machines connect through Azure Arc over VPN or a dedicated circuit and feed into the same private pipeline. Query access stays open, so analysts can work from anywhere without needing a VPN/Jumpbox to reach the Sentinel portal — the investigation workflow stays flexible, but the log ingestion path is fully ring-fenced. You can also split ingestion mode per DCE if you need some sources public and some private. This is the architecture most organisations land on as their steady state. Simplicity: 6/10 | Security: 8/10 Good for: Organisations with mixed cloud and on-premises estates that need private ingestion without restricting analyst access Architecture 3 — Fully Private (Maximum Control) Infrastructure is essentially identical to Architecture 2 — AMPLS, Private Endpoints, Private DNS zones, VPN or dedicated circuit, Azure Arc for on-premises machines. The single difference: query mode is also set to PrivateOnly. Analysts can only reach Sentinel from inside the private network. VPN or Jumpbox required to access the portal. Both the pipe that carries logs in and the channel analysts use to read them are fully contained within the defined boundary. This is the right choice when your organisation needs to demonstrate — not just claim — that security data never moves outside a defined network perimeter. Simplicity: 2/10 | Security: 10/10 Good for: Organisations with strict data boundary requirements (regulated industries, audit, compliance mandates) Quick Reference — Which Pattern Fits? Scenario Architecture Getting started / low-sensitivity workloads Arch 1 — No network setup, public endpoints accepted Private log ingestion, analysts work anywhere Arch 2 — AMPLS PrivateOnly ingestion, query mode open Both ingestion and queries must be fully private Arch 3 — Same as Arch 2 + query mode set to PrivateOnly One thing all three share: Microsoft 365, Entra ID, and Defender connectors work in every pattern — they are server-side pulls by Sentinel and are not affected by your network posture. Please feel free to reach out if you have any questions regarding the information provided.513Views3likes2Comments
Ingest Microsoft XDR Advanced Hunting Data into Microsoft Sentinel
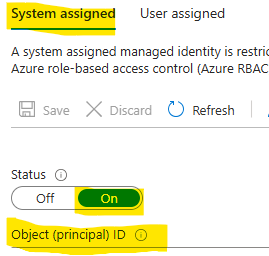
I had difficulty finding a guide that can query Microsoft Defender vulnerability management Advanced Hunting tables in Microsoft Sentinel for alerting and automation. As a result, I put together this guide to demonstrate how to ingest Microsoft XDR Advanced Hunting query results into Microsoft Sentinel using Azure Logic Apps and System‑Assigned Managed Identity. The solution allows you to: Run Advanced Hunting queries on a schedule Collect high‑risk vulnerability data (or other hunting results) Send the results to a Sentinel workspace as custom logs Create alerts and automation rules based on this data This approach avoids credential storage and follows least privilege and managed identity best practices. Prerequisites Before you begin, ensure you have: Microsoft Defender XDR access Microsoft Sentinel deployed Azure Logic Apps permission Application Administrator or higher in Microsoft Entra ID PowerShell with Az modules installed Contributor access to the Sentinel workspace Architecture at a Glance Logic App (Managed Identity) ↓ Microsoft XDR Advanced Hunting API ↓ Logic App ↓ Log Analytics Data Collector API ↓ Microsoft Sentinel (Custom Log) Step 1: Create a Logic App In the Azure Portal, go to Logic Apps Create a new Consumption Logic App Choose the appropriate: Subscription Resource Group Region Step 2: Enable System‑Assigned Managed Identity Open the Logic App Navigate to Settings → Identity Enable System‑assigned managed identity Click Save Note the Object ID This identity will later be granted permission to run Advanced Hunting queries. Step 3: Locate the Logic App in Entra ID Go to Microsoft Entra ID → Enterprise Applications Change filter to All Applications Search for your Logic App name Select the app to confirm it exists Step 4: Grant Advanced Hunting Permissions (PowerShell) Advanced Hunting permissions cannot be assigned via the portal and must be done using PowerShell. Required Permission AdvancedQuery.Read.All PowerShell Script # Your tenant ID (in the Azure portal, under Azure Active Directory > Overview). $TenantID=”Your TenantID” Connect-AzAccount -TenantId $TenantID # Get the ID of the managed identity for the app. $spID = “Your Managed Identity” # Get the service principal for Microsoft Graph by providing the AppID of WindowsDefender ATP $GraphServicePrincipal = Get-AzADServicePrincipal -Filter "AppId eq 'fc780465-2017-40d4-a0c5-307022471b92'" | Select-Object Id # Extract the Advanced query ID. $AppRole = $GraphServicePrincipal.AppRole | ` Where-Object {$_.Value -contains "AdvancedQuery.Read.All"} # If AppRoleID comes up with blank value, it can be replaced with 93489bf5-0fbc-4f2d-b901-33f2fe08ff05 # Now add the permission to the app to read the advanced queries New-AzADServicePrincipalAppRoleAssignment -ServicePrincipalId $spID -ResourceId $GraphServicePrincipal.Id -AppRoleId $AppRole.Id # Or New-AzADServicePrincipalAppRoleAssignment -ServicePrincipalId $spID -ResourceId $GraphServicePrincipal.Id -AppRoleId 93489bf5-0fbc-4f2d-b901-33f2fe08ff05 After successful execution, verify the permission under Enterprise Applications → Permissions. Step 5: Build the Logic App Workflow Open Logic App Designer and create the following flow: Trigger Recurrence (e.g., every 24 hours Run Advanced Hunting Query Connector: Microsoft Defender ATP Authentication: System‑Assigned Managed Identity Action: Run Advanced Hunting Query Sample KQL Query (High‑Risk Vulnerabilities) Send Data to Log Analytics (Sentinel) On Send Data, create a new connection and provide the workspace information where the Sentinel log exists. Obtaining the Workspace Key is not straightforward, we need to retrieve using the PowerShell command. Get-AzOperationalInsightsWorkspaceSharedKey ` -ResourceGroupName "<ResourceGroupName>" ` -Name "<WorkspaceName>" Configuration Details Workspace ID Primary key Log Type (example): XDRVulnerability_CL Request body: Results array from Advanced Hunting Step 6: Run the Logic app to return results In the logic app designer select run, If the run is successful data will be sent to sentinel workspace. Step 7: Validate Data in Microsoft Sentinel In Sentinel, run the query: XDRVulnerability_CL | where TimeGenerated > ago(24h) If data appears, ingestion is successful. Step 8: Create Alerts & Automation Rules Use Sentinel to: Create analytics rules for: CVSS > 9 Exploit available New vulnerabilities in last 24 hours Trigger: Email notifications Incident creation SOAR playbooks Conclusion By combining Logic Apps, Managed Identities, Microsoft XDR, and Microsoft Sentinel, you can create a powerful, secure, and scalable pipeline for ingesting hunting intelligence and triggering proactive detections.331Views2likes1Comment
fooUser appearing in Sentinel device logs
Hi, I noticed from an alert in MS Security Center there is an account called fooUser@<domain> that seems to do a lot of client operations outside of what I understand the account is for, which is Intune enrollment in Autopilot. https://call4cloud.nl/2022/09/foouser-meets-the-cosmic-autopilot-user/ But I'm seeing process creations, file creations etc.. This started the 11th of April on a single device and has since escalated to over a hundred. The first device was actually in an Autopilot process when the events started to get logged, but now there are a lot of machines that have been active for a long time where the logs are coming in from as well. The following query is what I used to find the events in Advanced hunting: search in (DeviceEvents,DeviceFileCertificateInfo,DeviceFileEvents,DeviceImageLoadEvents,DeviceInfo,DeviceLogonEvents,DeviceNetworkEvents,DeviceNetworkInfo,DeviceProcessEvents,DeviceRegistryEvents) "fooUser" | sort by TimeGenerated asc Do anyone else see this behavior?Solved24KViews2likes17Comments
Microsoft Application Protection Incidents
Hi, Seeing a small number of incidents within Sentinel with the Alert product name of 'Microsoft Application Protection'. Can view them in Sentinel but when clicking on the hyper link to be taken to the defender portal I can't access them? Two things, which Defender suite are these alerts coming from? Which roles/permissions are required to view them within the Defender/Unified portal?256Views1like1Comment
Device Tables are not ingesting tables for an orgs workspace
Device Tables are not ingesting tables for an orgs workspace. I can confirm that all devices are enrolled and onboarded to MDE (Microsoft defender for endpoint) I had placed an EICAR file on one of the machine which bought an alert through to sentinel,however this did not invoke any of the device related tables . Workspace i am targeting Workspace from another org with tables enabled and ingesting data Microsoft Defender XDR connector shows as connected however the tables do not seem to be ingesting data; I run the following; DeviceEvents | where TimeGenerated > ago(15m) | top 20 by TimeGenerated DeviceProcessEvents | where TimeGenerated > ago(15m) | top 20 by TimeGenerated I receive no results; No results found from the specified time range Try selecting another time range Please assist As I cannot think where this is failing187Views1like1Comment
Single Rule for No logs receiving (Global + Per-device Thresholds)
Hi everyone, I currently maintain one Analytics rule per table to detect when logs stop coming in. Some tables receive data from multiple sources, each with a different expected interval (for example, some sources send every 10 minutes, others every 30 minutes). In other SIEM platforms there’s usually: A global threshold (e.g., 60 minutes) for all sources. Optional per-device/per-table thresholds that override the global value. Is there a recommended way to implement one global rule that uses a default threshold but allows per-source overrides when a particular device or log table has a different expected frequency? Also, if there are other approaches you use to manage “logs not received” detection, I’d love to hear your suggestions as well. This is a sample of my current rule let threshold = 1h; AzureActivity | summarize LastHeartBeat = max(TimeGenerated) | where LastHeartBeat < ago(threshold)78Views1like0Comments
Sentinel incident playbook - get alert entities
Hi! My main task is to get all alerts (alerts, not incidents) from sentinel (analytics rules and Defender XDR) to external case management. For different reasons we need to do this on alert level. Alert trigger by design works perfectly, but this does not trigger on Defender alerts on Sentinel, only analytic rules. When using Sentinel incident trigger, then i'm not able to extract entities related to alerts, only incident releated entities. Final output is sent with HTTP post to our external system using logic app. Any ideas how to get in logic app all alerts with their entities?824Views1like5Comments
Fetching alerts from Sentinel using logic apps
Hello everyone, I have a requirement to archive alerts from sentinel. To do that I need to do the following: Retrieve the alerts from Sentinel Send the data to an external file share As a solution, I decided to proceed with using logic apps where I will be running a script to automate this process. My questions are the following: -> Which API endpoints in sentinel are relevant to retrieve alerts or to run kql queries to get the needed data. -> I know that I will need some sort of permissions to interact with the API endpoint. What type of service account inside azure should I create and what permissions should I provision to it ? -> Is there any existing examples of logic apps interacting with ms sentinel ? That would be helpful for me as I am new to Azure. Any help is much appreciated !641Views1like4CommentsCan we deploy Bicep through Sentinel repo
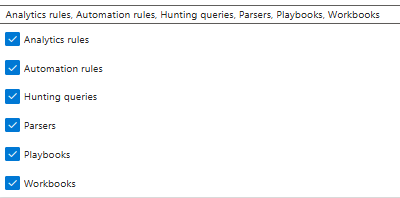
Hi there, Im new here, but 😅.... With the problem statement being "Deploying and managing sentinel infrastructure through git repository. I had looked into Sentinel Repository feature which is still in Preview. With added limitations of not being able to deploy watchlists or custom log analytical functions ( custom parsers ). There is also a limitation of deploying only ARM content My guess would be that the product folks at msft are working on this 😋 My hypothesized (just started the rnd, as of writing this) options would be to Fully go above and beyond with Bicep; Create bicep deployment files for both the rules as well as their dependencies like LAW functions, watchlists and the whole nine yards. Need to write pipelines for the deployment. The CI/CD would also need extra work to implement Hit that sweet spot; Deploy the currently supported resources using sentinel repo and write a pipeline to deploy the watchlists using Bicep. But not sure if this will be relevant to solutions to clients. When the whole shtick is that we are updating now so we dont have to later. Go back to the dark ages: Stick to the currently supported sentinel content through ARM & repo. And deploy the watchlists and dependencies using GUI 🙃 I will soon confirm the first two methods, but may take some time. As you know, I may or may not be new to sentinel...or devops.. But wanted to kick off the conversation, to see how close to being utterly wrong I am. 😎 Thanks, mal_sec107Views1like0Comments