ai agents
196 Topics
Credits usage for Copilot Studio Workflow with agents
If I add an agent(for research and analyze from the JSON provided) in Copilot studio recurring workflow, whose and which credits will be used whenever it runs? Hi Team, I have a question regarding licensing and credit consumption in Copilot Studio. I have created a Copilot Studio agent that performs research and analysis based on a JSON payload. I am planning to invoke this agent from within a Copilot Studio recurring workflow that runs on a schedule. Could you please clarify the following: When the recurring workflow executes and calls the agent, whose credits are consumed? The user who created the workflow? The owner of the agent? The account under which the workflow runs? The environment's pooled credits? Are there separate credit charges for: Workflow execution Agent invocation Generative AI/research actions performed by the agent Any guidance or documentation links explaining the credit consumption model for this scenario would be greatly appreciated. Thank you!98Views0likes2CommentsCopilot Studio agent suddenly stopped working in Teams
Hello, I've run into a strange issue with a Copilot Studio agent and I'm trying to understand where to investigate next. The agent is published to the "Teams and Microsoft 365 Copilot" channel and was working normally in Microsoft Teams until recently. The agent still works correctly in Copilot Studio. The agent still works correctly in Microsoft 365 Copilot / Copilot Chat. The issue only occurs in Microsoft Teams. What happens in Teams: Messages can be sent to the agent. No error message is displayed. No response is returned. Most importantly, no session is created in Copilot Studio (Analytics / Observability). Because no session is created, it looks like the message never reaches the agent runtime. What I've already checked: Republished the agent. Reinstalled the Teams app. Verified the Teams and Microsoft 365 Copilot channel configuration. Checked permissions and sharing settings. Checked Teams Admin Center configuration. Tested in both Teams Desktop and Teams Web. Reviewed Microsoft 365 service health. This same tenant has another Copilot Studio agent that works normally in Teams. The affected agent previously worked in Teams for several weeks before the issue appeared. The agent architecture is very simple (single MCP server, no custom connectors, no Power Automate involved in this scenario). At this point, I'm mainly trying to understand why Teams no longer seems to create a conversation/session for this specific agent while the same agent continues to work in Copilot Studio and Microsoft 365 Copilot. Has anyone seen similar behavior or found a way to diagnose why Teams is no longer forwarding requests to a specific agent ? Thank you for help705Views3likes4Comments
Agent Credit Limits and Alerts - Copilot Studio
Hi everyone, We're evaluating the use of Agent Credit Limits and alert notifications in the Power Platform Admin Center as a way to control unexpected Copilot Credit consumption. Recently, we had an agent consume 668k Copilot Credits in just 3 days, which raised concerns about how quickly usage can grow before administrators become aware of it. My questions are: How frequently is Copilot Credit consumption evaluated against an agent's credit limit? Are alert notifications generated in near real-time, or are they dependent on the same reporting pipeline used by the consumption reports? If an agent reaches its configured credit limit, is it automatically turned off or blocked from further consumption? Given that consumption reports often appear to refresh hours later (or even the next day), can alerts also be delayed? If there is a reporting delay, is there a risk that an agent could significantly exceed the intended limit before administrators receive a notification? What is the recommended approach for preventing large unexpected consumption spikes in production? Has anyone successfully implemented a governance model that provides more immediate protection against runaway usage, or are the current credit limits and alerts primarily intended for retrospective monitoring? Thanks in advance for any guidance.101Views0likes2CommentsJune 2025 Recap: Azure Database for PostgreSQL
Hello Azure Community, We have introduced a range of exciting new features and updates to Azure Database for PostgreSQL in June. From general availability of PG 17 to public preview of the SSD v2 storage tier for High Availability, there have been some significant feature announcements across multiple areas in the last month. Stay tuned as we dive deeper into each of these feature updates. Before that, let’s look at POSETTE 2025 highlights. POSETTE 2025 Highlights We hosted POSETTE: An Event for Postgres 2025 in June! This year marked our 4th annual event featuring 45 speakers and a total of 42 talks. PostgreSQL developers, contributors, and community members came together to share insights on topics covering everything from AI-powered applications to deep dives into PostgreSQL internals. If you missed it, you can catch up by watching the POSETTE livestream sessions. If this conference sounds interesting to you and want to be part of it next year, don’t forget to subscribe to POSETTE news. Feature Highlights General Availability of PostgreSQL 17 with 'In-Place' upgrade support General Availability of Online Migration Migration service support for PostgreSQL 17 Public Preview of SSD v2 High Availability New Region: Indonesia Central VS Code Extension for PostgreSQL enhancements Enhanced role management Ansible collection released for latest REST API version General Availability of PostgreSQL 17 with 'In-Place' upgrade support PostgreSQL 17 is now generally available on Azure Database for PostgreSQL flexible server, bringing key community innovations to your workloads. You’ll see faster vacuum operations, richer JSON processing, smarter query planning (including better join ordering and parallel execution), dynamic logical replication controls, and enhanced security & audit-logging features—backed by Azure’s five-year support policy. You can easily upgrade to PostgreSQL 17 using the in-place major version upgrade feature available through the Azure portal and CLI, without changing server endpoints or reconfiguring applications. The process includes built-in validations and rollback safety to help ensure a smooth and reliable upgrade experience. For more details, read the PostgreSQL 17 release announcement blog. General Availability of Online Migration We're excited to announce that Online Migration is now generally available for the Migration service for Azure Database for PostgreSQL! Online migration minimizes downtime by keeping your source database operational during the migration process, with continuous data synchronization until cut over. This is particularly beneficial for mission-critical applications that require minimal downtime during migration. This milestone brings production-ready online migration capabilities supporting various source environments including on-premises PostgreSQL, Azure VMs, Amazon RDS, Amazon Aurora, and Google Cloud SQL. For detailed information about the capabilities and how to get started, visit our Migration service documentation. Migration service support for PostgreSQL 17 Building on our PostgreSQL 17 general availability announcement, the Migration service for Azure Database for PostgreSQL now fully supports PostgreSQL 17. This means you can seamlessly migrate your existing PostgreSQL instances from various source platforms to Azure Database for PostgreSQL flexible server running PostgreSQL 17. With this support, organizations can take advantage of the latest PostgreSQL 17 features and performance improvements while leveraging our online migration capabilities for minimal downtime transitions. The migration service maintains full compatibility with PostgreSQL 17's enhanced security features, improved query planning, and other community innovations. Public Preview of SSD v2 High Availability We’re excited to announce the public preview High availability (HA) support for the Premium SSD v2 storage tier in Azure Database for PostgreSQL flexible server. This support allows you to enable Zone-Redundant HA using Premium SSD v2 during server deployments. In addition to high availability on SSDv2 you now get improved resiliency when using Premium SSD v2 with zone-redundant HA, helping customers build resilient, high-performance PostgreSQL applications with minimal overhead. This feature is particularly well-suited for mission-critical workloads, including those in financial services, real-time analytics, retail, and multi-tenant SaaS platforms. Key Benefits of Premium SSD v2: Flexible disk sizing: Scale from 32 GiB to 64 TiB in 1-GiB increments Fast failovers: Planned or unplanned failovers typically around 10 seconds Independent performance configuration: Achieve up to 80,000 IOPS and 1,200 Mbps throughput without resizing your disk. Baseline performance: Free throughput of 125 MB/s and 3,000 IOPS for disks up to 399 GiB, and 500 MB/s and 12,000 IOPS for disks 400 GiB and above at no additional cost. For more details, please refer to the Premium SSD v2 HA blog. New Region: Indonesia Central New region rollout! Azure Database for PostgreSQL flexible server is now available in Indonesia Central, giving customers in and around the region lower latency and data residency options. This continues our mission to bring Azure PostgreSQL closer to where you build and run your apps. For the full list of regions visit: Azure Database for PostgreSQL Regions. VS Code Extension for PostgreSQL enhancements The brand-new VS code extension for PostgreSQL launched in mid-May and has already garnered over 122K installs from the Visual Studio Marketplace! And the kickoff blog about this new IDE for PostgreSQL in VS Code has had over 150K views. This extension makes it easier for developers to seamlessly interact with PostgreSQL databases. We have been committed to make this experience better and have introduced several enhancements to improve reliability and compatibility updates. You can now have better control over service restarts and process terminations on supported operating systems. Additionally, we have added support for parsing additional connection-string formats in the “Create Connection” flow, making it more flexible and user-friendly. We also resolved Entra token-fetching failures for newly created accounts, ensuring a smoother onboarding experience. On the feature front, you can now leverage Entra Security Groups and guest accounts across multiple tenants when establishing new connections, streamlining permission management in complex Entra environments. Don’t forget to update to the latest version in the marketplace to take advantage of these enhancements and visit our GitHub repository to learn more about this month’s release. If you learn best by video, these 2 videos are a great way to learn more about this new VS Code extension: POSETTE 2025: Introducing Microsoft’s VS Code Extension for PostgreSQL Demo of using VS code extension for PostgreSQL Enhanced role management With the introduction of PostgreSQL 16, a strict role hierarchy structure has been implemented. As a result, GRANT statements that were functional in PostgreSQL 11-15 may no longer work in PostgreSQL 16. We have improved the administrative flexibility and addressed this limitation in Azure Database for PostgreSQL flexible server across all PostgreSQL versions. Members of ‘azure_pg_admin’ can now manage, and access objects owned by any role that is non-restricted, giving control and permission over user-defined roles. To learn more about this improvement, please refer to our documentation on roles. Ansible collection released for latest REST API version A new version of Ansible collection for Azure Database for PostgreSQL flexible server is now released. Version 3.6.0 now includes the latest GA REST API features. This update introduces several enhancements, such as support for virtual endpoints, on-demand backups, system-assigned identity, storage auto-grow, and seamless switchover of read replicas to a new site (Read Replicas - Switchover), among many other improvements. To get started with using please visit flexible server Ansible collection link. Azure Postgres Learning Bytes 🎓 Using PostgreSQL VS code extension with agent mode The VS Code extension for PostgreSQL has been trending amongst the developer community. In this month's Learning Bytes section, we want to share how to enable the extension and use GitHub Copilot to create a database in Agent Mode, add dummy data, and visualize it using the Agent Mode and VS Code extension. Step 1: Download the VS code Extension for PostgreSQL Step 2: Check GitHub Copilot and Agent mode is enabled Go to File -> Preferences -> Settings (Ctrl + ,). Search and enable "chat.agent.enabled" and "pgsql copilot.enable". Reload VS Code to apply changes. Step 3: Connect to Azure Database for PostgreSQL Use the extension to enter instance details and establish a connection. Create and view schemas under Databases -> Schemas. Step 4: Visualize and Populate Data Right-click the database to visualize schemas. Ask the agent to insert dummy data or run queries. Conclusion That's all for the June 2025 feature updates! We are dedicated to continuously improve Azure Database for PostgreSQL with every release. Stay updated with the latest updates to our features by following this link. Your feedback is important and helps us continue to improve. If you have any suggestions, ideas, or questions, we’d love to hear from you. Share your thoughts here: aka.ms/pgfeedback We look forward to bringing you even more exciting updates throughout the year, stay tuned!1.1KViews3likes0CommentsAre bigger agents better? How to design agents that scale
There is a moment every maker hits. An agent works, so you add another tool. Then another knowledge source. Then instructions for an exception that appeared last week or an entirely new use case you want your agent to be able to tackle. Each addition is useful on its own, and the agent can now do more. But "can do more" and "reliably does the right thing" are different properties. As an agent’s scope increases, the model has more choices to distinguish, more context to process, and more possible execution paths to manage. That doesn’t mean large agents are bad. It means that as capability grows, the challenge increasingly becomes a design problem. The key to scaling an agent isn't giving it more. It's being deliberate about what it sees, what it decides, and what it delegates. What changes as an agent grows The agent scaling challenge Consider a supplier-onboarding agent. The first version collects supplier details, checks that the request is complete, and starts an approval. Over time, makers add tools for ERP records, tax validation, sanctions screening, bank verification, contract storage, service tickets, email, and reporting. They add knowledge for regional policies and instructions for exceptions. Eventually, a request such as "Onboard our newest supplier" might present the agent with several supplier-search tools, multiple ways to create or update a record, and overlapping policy sources. The agent still has all the required capabilities, but choosing the right path is harder. The agent scaling challenge tends to show up in four places: Selection: Similar tool names and descriptions make the correct action harder to identify. Context: Tool definitions, instructions, knowledge, conversation history, and tool outputs all compete for a finite context window. Execution: More possible paths create more opportunities for unnecessary calls, retries, and inconsistent outcomes. Operations: A larger capability surface is harder to evaluate, secure, govern, and maintain. A recent post from Microsoft Research discusses one part of this problem: Tools that work well independently can reduce end-to-end performance when they compete in a large or overlapping set. Often, the problem isn’t one bad tool. It is the ambiguity between several reasonable ones. Figure 1: As a supplier-onboarding agent grows, overlapping tools, instructions, and knowledge compete for attention before the agent begins the task. More context comes with a cost There is also a direct cost associated with an expanding toolset. A tool consumes tokens even when it is never called because its name, description, and parameter schema are included in the context presented to the model. When it is called, its output becomes part of the agent's ongoing context. More context can mean more spend, as well as less reliable selection. The goal isn’t a smaller agent. It is a system where each decision sees only the context, authority, and capabilities it needs. Success is measured by business outcomes, reliability, cost, and control. What our harness can handle for you Good agent architecture doesn't mean solving every scaling challenge yourself. The GitHub Copilot harness in Copilot Studio is built to manage some of the complexity as an agent grows. Model improvements that don’t require agent redesign New models are made available through the GitHub Copilot harness as they release. As more advanced frontier models become available, teams can evaluate them against their scenarios and adopt improvements without redesigning the overall solution architecture. Model choice can also be an important factor in agent cost optimization, helping makers balance the number of tokens used against the capability needed to achieve a goal. Manage complexity natively with tool search The GitHub Copilot harness includes runtime capabilities designed for reasoning-heavy, multistep work. One example is tool search. When the available tool set becomes large, tool search can hold external tool definitions back and load the relevant ones on demand instead of placing every full schema in the model's context. For the supplier-onboarding request, this can narrow a large catalog to the tools associated with finding a supplier, validating its details, and starting onboarding. The model works with a smaller, better-matched set of choices while unrelated tool definitions remain out of the way. The harness can also plan across tools, skills, workflows, MCP servers, files, and connected agents, and adjust its path as work progresses. This all makes large, reasoning-heavy automations more practical. But runtime capabilities only solve part of the scaling challenge. How you divide responsibilities across tools, workflows, skills, and connected agents still matters. How to design agents that scale in Copilot Studio A scalable design starts by deciding which part of the system should own each responsibility. For instance: Use a tool for a bounded action or lookup with a clear input and output. Use a workflow when a sequence, approval, or business rule should execute consistently. Use a skill for specialized instructions that are only needed for a particular task. Use a connected agent when a domain has distinct context, ownership, or requirements. Use the main agent to coordinate outcomes, gather information, make judgments, and handle exceptions. These are not interchangeable building blocks. Each introduces different tradeoffs in context, flexibility, latency, cost, security, and maintenance. The goal is to use the simplest component that gives each responsibility a clear owner. 1. Make choices distinct Start with the choices already available to the agent. Give tools, knowledge sources, and connected agents specific names and descriptions that explain both what they do and when they should be used. Merge or remove duplicate capabilities. Avoid several general-purpose tools that all appear to answer the same intent. In the supplier example, "Search suppliers in ERP by legal name or tax ID" is easier to select correctly than a generic tool named "Search." If two tools search the same supplier records, expose one clear route rather than asking the model to choose between implementations. Tool search itself relies on names, descriptions, and parameter metadata to find relevant tools, so good metadata improves both discovery and final selection. 2. Load specialist guidance only when it is needed Some instructions are only relevant when an agent performs a particular task. Keeping all of them in the main agent instructions means they occupy context on every turn, even when they do not apply. Skills let makers package specialized instructions separately so the agent can load them when the task requires them. For example, regional supplier due-diligence guidance can be packaged as a skill and loaded for suppliers in that region, rather than remaining in the main instructions for every supplier request. The principle is the same as tool search: keep relevant context close and leave unrelated context out of the current decision. 3. Split on real boundaries When one agent contains several distinct domains, consider separating them. To clarify: Don't split an agent simply because it has grown large. Split where there is a meaningful boundary in context, ownership, security, or requirements. In the GitHub Copilot harness, connected agents let a primary agent delegate a bounded task to another Copilot Studio agent with its own instructions, knowledge, tools, and orchestration context. The supplier-onboarding agent could remain the front door while delegating: Compliance assessment to a compliance agent owned by the risk team. Supplier record creation to a finance operations agent with access to the ERP. Contract preparation to a legal operations agent with its own templates and policies. The primary agent now chooses between a few clearly described business capabilities instead of dozens of lower-level tools. Each specialist can be evaluated, secured, deployed, and improved independently. Copilot Studio also supports open agent architectures. Depending on the runtime and scenario, solutions can compose Copilot Studio agents or connect supported external agents through the Agent2Agent protocol. In the supplier scenario, a specialist due-diligence agent hosted outside Copilot Studio could sit behind the same clear boundary, rather than being rebuilt as a collection of tools. 4. Put fixed sequences in workflows Use the agent where the next step requires judgment. Use a workflow where the sequence, approval, or control must remain consistent. This helps preserve adaptability without making every part of the process probabilistic. For example, supplier onboarding might always require the same core sequence: validate required fields, check for an existing supplier, run mandated compliance checks, create the record, and route it for approval. A workflow can own that sequence. The agent can still decide when to start it, gather missing information, and handle exceptions. This reduces the number of low-level decisions the model must make and gives makers one place to enforce approvals, retries, and audit requirements. The supplier-onboarding agent, redesigned So let’s go back to the original agent in our example. It had one long instruction set, several knowledge sources, and dozens of tools. The redesigned system doesn’t eliminate that agent. It gives it a clearer job: coordinating the overall outcome while other components take on more specialized responsibilities. That gives us a system: The main supplier-onboarding agent understands the request, collects any needed details, delegates as needed, handles exceptions, and responds. Tool search limits the external tools loaded for the current request. Clear metadata separates supplier lookup, compliance, finance operations, and contract tasks. A workflow owns the fixed onboarding and approval sequence. Skills provide regional guidance only when the supplier's location requires it. Connected agents own compliance, ERP, and legal domains where those boundaries justify separate agents. The result is the same overall capability, but as a composed system with clearer responsibilities and less for any one decision to reason over. Evaluate for the outcome Each approach discussed above has limits. A stronger model cannot compensate for unclear instructions or overlapping tools. Tool search reduces what the model sees, but it does not create boundaries that have not been designed. Workflows and skills reduce what the main agent must reason over, but they add components to maintain. And connected agents can provide clearer ownership and security boundaries, but each handoff adds token use, another failure point, and more to govern. Designing agents that scale means managing all four components of the agent scaling challenge together: making selection easier with distinct choices and clear boundaries, controlling context with tool search and skills, making execution more predictable with workflows and deliberate delegation, and strengthening operations through components that can be evaluated, secured, governed, and improved independently. Agent scale is not a tool-count contest. Models, requirements, and available tools will keep changing, but these principles give you a more durable way to evolve an agent without letting added capability become added confusion. The goal is not the biggest agent; it is a composed system that reliably does the right work, at the right cost, with clear ownership.197Views0likes0CommentsWhen the Answer Isn’t in the Document: Metadata-Aware Agentic RAG with Foundry IQ
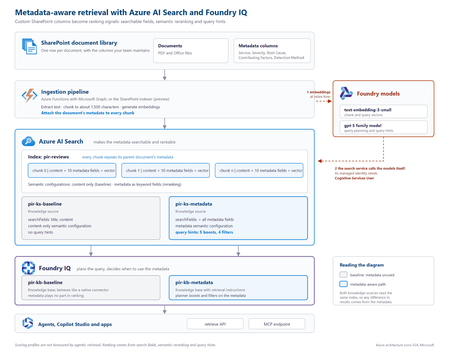
The problem SharePoint libraries often contain years of carefully curated metadata, including root cause, severity, business unit, document type, owner and classification. If that metadata never reaches the retrieval pipeline, however, a RAG system cannot use it. This creates a common blind spot: the information that explains what a document is about may exist in its metadata rather than its text. Consider an incident review containing this statement: “Investigation found that a DNS record was repointed during a migration while the old target was still serving writes.” The associated Root Cause Category is Configuration change, but those words do not appear in the document. Another review might mention that a configuration change was suspected and ruled out. Text-only retrieval can therefore favour the wrong document. In the sample dataset used for this project, none of the 19 reviews classified as configuration-change incidents contained the word “configuration”, while six reviews with other root causes did. Metadata does not improve every search. It helps when the information that determines what a document is lives outside the document text. Why tuning alone cannot fix it With a native SharePoint knowledge source, document text is extracted, chunked and embedded, while standard properties are retained. Custom SharePoint columns are not part of that ingestion path. Fields such as Root Cause Category, Contributing Factors, Detection Method and Severity therefore never become structured fields available to retrieval. If the metadata is absent from the index, search tuning cannot make it count. Flattening all metadata into a single text string is also problematic: Notification Service | Sev2 | Configuration change | Missing runbook This preserves the words but loses their meaning. A root cause, severity and contributing factor represent different concepts and should remain separate fields. Bring a custom Azure AI Search index The approach is to create and control a custom Azure AI Search index, then expose it to Foundry IQ as a searchIndex knowledge source. This combines metadata control with agentic query planning and a governed retrieval surface. Approach Metadata control Agentic planning Native SharePoint knowledge source No Yes Custom index queried directly Yes No Custom index as a knowledge source Yes Yes Architecture The key design principle is simple: every chunk carries its parent document's metadata. Figure 1. Metadata-aware retrieval architecture with Azure AI Search and Foundry IQ. The ingestion pipeline extracts a document, creates chunks, attaches document-level metadata to every chunk, generates embeddings and writes the records to Azure AI Search. Foundry IQ then uses the index as a knowledge source. Azure AI Search holds the metadata. Foundry IQ decides when to use it. Figure 2. Detailed implementation view, including the baseline and metadata-aware retrieval paths. At query time, the search service calls the configured models for vectorisation and query planning. Where key authentication is disabled, the search service's managed identity needs the required access. In the tested implementation, the Cognitive Services User role resolved HTTP 401 responses from retrieve requests. Put metadata on every chunk A chunk can only be retrieved and ranked using information available on that chunk. Each metadata property should therefore remain in its own field: { "id": "doc1035-000", "parentId": "doc1035", "title": "Notification Service: failed sign-ins", "content": "<extracted review text>", "rootCauseCategory": "Configuration change", "contributingFactors": "Missing runbook; Change outside window", "detectionMethod": "Customer report", "severity": "Sev2" } A separate metadata index does not solve the same problem because a match against metadata in one index cannot raise the ranking of a content chunk in another. What influences retrieval Four areas matter in this design: Search fields: searchFields determine which fields generated subqueries search. Semantic configuration: prioritised fields give the semantic reranker access to important metadata. Query hints: hints help the planner connect natural-language requests to known metadata values. Filters: a baseFilter or request-level filterAddOn can enforce constraints. Boost hints influence ranking without excluding documents. Filter hints can narrow the result set when the planner determines that a filter is appropriate. "queryHints": { "boosts": [{ "kind": "fieldValue", "field": "rootCauseCategory", "fieldValues": ["Configuration change", "Capacity", "Software defect", "Dependency failure", "Certificate expiry"], "boost": 3.0, "boostInstructions": "Boost when the user describes what caused an incident." }] } Hints are best effort. Hard requirements should use a base filter or document-level access control rather than relying on the planner to select a hint. The tested configuration used the 2026-08-01-preview API. Current documentation should be checked for supported models, limits and behaviour before implementation. Measuring the impact Two knowledge bases were created over the same Azure AI Search index. The baseline searched title and content. The metadata-aware configuration used the same content plus structured metadata, semantic configuration and query hints. Ten questions were run through both configurations. Correctness was determined directly from the metadata attached to returned reviews, rather than by asking an LLM whether a result appeared relevant. For the question “What can be learned from outages caused by configuration changes?”, the planner generated: rootCauseCategory eq 'Configuration change' Matching reports in top 5 Score Baseline 0 Metadata-aware 3 Best possible 5 Across ten questions and four runs using gpt-5.4-mini for query planning, the baseline returned 26 matching reviews in the top five. The metadata-aware configuration returned 39 to 41, against a best possible score of 50. The gains appeared where metadata carried the missing meaning: Configuration changes: 0 → 3 Configuration changes reported by customers: 0 → 3 Capacity in production: 1 → 5 Alert fatigue: 3 → 5 Queries whose important terms already appeared in the document text scored 5/5 in both configurations. The result is therefore more specific than “metadata improves search”: metadata closes a retrieval gap when document text does not fully describe what the document represents. A failure mode worth handling Because query planning uses an LLM, the planner can occasionally generate a filter that the search index rejects. Two invalid examples observed during testing were: severity eq Sev1 changeRelated eq true The first omitted quotes around a string. The second treated an Edm.String field containing Yes and No as a Boolean. The latter caused the retrieve request to fail with HTTP 502. The fix was to make the schema and allowed values explicit: This is a text field, not a Boolean. The only valid values are 'Yes' and 'No'. Never compare the field with true or false. Application code should also handle retrieval failures rather than assuming every generated filter will be valid. Production considerations A custom index provides control, but the solution now owns ingestion. Options include the SharePoint indexer with custom columns, an Azure Function using Microsoft Graph, or an existing pipeline built with Logic Apps, Azure Data Factory or Microsoft Fabric. A custom Azure AI Search index does not automatically inherit the SharePoint permissions model. Where users have different document permissions, ACLs must be carried into ingestion and retrieval. Query hints should also be regenerated when taxonomy values change. Key takeaways Confirm that the required metadata reaches the index. Keep metadata structured rather than flattening it into one text field. Attach parent-document metadata to every chunk. Use search fields, semantic configuration, query hints and filters deliberately. Describe field types and valid values clearly in filter instructions. Evaluate against a baseline using objective correctness rules. Metadata-aware retrieval is not about making every search better. It gives the retrieval system access to context that does not exist in the document text. Try the proof of concept The complete proof of concept, synthetic dataset, index scripts, knowledge-base configurations and A/B evaluation harness are available in the GitHub - shikha-msft/foundryiq-metadata-agentic-rag. References Create a search index knowledge source Create a knowledge base Query a knowledge base via API or MCP What is Foundry IQ?146Views0likes0CommentsClosing the AI Agent Governance Gap with Microsoft Foundry
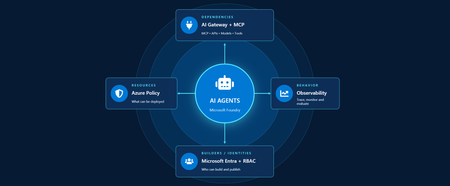
Developers are shipping agents faster than security teams can catalog them. As organizations move beyond pilots and begin operating dozens or hundreds of agents, one question keeps coming up: how do we actually get visibility into our AI agents across our environment? In this article, we'll walk through how Azure services can help establish visibility, guardrails, and cost accountability across your AI estate. Governance for AI happens across four layers: Resources – who can create new AI resources Builders – who can develop and publish agents in a certain scope Behavior – how agent outputs are evaluated, monitored, and governed Dependencies – what models, tools, APIs, and MCP servers agents can interact with Most organizations already have governance controls for identities, networking, and compliance. The challenge isn't creating new controls. It's connecting existing controls into an operating model that works for AI agents. Below we walk through each area and go a bit deeper on how to close the gap. Setting up boundaries with Azure Policy First, let's start in the Azure portal with Azure Policy. Azure Policy lets you set guardrails on what can be deployed in your environment and flags or blocks anything that doesn't comply. For AI workloads, the built-in definitions range from limiting models that people in your organization can deploy to locking down the network through enabling private endpoints. Some policies you get started with: Foundry model deployments should only use approved models: Restricts deployments to models or publishers your organization has explicitly approved Foundry model deployments should meet eligibility requirements (preview): Applies rules based on model attributes like preview vs. GA status and distribution source Azure AI Services resources should have key access disabled: Makes Microsoft Entra ID the only entry point The full list of policies related to Azure AI Services are available here: List of built-in policy definitions - Azure Policy | Microsoft Learn Why this comes first: Policy checks resources before they are created, so it proactively keeps your environment aligned with your standards. Implementing role-based access control (RBAC) Once these boundaries are in place, the next step is RBAC. Setting RBAC up early ensures that people and identities building agents have the right scope for what they actually need to do. Foundry roles only apply when you authenticate using Microsoft Entra ID. If you're using key-based authentication instead, the key grants full access with without role restrictions. API keys are convenient for quick development usage but when moving towards production, Microsoft Entra ID is the preferred method. Roles can be assigned at three scopes: the Foundry resource, a Foundry project, or an individual agent itself. Below is an example of how different personas within organization can map to a certain scope for creating and building agents with Foundry. Here's how each role in the diagram compares, from least to most privileged: Role Privilege Level What it does in Microsoft Foundry Foundry Agent Consumer Least Interact with agent endpoints in a project. This is your least-privilege role for people who only need to use agents. Foundry User Low Grants reader access to the Foundry project, the Foundry resource, and data actions for your Foundry project. Least-privilege access role for developers building and testing agents. Foundry Project Manager Medium This role lets you perform management actions on Foundry projects, build and develop with projects, and conditionally assign the Foundry User role to other user principals. Foundry Account Owner Higher Grants full access to manage Foundry projects and resources, and lets you assign the Foundry User role to other user principals. Foundry Owner Highest Grants full access to manage Foundry projects and resources to build and develop with projects. This role can also assign the Foundry User, ACR, and monitoring roles to users in the environment. Source: Role-based access control for Microsoft Foundry - Microsoft Foundry | Microsoft Learn For the agent resources themselves, assign managed identities rather than API keys since it lowers the risk of having compromised credentials. Note if you're scripting RBAC permissions: these roles were recently renamed from Azure AI User, Azure AI Owner, Azure AI Account Owner, and Azure AI Project Manager. The role IDs and permissions didn't change, so use the role definition GUID in your code to avoid issues while the rename rolls out. Observability in Microsoft Foundry Governance requires more than access control. Organizations also need evidence of how agents are being used. Observability provides the audit trail needed to investigate incidents, understand usage patterns, and track costs. The Foundry Control Plane brings these observability and governance tools together in one place, alongside services like Azure Monitor, Microsoft Entra, Microsoft Purview, and Azure Policy. In the Foundry portal, tracing is a good starting point. Once you connect an Application Insights resource to your project, Foundry turns on tracing automatically so every run, including the ones you test in the playground, is logged. After it is completed, you can search by Response ID or Trace ID to see the conversation history, token usage, run steps, tool calls, and inputs and outputs between the user and the agent. For more granular queries, you can write KQL to dive into individual agent runs or use the prebuilt Grafana dashboards in Azure Monitor. With client-side tracing, you can also export traces to observability tools you may already use, such as Datadog or Jaeger. Note: Permissions required for viewing this telemetry requires the Log Analytics Reader role on the connected Application Insights resource, and Privileged Monitoring Data Reader on top of that if the underlying Log Analytics tables are protected. Alongside all of these monitoring features, every agent comes with content safety guardrails and evaluations let you test and optimize performance before and after you publish your agents. When agents get published to Microsoft Teams and Microsoft 365 Copilot, Microsoft 365 admins can approve usage requests. These requests can be further scoped to a limited group for pilot testing/department usage or the full organization. Adding an AI gateway Observability tells you what your agents are doing, but how do you actually control them? This is where Azure API Management comes in. Once you have more than one agent, model deployment, or multiple teams consuming them, you need a single enforcement point between the agents and the resources they call. Adding Azure API Management in front of Microsoft Foundry gives you: Rate limiting and load balancing across regions and model deployments Consistent authentication and quota policies for model and tool traffic Usage tracking per team or cost center so you can accurately charge back to different departments Governed access to your custom and remote MCP servers Note: When choosing MCP servers, start with trusted, enterprise supported sources (GitHub, Microsoft, internally developed servers, etc.) that have documented security controls, enterprise authentication, clear ownership, and least-privilege permissions. Treat community MCP servers as untrusted until they have undergone a formal security review and are verified by organizations. Adding an AI gateway completes the governance picture. Azure Policy governs what can be deployed. RBAC governs who can build and manage agents. Observability provides evidence of how agents behave in production. The AI gateway extends governance into runtime, controlling how agents interact with models, tools, and external systems. Combined, these layers help organizations move beyond simply building agents to operating them responsibly at scale. Extend governance across the wider estate A few directions to take this further: MCP registry in Azure API Center – As MCP usage grows, you can create an approved inventory of MCP servers and APIs that can be used across an organization. Microsoft Agent 365 – Microsoft's enterprise control plane for AI agents. It gives every agent its own Microsoft Entra Agent ID and published Foundry agents sync to its registry automatically. This gives your IT team one place to run access reviews, lifecycle policies, and owner attestation across every agent in the tenant, including shadow agents discovered outside Foundry. Copilot Studio – when you add an MCP tool, you can point it at the API Management URL instead of the direct remote endpoint to gain additional observability through the gateway. GitHub Copilot – you can apply the same AI gateway-fronted MCP registry, applied to the developer side. Microsoft Purview – data classification, DLP, audit, and AI interaction governance across the wider estate. Where to go next Looking for a quick start? Turn on the three Azure Policy definitions above in audit mode against a non-production subscription and see what gets flagged that is out of compliance. Ready to design the end-to-end pattern? Take a look at this Cloud Adoption Framework guidance on AI governance and governing Azure platform services for AI. Want to go deeper on agent observability? Start with these articles around Application Insights integrations with Foundry: Use Insights in Microsoft Foundry and Monitor AI Agents with Application Insights Governing AI agents doesn't require starting from scratch. The identity, policy, monitoring, and cost controls you already use for the rest of your Azure estate can extend to AI workloads. Start with one layer, connect the next, and build a governance foundation that grows with your AI adoption.326Views3likes0CommentsFrom Business Brief to Production Agent: Building in Three Stages, Not One
The problem with "AI can help my business" Every non-technical founder has heard some version of "you should put an AI agent on this." Far fewer have seen what it actually costs, in time and money, to find out whether that's true for their specific business — before committing to it. The honest answer is: it shouldn't cost much at all, if you build it in the right order. Most of the expensive AI project failures aren't failures of the model — they're failures of sequencing. Someone commits to real infrastructure, real hosting, and real integration work before anyone has confirmed the underlying idea even holds up. This post walks through a small, realistic project — an autonomous sales-development agent for a fictitious construction-tech company — built in three deliberate stages, each one cheap enough to abandon and each one answering a different question before the next stage spends any more money or time. The point isn't the specific agent. It's the order of operations: what to validate first, what to validate second, and what you only pay for once everything before it has already been proven. The Brief Hi, I'm looking for someone who can help me grow FieldForge, a SaaS platform specifically for general contractors, remodelers, and design-build companies. I'm not looking for generic lead lists. I need someone who can identify qualified construction companies, reach the owner/decision-maker, start conversations, and book demos that can turn into paying SaaS customers. Your experience with B2B lead generation and appointment setting looks relevant. I'd love to hear how you would approach generating qualified leads and growing a construction-focused SaaS. Translated into engineering terms, that's four capabilities: pull in new leads from a data feed (ingest_permits), decide whether each one is worth pursuing (qualify_lead), draft a personalized first-touch email for the ones that qualify (generate_pitch_email), and hand qualified leads off to an outbound sequence (dispatch_sequence). Nothing about that list requires committing to any infrastructure yet — which is exactly the point of Stage 1. Stage 1: Mock prototype — no AI, no backend, no cost The first stage has no real agent in it at all. It's a Vite + React console with the full intended UI — a strategy pane, a live-feed pane, a lead-dossier pane — wired to hand-written mock data and a fake setTimeout standing in for "the AI is thinking." No model calls, no cloud resources, no backend of any kind. It runs entirely in a browser tab: This is deliberately the cheapest possible way to answer the first real question: does this even make sense as a product, before a single token of inference is spent proving it? Is a 3-pane command console the right way to expose "an agent found and qualified these leads for you"? Is a permit-triggered pitch angle a good hook, or does it look contrived once it's actually on screen? Does a business owner look at this and understand what they're being offered? None of those questions need a real agent to answer — they need a UI a person can click through and react to. Running this stage costs essentially nothing beyond development time: no API calls, no cloud spend, nothing to tear down if the idea doesn't land. Where the AI pair programmer actually did the work. This entire stage — the layout, the state management, the mock data shapes, the interaction flow — was built by describing the product in plain language to an AI coding assistant (GitHub Copilot, Claude) and iterating on the generated code directly, rather than dragging components around in a low-code builder. That distinction matters more than it sounds like it should. A low-code prototype is fast to show, but it's still just a prototype — once a real agent needs to sit behind it, most of that first version gets rebuilt in real code anyway. A pro-code prototype, even a fake one, is a keepable asset: the exact same React components, the exact same UI shell, carry forward unchanged into Stage 2 and Stage 3. Nothing here gets rebuilt later — it gets connected to something real. What this stage proves, and what it deliberately doesn't. By the end of Stage 1, you know whether the product concept and the UX hold up — whether the thing you're describing to a non-technical stakeholder actually makes sense once it's on a screen in front of them. What it tells you nothing about: whether a real model can actually do the reasoning this UI is pretending to show. That's a completely different risk, and it's wrong to pay for cloud infrastructure to find out — it just needs a real agent, still running on a laptop: Stage 2: A real agent, still running on a laptop — the convincing part This is the stage that actually matters most, and it's also the cheapest place to find out if the whole idea works. The fakery gets ripped out and replaced with a genuine agent: a Microsoft Agent Framework Agent, backed by a real model deployment on Microsoft Foundry, given the same four tools from the brief — ingest_permits, qualify_lead, generate_pitch_email, dispatch_sequence — as real Python functions it can actually call. Its reasoning streams live into the same terminal-style pane the mock prototype already had, so nothing about the UI needs to change; only what's driving it does. Crucially, the frontend stays on a local dev server and the agent stays a local process on the same machine. There's no cloud hosting, no production auth, no deployment pipeline — the UI just talks to a locally running agent server over a simple streaming protocol. That's the deliberate design of this stage: the only thing worth testing here is whether the agent is actually good, and every question that matters — does it call tools in a sensible order, does it correctly decide which leads qualify, does its drafted email actually reflect the lead's specific trigger event rather than reading like a template — can be answered without touching a cloud resource. The qualify_lead tool is where this gets concrete: it's handed a target definition — commercial/residential remodelers in a specific revenue band, an active permit filing, still running manual/legacy tooling — and has to decide, per lead, whether it's a fit. You'll see this called an ICP (Ideal Customer Profile) constantly in sales and GTM circles right now, to the point of being a bit of a buzzword. Stripped of the jargon it's just this: a precise, written-down definition of a good-fit customer, specific enough that a model can apply it as consistently as a trained human rep would. The reason it matters isn't the term — it's that the agent's usefulness is bounded entirely by how precisely that definition is written, and this stage is exactly where you find out if yours is precise enough. This is also where model choice gets decided, cheaply. Swapping which Foundry model deployment sits behind the agent, or rewriting the system instructions, costs a restart and a few cents of inference — not a redeploy, not a new pipeline run. If gpt-4o isn't giving good enough qualification judgment, or the reasoning is inconsistent between runs, you find out here, in seconds per iteration, for the price of a handful of API calls. Compare that to discovering the same problem after cloud hosting, authentication, and a production pipeline are already built around it. That's why this stage — not Stage 1 — is the genuinely convincing one. Anyone can mock up a UI that looks like an agent found and qualified a lead. Stage 2 is where you can put a real, unscripted permit feed in front of a real model and watch it reason its way to a defensible qualify/reject decision and a genuinely personalized email, live, for the cost of a few model calls. That's the moment a skeptical stakeholder stops asking "does this actually work" and starts asking "when can we have it." What this stage proves, and what it deliberately doesn't. By the end of it, you know the agent itself is sound — right tools, right order, correct ICP logic, real personalization — for a cost barely above Stage 1's. What it hasn't touched: what happens when a real user hits this over the public internet, how auth works outside your own machine, whether the hosting model you eventually pick can actually serve this reliably. That's a different kind of work, and it starts now that there's finally something worth doing that work for. Stage 3: Quasi-production — translating a proven agent into a running service Stage 2 answers "does the agent work." Stage 3 answers a different question entirely: "can this be handed to someone who isn't on my laptop." That's not a continuation of Stage 2's work — it's a translation of it. The agent's logic, tools, and instructions don't change at all going into this stage; what changes is everything around them, as the same proven Agent gets repackaged into something that can actually run as a service instead of a local process. The agent itself deploys as a Foundry Hosted Agent via azd — no hand-written Dockerfile, no Container App config, no Bicep authored from scratch; Foundry's managed hosting owns the runtime, scaling, and session continuity (via previous_response_id chaining on the Responses protocol), and assigns the agent its own managed identity. The frontend and its API layer become an Azure Static Web App: the React build as static assets, plus a small same-origin Azure Function that reverse-proxies requests to the hosted agent. That proxy exists for a concrete reason — Foundry's hosted-agent endpoint has no CORS support, so a browser calling it directly would simply be refused; routing through a same-origin Function sidesteps that entirely, and keeps the real agent URL and credentials server-side instead of sitting in a public JS bundle. None of that is agent work. It's the operational work of turning a validated prototype into a real, addressable, network-reachable thing — the productionization step every agent eventually needs regardless of how it was built, and the part that's easy to underestimate if you haven't budgeted for it as its own phase. Framed plainly, this stage is where the project stops being "a demo that runs on my machine" and starts being "a small SaaS": something with a real URL, a real hosting bill, real auth, and a real deploy pipeline — everything that separates a working prototype from a thing you could actually put a customer in front of. To be clear about the boundary of "quasi": this is not a fully hardened production system. There's no custom domain, no persistent session store beyond what Foundry provides out of the box, and no load testing. What it is: proof that the exact agent validated in Stage 2 can be deployed, reached over a real network, and driven from a real hosted frontend without silently breaking — the last class of risk that only shows up once something leaves your own machine. What this stage proves, and what it deliberately doesn't. By the end of it, you know the whole pipeline holds together end to end, from a hosted UI through a same-origin proxy to a Foundry-managed agent and back, streaming, over a real deployment. What it doesn't prove: that it holds up under real production load, real customer data governance, or a real incident on-call rotation. Those are legitimate next questions — just not the ones this stage was built to answer, and not ones worth paying for before the first two questions were settled. The pattern, not just the project Line the three stages up and the shape becomes obvious: each one is deliberately the cheapest possible way to eliminate one specific class of risk before the next stage spends real money finding out the hard way. Stage 1 kills product/UX risk for the cost of dev time and zero infrastructure. Stage 2 kills agent-quality risk — the right tools, the right model, correct decisions — for the cost of a few model calls, and it's the stage that actually earns anyone's confidence that this is real. Stage 3 kills operational risk — real hosting, real network, real auth — by translating an already-proven agent into a running service, rather than building all of that around an agent nobody has validated yet. Collapse those stages — build the hosting and the agent and the UI all at once, betting everything up front — and you don't save time. You just move all three classes of failure into the same debugging session, at the point where they're most expensive to disentangle and hardest to tell apart. Staged this way, each phase is cheap enough to walk away from if it fails, and each one only gets built on top of a phase that already earned its place. There's a second half to this story that's deliberately not in this post: the data. Everything here ran on synthetic permit feeds and mock company data — a real deployment lives or dies on where its actual leads come from and how well they're structured for a model to reason over. That's its own story, and it gets a dedicated write-up of its own. Project reference Source code: https://github.com/olivierb123/lead-agent-demo Live demo: https://victorious-glacier-03340ff0f.3.azurestaticapps.net139Views0likes0Comments
Your Agents Need More Than a Place to Run
In architecture reviews with enterprise teams moving their first agentic applications toward production, I often hear the same plan: the team has containerized their agent and intends to run it on the managed Kubernetes cluster the organization already trusts. The reasoning is sensible, since the platform team knows the tooling and security has approved the network model, and for the first use case or two it is often the right call. Having watched this unfold in my years leading AgenticAI customer engineers and forward deployed engineers, and now helping customers reach production on Azure, I want to describe what happens next, before leaders commit rather than after. One thing to note is Azure supports multiple ways to build and operate agents. Foundry Agent Service provides an integrated managed runtime around your agent code. Azure Kubernetes Service supports teams that need Kubernetes-level control or want to extend an established platform, while Azure Container Apps provides managed container hosting. These services can work together. The decision is which capabilities and responsibilities best fit the workload. Where the cluster is the right answer A stateless retrieval application, a document extraction pipeline, or a classification job is a web service that happens to call a model, and a container platform runs web services well. A large retail customer of mine ran an invoice extraction agent on containers for over a year with almost no issues, and I never suggested they move it. The cluster remains the right home for several other situations as well. LLM invocations embedded inside existing microservices, event driven, or batch pipelines fit container platforms naturally. Genuine constraints such as air-gapped or sovereign environment, regions where a managed service is not yet offered are a good reason to run your own stack, and strong engineering team that already operates at that level can be a real asset. Even when the agents themselves move to a managed runtime, the tool servers, business APIs, and data services those agents call, often stay on your cluster, so they are complementary far more often than they are competitors. The problem is that these early wins can make agents seem like just another workload. Where the wheels come off The first failure is the state. A research agent that plans, searches, and synthesizes for ninety minutes is a long-running stateful process, while a Kubernetes pod is a disposable container the scheduler may restart at any time. A financial services team I worked with lost costly research run to a routine node upgrade, and responded as capable engineers do by building checkpointing, a durable store, and a resume mechanism. It worked, but they now owned a piece of infrastructure they had to keep correct as their agent's framework changed beneath it. A managed agent runtime absorbs this. Hosted agents in Foundry Agent Service, as one example, give every session a VM-isolated sandbox with a persistent file system, a durable state store that survives crashes and restarts and can hold checkpoints for frameworks such as LangGraph or Microsoft Agent Framework, and a resilient execution mode that recovers long-running work after a process interruption. The second is the human-in-the-loop. A commercial insurance customer’s claims agent needed sign-off from an adjuster and sometimes a second reviewer, with days between steps. Stopping an agent cleanly at the moment it needs a decision, holding its full session for four days without paying to keep it running, and resuming it correctly when the approval arrives is not something a container orchestrator gives out the box. The team built agent session suspend and resume, a queue, a durable state store, notifications, and an approval interface, and ended up with a small workflow engine nobody had planned to own. In hosted agents, an idle session is deprovisioned with its state persisted and restored onto fresh compute when the same session ID returns, so an agent waiting on an approval cost nothing while it waits, and sessions are retained for up to thirty days of inactivity. The approval experience remains yours to design, which is where your engineers' time should go. The third is multi-turn conversation, which quietly pushes teams into building their own context management system. The first version appends each turn to history, and within few turns the history outgrows the context window while cost and latency climb. So, the team adds truncation, then summarization, then retrieval of earlier turns, then per-user and per-tenant scoping, then expiry and deletion rules for privacy. An industrial customer's safety compliance assistant, with conversations stretching across days, followed exactly this path and ended up with a bespoke thread store and summarization pipeline nobody had budgeted for. Its first serious incident came when a summary silently dropped a compliance-relevant instruction. With the Responses protocol in hosted agents in Foundry, conversation history is a durable, platform-managed record keyed by a conversation ID and reachable from any channel, so the thread store is no longer yours to build, although deciding what to summarize or retrieve remains a design choice for your agent. The fourth is identity. On a cluster, the path of least resistance is a shared service account, and in one review a security architect asked which actions had been taken on behalf of which user, only to learn that the logs could not say. Hosted agents create a dedicated Microsoft Entra agent identity for each agent at deploy time, use on-behalf-of flows to act with the user's delegated permissions in interactive scenarios and the agent's own identity in autonomous ones, and keep the agent identifiable for audit in both cases. The fifth is per-user session isolation, which is the difference between an agent that serves many people and an agent that mixes them up. Agents read files, run code, and hold working data, and on a shared pod the default is that many users share a process, a file system, and often a cache. Giving every user session its own sandboxed environment and storage, so that one person's documents and intermediate results can never surface in another's, means engineering hard isolation boundaries and proving them to your security team. Hosted agents make a VM-isolated sandbox per session the default, and their durable state store can partition items per end user, so one store is safe to share across the users of a multitenant agent. And lastly, Evaluation and optimization are where the gap widens. The largest difference between teams that scale and those that stall is evaluation. Because agents are probabilistic and multi-step, staging tests often miss failures such as a wrong tool choice or a policy violation deep in a task. One customer’s agent passed every offline check but degraded unnoticed for weeks after a model update because evaluation stopped at release. Mature teams continuously evaluate production traces, combine automated judges with sampled human review, and red-team regularly.Once quality is measurable, teams can deliberately balance prompts, models, tools, latency, and cost. One team cut per-task cost by routing simple steps to smaller models after evaluation confirmed quality held. Self-built stacks require teams to assemble and maintain tracing, datasets, judges, and release gates. Hosted agents instead combines default OpenTelemetry traces with continuous evaluation, adversarial testing, and datasets generated from agent instructions. Staged closed-loop optimization uses those traces to improve instructions, tool descriptions, and model selection without extra plumbing. The real cost is the velocity gap Leaders usually expect me to quantify the initial build, and that is the smaller number. A team of four building the first agent often becomes ten or twelve within a year, and a growing share of them are maintaining a runtime for agents rather than building agents that serve the business. The enterprise has quietly created an internal agent infrastructure company in a field where the patterns for memory, tools, evaluation, and safety are rewritten every few months, while hyperscalers put hundreds of engineers on exactly this problem and ship at a cadence no single platform group can match. Foundry Agent Service, for instance, bundle content safety guardrails into the runtime and route outbound traffic through a customer virtual network, capabilities that platform teams otherwise assemble one integration at a time. This plumbing does not differentiate your organization, so the question is whether your scarcest engineers should spend years on it or on the workflows, data, and judgment only your company has. This is also why the technology companies held up as examples are a poor template. Many built their own runtimes because managed options did not yet exist and had large platform organizations to carry the load. Even they tend to invest in a custom runtime for the first handful of use cases and then migrate as managed services mature, because the maintenance burden compounds while the strategic value of owning the plumbing does not. What I would do as the leader I am not arguing against Kubernetes or for moving everything tomorrow. Comparable managed runtimes exist across the hyperscalers, and I use hosted agents as the running example only because it is the one I know best from the inside. Managed agent services are still maturing, some workloads have real data residency or customization needs, and abstraction always constrains something. What I am arguing for is a deliberate choice for each use case, guided by three questions: whether the agent must outlive a single request by running long, waiting on humans, or remembering across sessions whether it must act with its own identity, auditable delegation, and policy enforcement whether your team would be building anything a managed service already provides, and who will still maintain it in two years. Key takeaways Match the runtime to the workload. Containers on your existing cluster suit stateless, short-lived agents, while long-running, human-in-the-loop, and memory-dependent agents need capabilities your platform team was never hired to build. Count the hidden team. The real cost of self-hosting is the growing group of engineers maintaining state, identity, memory, guardrails, and tracing instead of solving business problems. Make evaluation continuous and connected to production traces. Pre-release testing alone will miss the drift and trajectory failures that hurt you, and optimization of quality, cost, and latency depends on that evaluation data. Follow the pattern of the leaders, not their early architecture. Companies that built custom runtimes did so before managed options matured, and most of them move toward managed services as those options improve. A practical place to begin is your roadmap for the next twelve months. Sort each use case into stateless and short-lived or long-running and human-dependent, and for every agent in the second group put a price on the engineers who would maintain the runtime rather than the business logic. I would like to hear how you have drawn this line, and where a managed service was not yet ready for something you needed.600Views2likes0CommentsBeyond the Trace: The Science of Insight Quality
Co-authors and reviewers: Morteza Ziyadi, Hanchi Wang, Han Che, Billy Hu, Sean Gayler, Nishal Dsilva, Avinav Jami, Ankit Singhal, Augustus Arthur TL;DR. Insights in Foundry turns recurring agent behavior into evidence-linked findings developers can review and act on. We evaluate trace linkage, finding quality, and detection of known issues using labeled benchmarks, LLM-judge assessment, and controlled end-to-end tests. What is an Insight? An Insight is a reviewable finding about recurring agent behavior. It brings together an explanation, supporting trace evidence, and a possible next step, helping developers investigate a pattern rather than inspect each execution in isolation. Depending on the available evidence and supported configuration, an Insight can include: Part of an Insight What it gives the reviewer Title and description The recurring behavior and an evidence-based explanation of a possible cause. Linked traces The broader group of traces associated with the finding. Highlighted traces Representative examples to open and check against the explanation. Category, severity, and status Context for triaging the finding, not a substitute for a risk assessment. Agent version and recency Which version is represented and when the finding was created. Proposed action or fix An investigation or improvement path; concrete proposals depend on the configuration. Figure 1. An Insight detail view in Microsoft Foundry, cropped from public Microsoft Learn documentation. The description, evidence, and proposed fix support human review. This UI illustration is not a benchmark result; the source link provides a full-size view. UI source and field definitions: Insights in Foundry documentation. From trace search to an actionable review queue Production agents can generate thousands of traces containing model calls, tool calls, latency, token usage, errors, and final responses. Observability shows what happened, while evaluations test criteria a team already knows to measure. The harder problem is discovering repeated behavior that the team did not know to predefine. Insights in Foundry analyzes traces from the Application Insights resource connected to a Foundry project and organizes recurring behavior into reviewable Insights. Depending on the evidence and supported configuration, an Insight can include representative traces, affected agent versions, severity, an explanation of a possible cause, and a recommended next action. Concrete prompt or code proposals are available only for supported agent types and configurations; other Insights provide general investigation or remediation guidance. Insights in Foundry is now available in public preview. It analyzes production traces to surface recurring behaviors and regressions with supporting evidence and suggested areas for investigation or improvement. Developers remain in control: review the cited traces and validate proposed changes through normal evaluation and deployment practices. During public preview, we will continue expanding the experience based on customer feedback. To make this concrete, Figure 2 maps 220 inputs from TraceElephant, a public agent-trace benchmark, to seven generated Insights. Figure 3 examines one linked trace. Figure 2. Recorded links from 220 public TraceElephant inputs to seven generated Insights in the September 17 benchmark. The 80-input finding includes the looping trace examined in Figure 3. Titles are editorial paraphrases; the layout is editorial, not a product screenshot or a validation of each diagnosis. Figure 3. A public TraceElephant trace contains 54 model calls; steps 26, 30, 34, 38, 42, 46, and 50 repeat an identical extraction plan. The September 17 benchmark run of the production pipeline links this trace to a finding about missing progress-aware termination. Wording is paraphrased; this is an illustration, not product UI. The proposed intervention still needs evaluation. Three complementary ways to evaluate Insight quality Insight quality involves which inputs a finding links, how well it explains the evidence, and whether it identifies known issues in controlled tests. We combine labeled trace evaluation, unlabeled finding assessment, and controlled end-to-end testing. These are complementary sources of evidence, not mutually exclusive dataset categories. Evidence Question Assessment / results Labeled trace evaluation Do Insights link inputs that reference annotations mark as failing? Reference labels; trace precision and trace recall (%). Unlabeled finding assessment Are generated findings grounded and useful? Eight-dimension LLM judge; mean score (1-5). Controlled end-to-end tests Do Insights identify known injected issues? Known issues and healthy baselines; detections, misses, unsupported findings, duplicates, and unscored cases. Here, 'unlabeled' means reference failure labels are not used for the evaluation; the sources can still contain annotations or reference answers. Public versus internal describes where data comes from, not how it is evaluated. LLM judges can also assess findings from labeled or controlled scenarios. Labeled evaluation: Do Insights link the right traces? Trace precision: among unique benchmark inputs linked by at least one generated Insight, the fraction marked as failing. This measures discrimination only when a dataset includes healthy inputs, and it does not validate the diagnosis. Trace recall: the percentage of failure-labeled benchmark inputs linked by at least one generated Insight. It does not measure how many distinct failure modes were discovered. We evaluated the production pipeline on the same 746 benchmark inputs (653 failure-labeled) on September 15, 16, and 17, 2026. Repeating these inputs does not create 2,238 distinct examples. The six benchmark corpus slices come from public agent-trace research datasets with human reference annotations: AgentRx (Tau-bench retail), AgentRx Magentic-One, TRAIL, AgentErrorBench, TraceElephant, and the MAST-Data human subset. AgentErrorBench is the annotated failure-trajectory dataset released with AgentDebug, a framework for detecting and recovering from agent failures. The two AgentRx slices come from the same public release. The benchmark uses selected and normalized inputs from these releases, not a representative sample of customer production traffic. For each dataset, the chart shows daily generated-Insight counts and trace recall. The table reports equal-weight means of daily trace precision and recall. These datasets support ongoing development; results depend on the dataset and model used. Labeled results Figure 4. Generated Insight count versus trace recall for all six public corpus slices. Each point is one daily run; labels retain values where markers overlap. Recall measures linkage to failure-labeled inputs, not diagnosis correctness. Three-day mean precision and recall follow in the table. Dataset Inputs/day Failure-labeled/day Linked/day range Mean trace precision Mean trace recall AgentRx (Tau-bench retail) 102 29 43-45 37.8% 57.5% AgentRx Magentic-One 58 44 54-57 75.3% 94.7% TRAIL 148 143 139-140 96.9% 94.6% AgentErrorBench 200 200 194-196 100.0%** 97.3% TraceElephant 220 220 218-220 100.0%** 99.7% MAST-Data (human subset) 18 17 14-16 93.3% 82.4% ** When every input is failure-labeled, 100% trace precision cannot measure false-positive control. What the labeled results show High precision can reflect the corpus base rate. AgentErrorBench and TraceElephant contain only failure-labeled inputs, so their measured precision is 100% by construction. TRAIL, AgentRx Magentic-One, and the MAST subset also contain mostly failures; their precision values are close to their underlying failure-label prevalence. Read precision beside trace recall and each dataset's label prevalence rather than as a standalone quality score. AgentRx (Tau-bench retail) is the clearest mixed-traffic stress test. Only 29 of 102 inputs were failure-labeled. Across the three days, trace precision was 43.2%, 37.8%, and 32.6%, averaging 37.8%; trace recall was 65.5%, 58.6%, and 48.3%, averaging 57.5%. Daily linked counts were 44, 45, and 43, including 19, 17, and 14 labeled failures respectively. These daily rates are averaged before rounding. Some linked inputs without failure labels could contain issues outside the reference labels, such as cost or latency, but this benchmark cannot confirm that. Trace precision and trace recall measure whether Insights link inputs that reference annotations mark as failing. They do not establish whether an explanation is correct or a proposed action is useful. Our unlabeled evaluation examines those qualities using an eight-dimension LLM judge. Unlabeled evaluation: Are the findings grounded and useful? For this evaluation, a separate LLM judge scores generated Insights against the supplied input evidence, without using reference failure labels to compute precision or recall. These scores are automated assessments produced by an LLM judge. They are not human ratings and do not establish that a proposed action will improve the agent. This evaluation covers PUPA, FailSafeQA, tau2-bench, synthetic scenarios, and an internal production dataset for the monitoring dashboard agent compiled from Microsoft employee usage. These sources are normalized into benchmark inputs; not every input is a complete execution trace. The eight-dimension judge rubric Each generated Insight receives a score from 1 to 5 on eight dimensions. The rubric separates the quality of the explanation, the importance of the issue, and the usefulness of the suggested action: Dimension Question the judge considers Actionability Does the Insight tell a developer what to investigate, evaluate, or change next? Specificity Does it name concrete behavior, tools, or prompt elements rather than offer generic advice? Novelty Does it surface a pattern beyond an obvious dashboard signal? This is an estimate, not a measurement of what a team already knows. Correctness Is the claim supported by the supplied evidence? Severity calibration Does the assigned severity match the evidenced impact? Impact How consequential does the underlying issue appear, rather than just how well it is described? Fix specificity Does the proposed fix identify an exact asset or behavior to change? Fix applicability Is that proposed change plausibly on target for the issue? For example, a concrete next step earns a stronger actionability rating than generic advice. Severity calibration and impact are deliberately separate: a minor issue can have a well-calibrated severity label without being high-impact. Fix applicability is judged from the proposal and evidence; the fix is not executed as part of this scoring. Unlabeled results Results compiled from two recent benchmark runs cover 4,496 inputs and 40 generated Insights. Every emitted Insight in these selected snapshots was scored with the same judge rubric. Each Insight's overall score is the mean of its eight dimension scores; the table then averages those overall scores within each dataset. We do not combine datasets into one quality score. Dataset Inputs Insights scored Mean judge score (1-5) PUPA 901 5 3.53 FailSafeQA 1,101 11 3.57 Monitoring dashboard agent (internal) 1,342 4 3.88 tau2-bench 1,112 16 2.84 Synthetic scenarios 40 4 3.81 These are per-dataset snapshots, not a controlled comparison of dataset difficulty or pipeline versions. Small Insight counts and grading choices, such as grouped versus individual judging, make these protocol-specific diagnostics rather than stable absolute ratings. Automated judge scores are not precision or recall, human ratings, or measured improvements after applying a fix. The dimension-level scores make the weak spots more concrete. Fix specificity was the lowest-scoring dimension in four of the five snapshots, with means from 2.00 to 2.64. For tau2-bench, correctness was lowest at 2.25: a signal to review whether claims are supported by the supplied evidence. Making a next step more concrete and grounding a diagnosis more carefully are different improvement targets. What the public findings look like The examples below connect generated findings to concrete input evidence: an arithmetic inconsistency, a question/answer mismatch, and a payment allocation that exceeds the available balance. They are selected illustrations, not a representative sample of the 40 scored Insights. Figure 5. Three illustrative findings, with one checked input per finding. Titles and evidence summaries are editorial paraphrases. PUPA is a normalized QA record; FailSafeQA normalization pairs a perturbed question with the original answer, creating the displayed mismatch. Neither is a new agent execution. Tau2-bench shows a recorded tool interaction. These examples are not a representative quality sample. Public input sources: PUPA; FailSafeQA; tau2-bench. Controlled end-to-end tests: Can Insights find known issues? Dataset benchmarks are complemented by tests with healthy baseline agents and versions containing predefined defects. The framework generates traffic, runs Insights on the resulting traces, and compares the findings with the known issues and supporting evidence. It separately tracks detections, misses, unsupported findings, and duplicates. Cases with incomplete evidence remain unscored rather than counting as passes or misses. The September 23 hosted-agent report, used here as a concrete illustration, covered finance, travel, and support-ticket scenarios. Of 12 expected issues, 11 were scorable and 10 were detected. All three scorable healthy baselines had no confirmed unsupported findings. The figure shows the full outcome counts, including the missed and unscored cases. This end-to-end framework is separate from the 40-input synthetic-scenarios dataset in the unlabeled results. Figure 6. Controlled tests exercise healthy baselines and known defects through the Insights pipeline. The September 23 report records 10 detections among 11 scorable expected issues, one additional unscored issue, and no confirmed unsupported findings on three scorable baselines. No confirmed unsupported findings (noise) or duplicate findings were reported in the evaluated subset. This illustrative snapshot is not a representative product-wide rate. A broader view of quality Trace selection and rubric review are part of a broader quality framework. Category agreement is an exploratory benchmark diagnostic, not an assessment of the portal's category labels. Controlled scenarios also check for unsupported or duplicate findings. Figure 7. Five complementary quality questions. The labeled results above measure trace precision and trace recall; the unlabeled results assess findings with an LLM judge. Category agreement is an internal diagnostic, while controlled scenarios check noise and duplication. How we track quality over time Labeled benchmarks, unlabeled assessment, and controlled tests feed recurring quality reports and human investigation. Test inventories and assessment conditions can change, so daily scores are not automatically a comparable improvement trend. The reported results do not establish longitudinal recurrence or deduplication performance across runs. In the portal, Give feedback lets users report incorrect findings, categories, severity, grouping, or duplication. Start with scenarios whose expected failures and healthy controls are known. Track detection, trace precision, categorization, severity, distinctness, evidence grounding, and action quality instead of relying on one score. Review changes to data, models, prompts, and evaluation contracts as changes to the measurement system. Investigate weak results and newly reported failure patterns rather than tuning only for an aggregate. Keep human review in the loop, because benchmark labels and automated graders cannot determine business impact or remediation correctness. How practitioners should interpret an Insight Validate each Insight before acting on it. Microsoft Learn recommends this review sequence: Confirm the affected workflow, agent version, category, severity, and time. Open the highlighted traces and verify that the cited behavior is present. Compare problematic examples with healthy traces to test whether the grouping and likely cause are plausible. Decide whether the issue belongs to the agent, a tool, a model endpoint, a data source, or the platform. Turn confirmed recurring behavior into evaluation coverage, an optimization objective, owner routing, or a monitored no-action decision. An empty result does not prove that an agent is healthy, and a large linked-trace count does not prove business impact. Quality depends on representative traces, complete telemetry, a supported analysis model, and careful human validation. Get started Start with the Insights in Foundry documentation for prerequisites, portal steps, evidence-review guidance, SDK examples, pricing considerations, and preview limitations. Prerequisites include a connected Application Insights resource, recent representative traces, a supported GPT-5-or-newer Judge model deployment, and the required role assignments. Insight generation, including scheduled runs, uses your model deployment and can incur model charges. See the current documentation for the latest supported agents, models, regions, limits, pricing, and UI guidance. Python samples: on-demand Insights and scheduled Insights. Closing thoughts Agent quality work often starts with a simple question: what is repeatedly going wrong that we did not know to test? Insights in Foundry is designed to help teams answer that question with evidence-linked findings and a reviewable next step. Measuring those findings requires explicit definitions, diverse data, honest treatment of weak results, and human judgment where automated metrics stop. Labeled trace evaluation, unlabeled rubric assessment, and controlled end-to-end tests answer complementary questions. Newly observed patterns can then inform the next round of evaluation and review.486Views0likes1Comment