Forum Discussion
Tiered Calculation Formula Help
Thank you for the response! mathetes
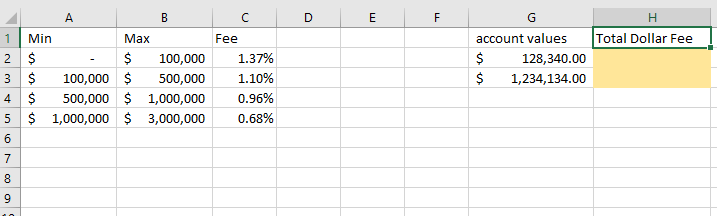
However, it is slightly off - the Total fee should equal $1681.74
the first 100,000 is charged 1.37% = $1370.00
the remaining $28,340 is charged 1.10% = 311.74
1370+311.74= 1681.74
Any thoughts on how to adjust?
Yes, I have an idea, but lets get the whole process clear then. (It wasn't clear to me that this was what you meant by "tiered" calculation. Maybe that's a technical term, and known to people in finance, or some other discipline; it seemed to me a perfectly clear interpretation could be that there are different percentages applied to different tiers based on account value. Full stop.)
If the account value is 7,654,321 is the fee calculated as
1.37% on the first 100K
1.1% on the next 400K
0.96% on the next 500K
0.68% on all the rest
?
Or is there some other pattern expected?
 pfmjeApr 01, 2020Copper Contributor
Yes! That is correct.
So.. For an account that is $85000 the fee would be $1164.50
and an account that is $147000 the fee woudl be $1887.00
Thank you for your help!
- Riny_van_EekelenApr 03, 2020Platinum Contributor
pfmje As an alternative, the attached workbook contains an example of a tiered calculation for whatever. Fees, bonus plans. You name it. Doesn't really matter what you calculate, as long as it's tiered. But you need to add a column (in this example, column C). Then you can use the formula in F to calculate the fee for the amount entered in E, in one, not very straight-forward but manageable, formula. For the fun of it, I also introduced a cap on the fee, so that fee will not keep increasing after the 3 million limit.
 Mach1351Feb 26, 2022Copper Contributor
I was also looking for this same formula for a similar application and was enthused to find your post. But when I apply your attached spreadsheet and its formulas, my results are slightly different than when I calculate them myself.
I had to change the values slightly to match my fee schedule, but the same principle applies:
0-$100,000 1.5%
the next $150,000 1.35%
the next $250,000 1.25%
the next $1,500,000 1%
Beyond at .75%
- mathetesApr 03, 2020Gold Contributor
I woke up this morning realizing that the solution to your request is to emulate the way the tax table works. So I've extended your table (and given it the range name "FeeTable" in the formula that results. Here's the new table:
And here's an example of the formula and an explanation of the components. Cell A11 contains the Account Balance for which you're going to calculate the appropriate fee and it is used in each of the VLOOKUP formulas, in each case just retrieving one of the data elements in that row of FeeTable.
=VLOOKUP(A11,FeeTable,3,1)
+
(VLOOKUP(A11,FeeTable,5,1)
*
(A11-VLOOKUP(A11,FeeTable,6,1)))
- The first VLOOKUP instance retrieves the info from column C, the "base fee" based on reaching that tier
- the second VLOOKUP retrieves the percentage to be applied
- and the third VLOOKUP retrieves the number from column F, which is then subtracted from the balance itself
- The formula then concludes by ;multiplying the excess $ by the applicable percentage and then adding that to what I've called the "base fee"
I've attached the resulting spreadsheet. Try it out. Have fun. Let me know if you have any questions.
- mathetesApr 02, 2020Gold Contributor
Before I take any more time delivering the formula (more likely formulas, plural) that you seem to be asking for, I want to make absolutely sure of the business requirement.
Each example you've given has been for account levels at the lower end of the spectrum. The question I asked you most recently had to do with a figure at the high end. Your answer, "yes," that it was to apply each successive level's percentage, in sequence, seemed to me to be unlikely (or "unwise"; take your pick). Why wouldn't that person with the multi-million dollar account just expect--and be given--the lowest rate?
I wrote my question thinking it was an absurd interpretation of "tiered calculation," so, frankly, was surprised when you said "Yes! That is correct." And then, the fact that you responded with examples that were at the bottom end, not taking my $7,654,321 figure and working it through the maze of laddered/tiered percentages, I wondered if you'd really read my question and thought about the implications of doing it that way.
The closest example that comes to mind of another kind of "tiered calculation" is that of the table in our Federal Income Tax instructions where it shows how to take your taxable income and figure the taxes owed. The table (there are various ones for single married, etc, but they all have a similar form not unlike the one you have presented), looks something like the example in the attached sheet. The good thing about that is that you're able (were you to want to write your own formula) to do a single VLOOKUP to go from your taxable income [comparable to your "account value" in this example] to a base rate plus additional percentage for anything above. That is, it's a single lookup value that delivers the entire set of info needed to finish the calculation.
You (your company, your organization) seems to be making this far more complicated than it needs to be, because you're asking for a computation at each level [along with the slightly constricting "it must be a single formula" expectation) when the objective is simply to come up with a descending percentage--the converse of the tax table's increasing percentage--based on an incoming figure to base it on.
So that's why I'm coming back. It IS possible to do what you're asking, but I wonder if it's really truly what you should be asking. I hope that makes sense. And if it really is what you're asking, I'd like to hear "why"--why is somebody insisting on doing it that way? To what extent has thought been given to doing it in a way more comparable to the tax table example attached? It IS far simpler to explain to clients AND far simpler to implement and maintain.