Forum Discussion
How to Resize Excel Plot Area
 Aug 24, 2018
Sub plotplot()
Dim w As Variant
Dim h As Variant
Dim crt_name As Variant

w = InputBox("Width in cm")
h = InputBox("Height in cm")
crt_name = InputBox("Chart name")

    ActiveSheet.ChartObjects(crt_name).Activate
    ActiveChart.PlotArea.Select
    Selection.Width = Application.CentimetersToPoints(w)
    Selection.Height = Application.CentimetersToPoints(h)

End Sub
This should do what you want.. if you add it as module and run it you should be asked for 3 things.. width in cm, height in cm and the chart name. You should be able to find the chart name by clicking it and the going to the Chart tools->layout ribbon. Default is Chart 1, Chart 2 etc.
Normal warnings, make sure you have a saved copy of your workbook before trying this, you cant undo actions taken by VBA..
Hope it does what you want.
- Cordillera94Nov 26, 2021Copper Contributor
Hello Philip, not sure if you're still around but I've encountered a problem with this.
I am making several charts, the Y and X axis need to be the same scale on each chart, and also the different charts need to be the same scale.However, if the charts are not the same absolute size, the scales are not the same.
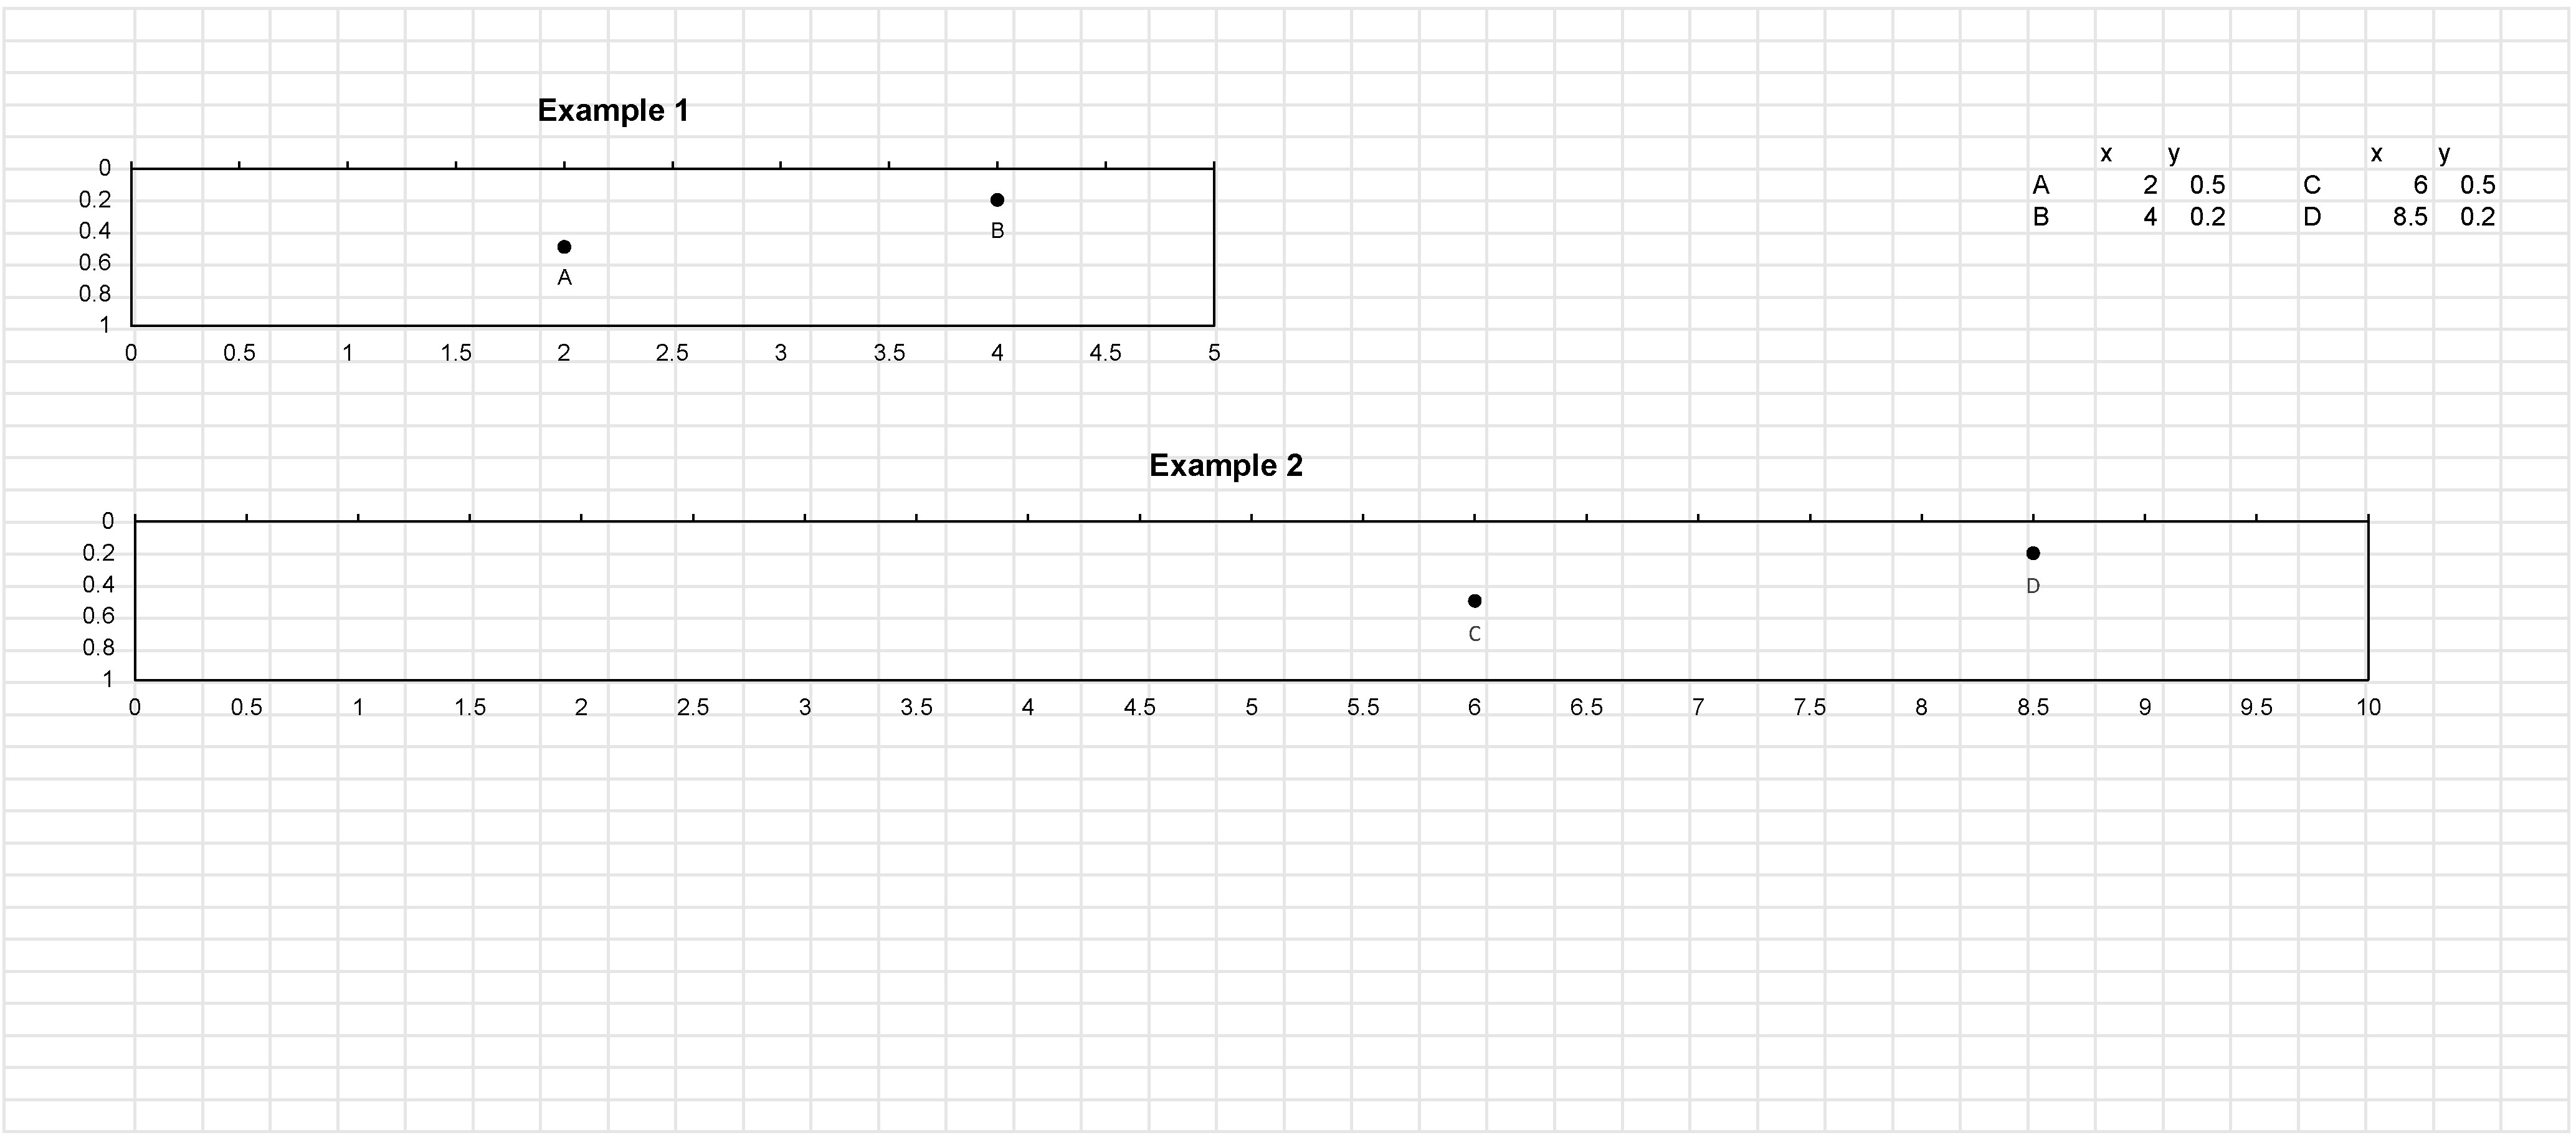
See the attached image for an example. Using your method, I set the height of both plots to 4cm. The width of Example 1 I set to 15 cm, and the width of Example 2 I set to double at 30 cm. Since the values of the X axis of Example 2 were also doubled, the scales of the X axis should be the same. However, as you can see they do not line up. Any solutions?
 Mike CurnowAug 24, 2018Copper Contributor
Philip,
thanks for the quick response.
Yes, it does work. This has to be done as the very last step in setting up the chart. If any other changes to the chart are made which affect the layout, then the plot area size is auto-adjusted!
You would think that after so many years there would be some way to achieve the same thing in the UI, along with an option to keep the plot area size fixed!
- Philip WestAug 24, 2018Steel Contributor
Haha, yes I know.. I was thinking the same thing when I was checking it worked..
Glad it did what you needed though.
I think I might add this one to my Personal.xlsb, seems like the sort of thing that might come in useful again one day.