Forum Discussion
Pier_The_Excelman
Jun 06, 2020Copper Contributor
histogram for a frequency
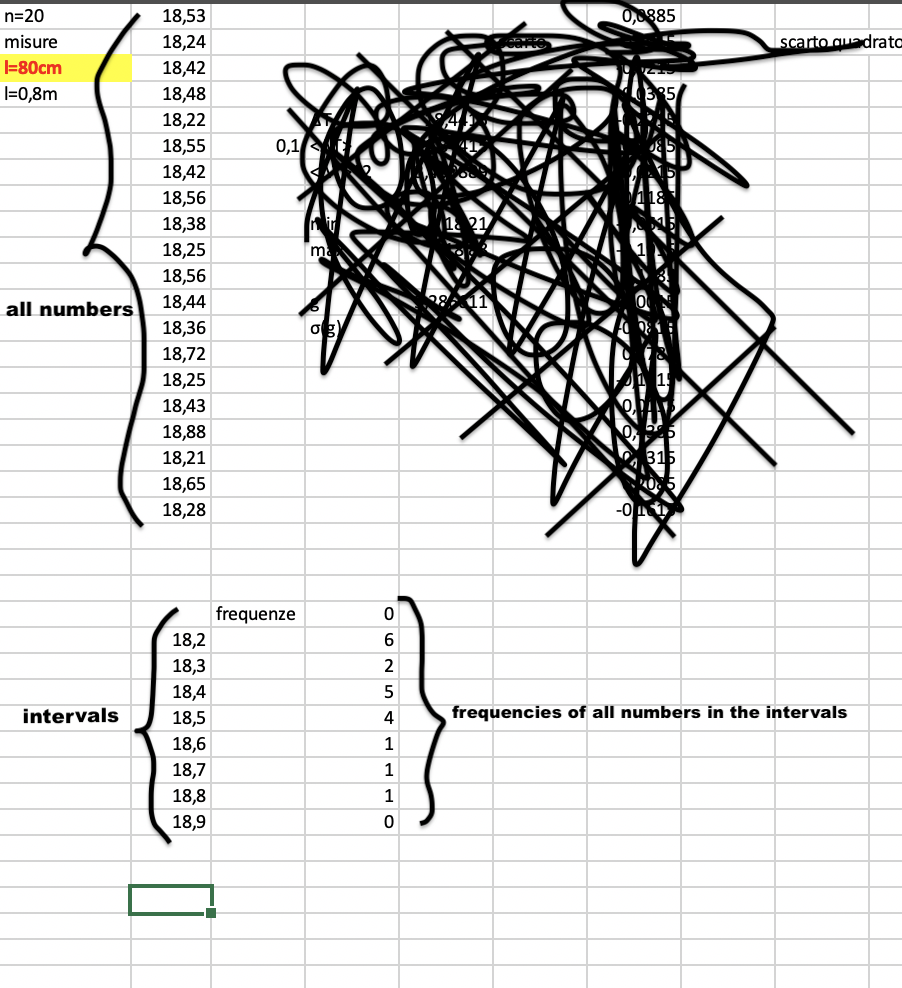
Good Morning, in my worksheet I have a series of numbers of which I have successively calculated their frequency in a series of intervals, but then I wanted to create the graph, in which in the ordin...
Riny_van_Eekelen
Jun 07, 2020Platinum Contributor
Pier_The_Excelman You should right-click on any of the blue columns in the graph and select the bottom option "Format Data Series" (in English). Your picture indicates you clicked on "Select Date" in the Chart Design ribbon.
Pier_The_Excelman
Jun 07, 2020Copper Contributor
Thank you! you really helped me a lot.Riny_van_Eekelen