Forum Discussion
Help with linking cell to a filtered spreadsheet
Hello! Struggling to find the best words to describe what I'm trying to do, but here's my best effort:
I am working in a workbook with two sheets. Sheet 1 = a spreadsheet of information about events that my firm has done (including the name of the practice group in charge, whether firm hosted or sponsored it, and which city hosted it). Sheet 2 = a chart of various statistics (for example, showing how many firm-sponsored and firm-hosted events were done in a given year, separated by both office and practice group. I am looking for a way to automatically link the statistics chart to the spreadsheet of data, so that when a new firm-sponsored event is added for the tax group in NY, for example, the numbers in the chart update accordingly. My problem is that I can't link directly to the spreadsheet because it first needs to be filtered for the appropriate practice group, office, and type of event before I can find the total number of events. Does this make sense, and does anyone know if it's possible to accomplish this?
You can use Excel Tables feature and for filters use the Table Slicers and then your chart data will be dynamic based on Excel Table Dynamic Range Feature (meaning adding or removing data automatically reflects in your chart and you do not have to modify your charts source range) and also you can use the Table slicers to put filters on and off.
3 Replies
- JamilBronze Contributor
You can use Excel Tables feature and for filters use the Table Slicers and then your chart data will be dynamic based on Excel Table Dynamic Range Feature (meaning adding or removing data automatically reflects in your chart and you do not have to modify your charts source range) and also you can use the Table slicers to put filters on and off.
 Taylor HatchCopper Contributor
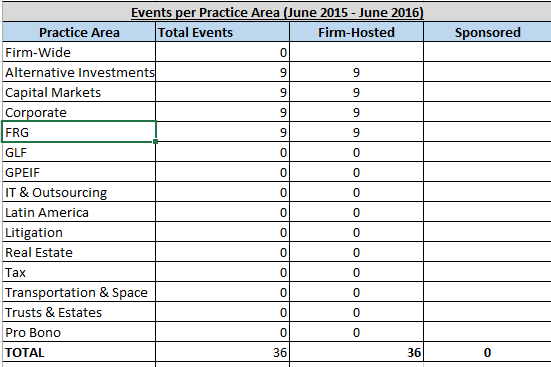
Thank you so much, Jamil! One follow-up question: I am trying to put formulas in my statistics chart that automatically reflect the total events hosted by each practice group (see the screenshot below). I tried doing this using the SUBTOTAL Function with my TableSlicers, but that makes my "Totals" change in the chart when I change the Table Slicer. For example, in the screenshots below when I filter for Alternative Investments, it says 7 total events, which I can then link to my statistics chart in Sheet 2. However, when I change the filter to Financial Restructuring, the total events in 9, which ends up changing ALL of the totals in my chart to 9. is there anyway to lock the formulas in the chart so that they only reflect the Subtotal of when Practice Area filter is a certain value AND Event type (Firm-Hosted v. Sponsored) is set to a certain value?
Thank you!
Taylor- JamilBronze Contributor
Thanks for the feedback.
you should not use the actual cell references in your subtotal formula.
you should use Excel Tables Structural References, so that it becomes dynamic.
plz see the example i uploaded here.