Forum Discussion
Kelvin May
May 20, 2018Copper Contributor
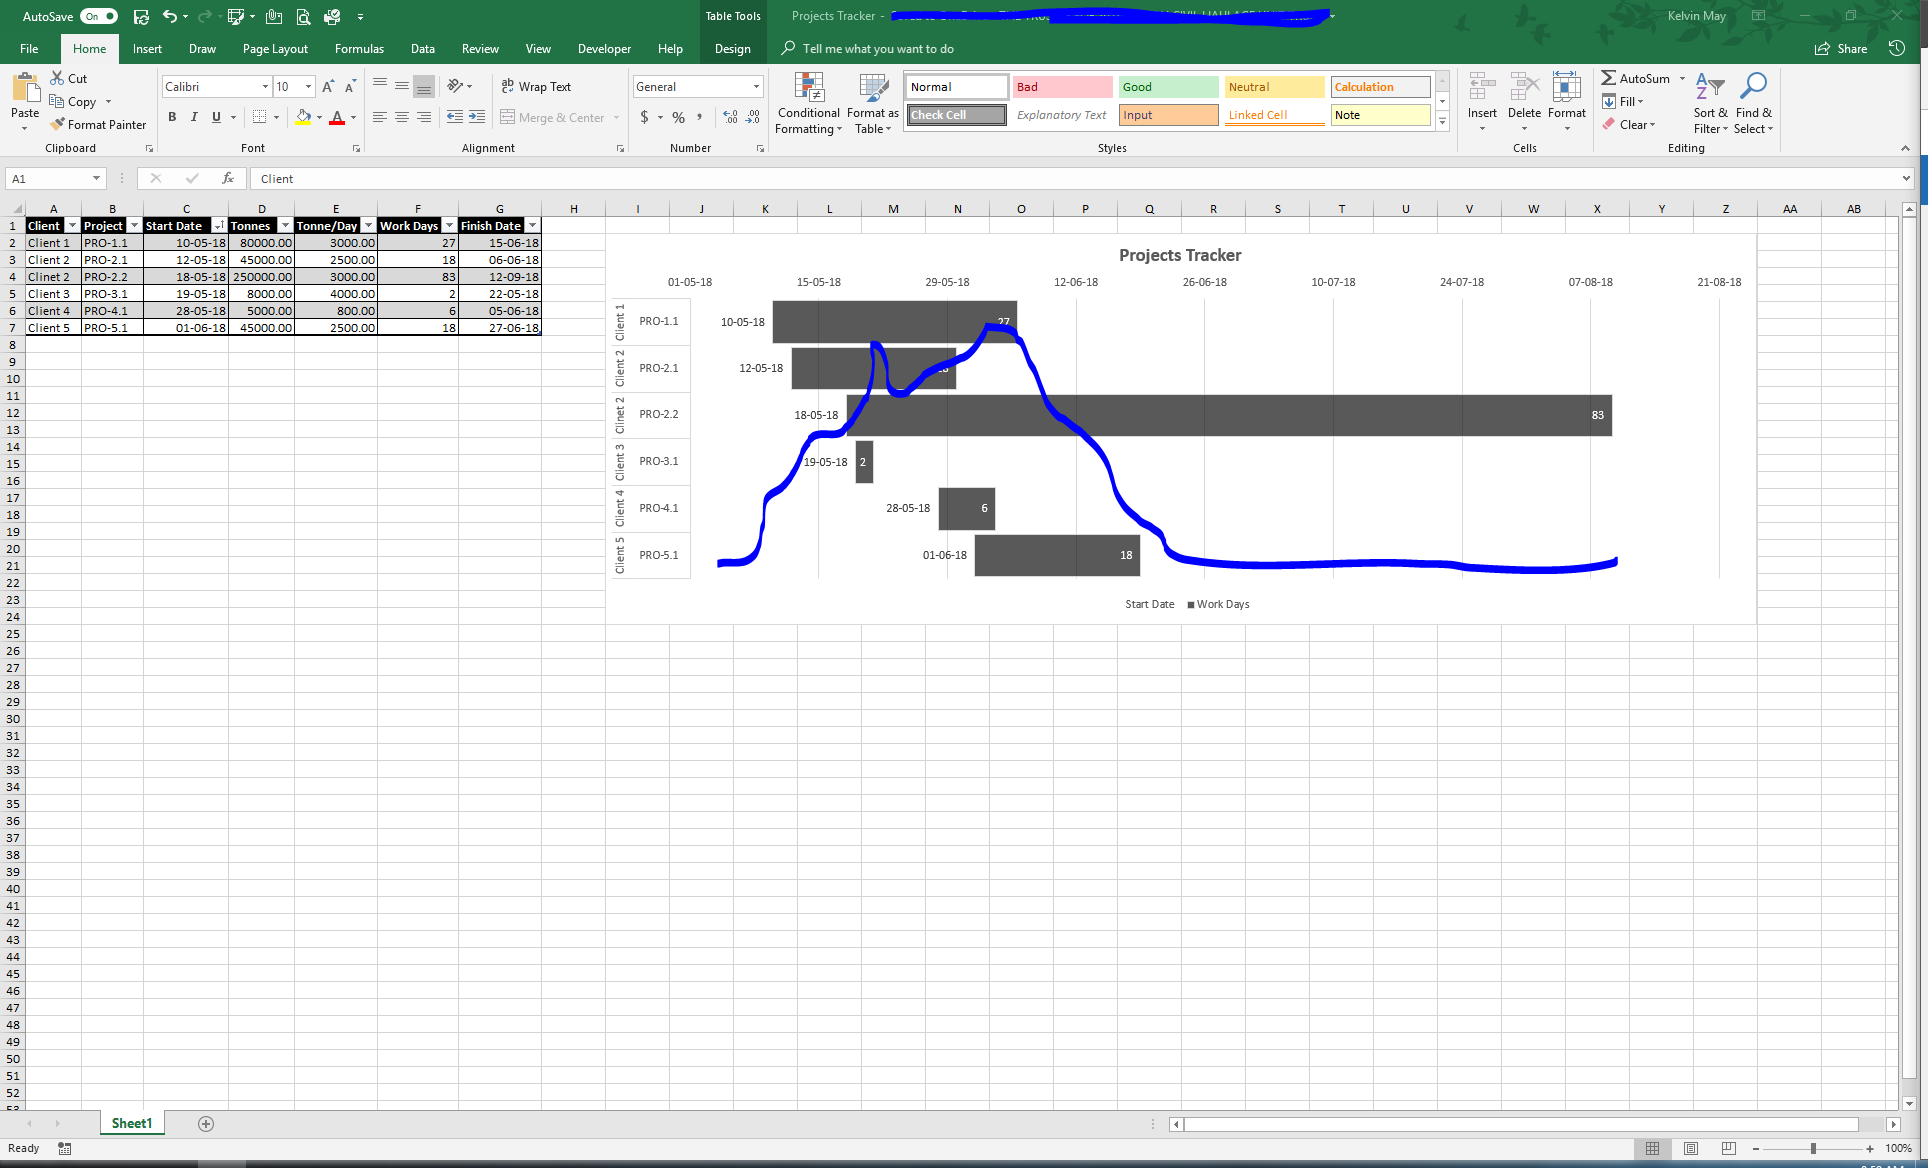
Gantt Chart with Cumulative Import Total
I've created a gantt chart with total length of my current projects. with each of these projects i have an estimated tonne per day import figure in my table. is there anyway to create a line graph with the cumulative total of import of these projects?
Attached is a snippet of what im trying to achieve. Anyone have an idea?
No RepliesBe the first to reply