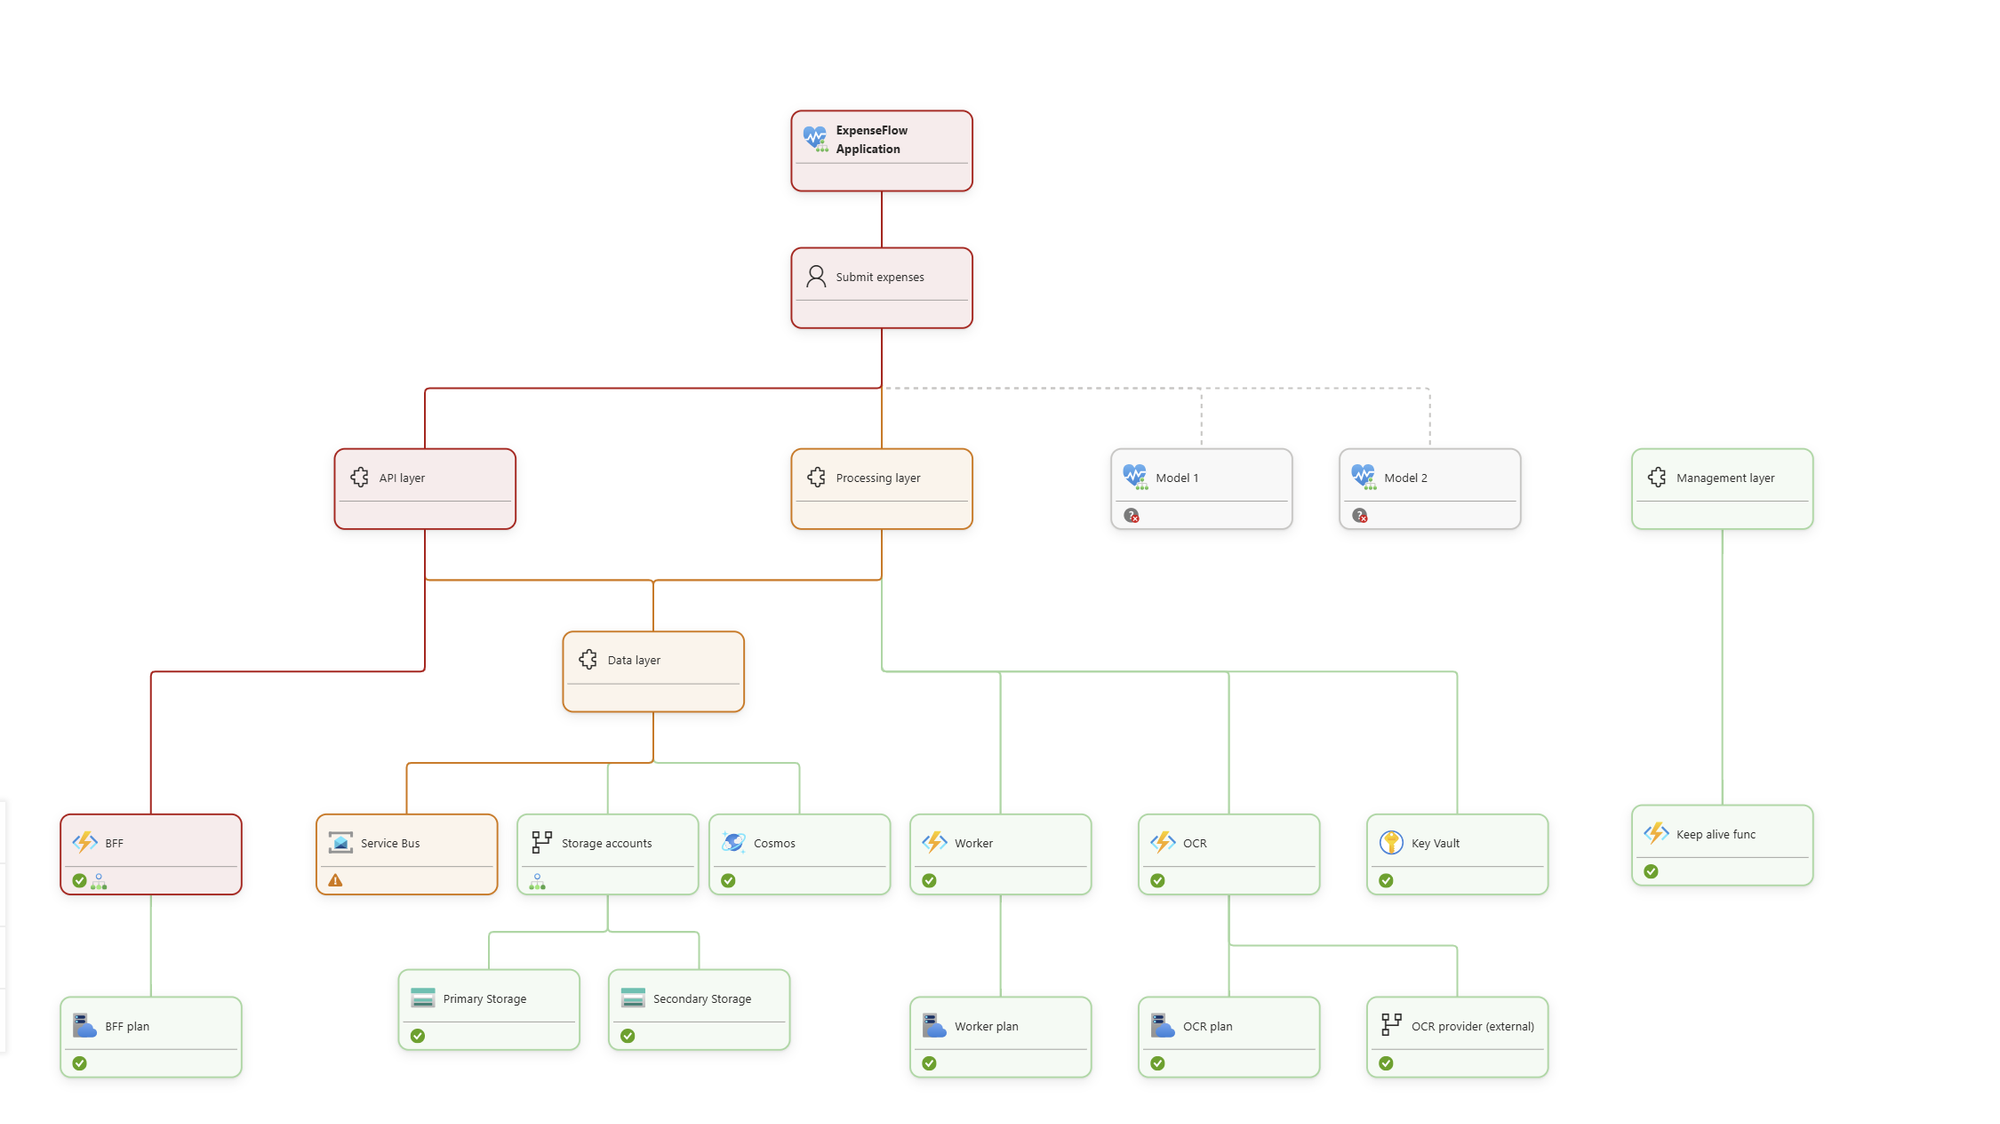
“Is my application healthy right now?” sounds like a simple question. But in modern cloud environments, finding the answer is rarely straightforward.
Applications typically comprise dozens of services, distributed across regions and teams, each generating its own metrics, logs, and alerts. When something goes wrong, engineers must manually piece together these fragmented signals to understand the impact, identify the root cause and determine which services are affected, all while alerts continue to pile up.
Today, we’re excited to announce the general availability of Azure Monitor Health Models, bringing a new, business-centric approach to observability in Azure Monitor.
Health models bring together your telemetry, workload architecture, and business context to produce actionable health states for the things that matter most: your applications, user flows, and services. Rather than simply highlighting noisy resources, they show whether your workload is healthy, which components are affecting it, and the extent of the business impact.
Why health models?
Traditional monitoring is resource-centric. Every VM, database, and endpoint has its own thresholds and fires its own alerts. That approach has two well-known problems:
- Alert fatigue. One underlying issue can set off a flood of alerts across dependent resources and there is often a lot of ambient alert noise.
- Missing context. An alert says a resource crossed a threshold. It doesn't say whether your workload or your customers are affected.
Health models add state-based monitoring in Azure Monitor. Each entity in your model, whether an Azure resource or a logical component such as a user flow, a microservice, or a business team, gets a health state that is calculated from its signals. That state then rolls up through the dependencies you define, so you get one health state for the whole workload.
With state-based monitoring you can:
-
See current health of every entity in the context of the overall workload.
-
Reduce alert noise by correlating many signals into a single health state.
-
Understand dependencies between components and how they affect overall workload health.
-
Focus investigations on business impact instead of individual resource thresholds.
What's available with health models?
🔍 Flexible, workload-centric discovery
Teams think about their systems in different ways: by application, by infrastructure fleet, or by telemetry. Health models let you build from the constructs you already use, and the model stays current as your architecture changes:
- Application Insights–based discovery for application-centric modeling built on your app topology
- Azure Resource Graph (ARG) discovery for scalable, query-based resource selection
- Service groups, including nested service groups, to scope workloads with the Azure-wide grouping construct
Additionally, Designer allows to introduce manual entities for logical components such as user flows, system flows, and code components.
📡 Smarter, faster health signals
Get useful health insights on day one without hand-tuning every threshold:
- Custom signals from Azure Monitor data: Metrics, Managed Prometheus, Log Analytics
- Resource Health as a default signal, so every model starts from a reliable baseline provided by the platform
- Recommended signals surfaced automatically from Azure service best practices and Azure Monitor Baseline Alerts (AMBA)
- Import existing alert rules as health signals to extend the alerting investments you already have
- Dynamic thresholds that adapt to normal behavior and cut down on manual threshold tuning
📊 Graph and Timeline views
- Graph view shows the current health of the entire workload and its dependencies
- Timeline view shows health over time, so you can see when an issue started, which regions and components were affected, and how long the impact lasted
- Drill down into any entity to find the exact signals that caused a health state change
🔔 Health-based alerting
Alert on what matters: an unhealthy entity, or degraded health that represents business impact across several dependencies. Health model alerts are part of the existing Azure Monitor alerting experience and use the same action groups for notifications and automation. You can also see all alerts for a health model in one place and start troubleshooting from there.
🛠️ Infrastructure as code from day one
Define and deploy entire health models alongside your workloads using the tooling you already use:
How it works: from signals to business health
- Discover the resources that make up your workload (Application Insights, ARG query, or service group).
- Signals are applied automatically (Resource Health + recommended signals). Import alert rules or add custom signals as needed.
- Model your architecture by adding logical entities and dependencies.
- Monitor and act with Graph and Timeline views and health-based alerts routed through your existing action groups.
Get started today
You can set up health monitoring for your workload in a few minutes:
- Create Your Health Model
In the Azure Portal navigate to Azure Monitor / Health Models and select create. Add a discovery rule using an Application Insights resource or an Azure Resource Graph query. For signals use recommended ones or import existing alert rules on Azure resources. - Customize to Fit Your Needs
In many cases the default health signals may suit your needs, but we support customization as well. Add metrics or add log queries by associated Log Analytics workspace or Azure Monitor workspace. Create health alerts and connect them to your existing action groups. - Investigate and Act
Use the health timeline and alerting integration to quickly assess impact, isolate issues, and take action - all from a single pane of glass.
Pricing and availability
Pricing information is available at Azure Monitor Pricing page
Supported Azure regions Product Availability by Region
We want to hear from you: share your feedback here

 Microsoft
