azure health model
1 TopicReliability Starter Kit: SLIs, Health models, and SRE Agent
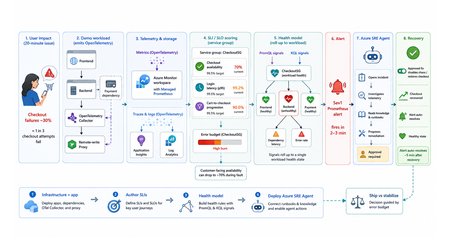
TL;DR This walkthrough uses a small e-commerce demo app to show how Azure Monitor can measure a user journey with service level indicators (SLIs) and service level objectives (SLOs), roll those results into a health model, and have the Azure SRE Agent investigate the alert. When the demo intentionally breaks, about one in three checkout attempts, a Sev1 Prometheus alert fires in about 2 to 3 minutes, and the agent opens an incident from that alert within a minute or two. Clone the kit, run four steps in order, and watch the failure go from alert to proposed fix on your own subscription. Who this is for Site reliability engineers who own on-call and want alerts that mean something. Platform engineers wiring observability for other teams. Application developers who need to prove a service is healthy before they ship. Engineering leaders deciding when to ship and when to stabilize. What the user felt, and what the system reported In the demo app, a fault makes about one in three checkout attempts fail for twenty minutes. The table below shows how that same incident can look to customers and to the platform. What the customer experienced What the system reported Payment failed, retried twice, gave up CPU 40%, memory normal, every instance up Cart abandoned, no order placed No alert fired on slidemo-be-<suffix> Called support: "it works fine for us" Average latency 180 ms, inside target Every statement in the right column is accurate. None of them explains the left column. The platform was answering a resource question: are the apps running? Users had a different question: can I complete checkout? A service level indicator (SLI) closes that gap. It is one number: successful checkouts divided by attempted checkouts, as a percentage. It changes when checkout succeeds or fails, not when CPU or memory changes. Set a target for that number, say 99.5%, and the target is your service level objective (SLO). With both in place, the questions that matter answer themselves: The question What the SLI tells you Is this real? Checkout availability is 70%, against a 99.5% target How bad is it? Most of a week's error budget is gone in ten minutes What broke? The checkout journey is failing, so responders start in the right place Azure Monitor computes that SLI for you. Azure Monitor health models roll it up into one workload state. The Azure SRE Agent turns the right alert into an investigation and a proposed fix. The hard part is the wiring between them: which metric feeds the indicator, which indicator feeds the health signal, and which alert source actually reaches the agent. This kit ships that wiring, as scripts you can run, against a workload you can break on purpose. What the kit ships The kit is a self-contained reference implementation. It deploys its own demo workload, instruments it, and connects five stages end to end: telemetry is emitted, stored in Azure Monitor, scored into SLIs and rolled up by a health model, turned into an alert the Azure SRE Agent acts on, and finally weighed against the error budget. It is opinionated on purpose: one workload, one service group, three SLIs, one health model, one agent, one proven trigger. The four services it wires together Service What it does Layer Azure Monitor SLIs and SLOs on a Service Group You name the metric that counts as good and the one that counts as total. It computes the ratio on a schedule, compares it to your target, and tracks the error budget. The score belongs to a service group, which is how Azure Monitor names your application as a whole, so the number describes the app rather than any one resource. This post calls that scoring component the SLI engine. Measurement Azure Monitor health models A dependency graph where every node carries its own health state. Each node is an entity, either an Azure resource or an application component discovered from Application Insights. You attach signals to an entity (a PromQL query, a KQL query, or a platform metric) with degraded and unhealthy thresholds, and the worst child state rolls up into one state for the workload. Aggregation Azure SRE Agent Takes Azure Monitor alerts as incidents and runs the first-pass investigation: queries the relevant metrics, logs, and recent deployments, forms a root-cause hypothesis, and proposes a remediation. It never applies a change without human approval. The kit deploys it read-only, so it investigates freely and has to ask before it changes anything. Action The telemetry plane OpenTelemetry (OTel) in the apps, a collector, an Azure Monitor workspace running managed Prometheus for metrics, and Application Insights backed by a Log Analytics workspace for traces and logs. One workspace holds both the raw metrics and the SLI results, so everything reads a single consistent set of numbers. Foundation What ships in the box Four steps you run in order: infrastructure and the app, SLIs on a service group, the health model, and the Azure SRE Agent. Runnable PowerShell scripts for every step, all idempotent, all with teardown. A demo workload with a chaos endpoint, so you can break checkout on demand. Validated console transcripts in the lab guides, so you know what "working" looks like before you run it. Everything is in this repo. The diagram shows how the pieces hand off to each other: Walking the flow: Emit. The apps emit OpenTelemetry counters and histograms. The Collector splits the stream two ways: metrics go to a remote-write proxy that attaches a Microsoft Entra ID token, and traces and logs go to Application Insights, backed by a Log Analytics workspace. Store. The Azure Monitor workspace ingests the metric series. Prometheus recording rules pre-aggregate them into the exact label shape the SLI engine can filter on. Score and roll up. Three SLIs on the CheckoutSG-<suffix> service group compute good over total, compare against a 99.5% baseline, and write their evaluated results back into the same workspace. The health model reads those stored results as PromQL signals and the failure data as a KQL signal, then rolls the worst child state up to the workload root. Alert and act. A Prometheus alert rule on the workspace fires Sev1 into the action group and into the Azure SRE Agent's incident source. The agent reads its uploaded knowledge base, correlates against the traces and logs, and proposes a runbook. After you approve it, the remediation runs and the agent verifies recovery. The health model's own health-state alerts reach the action group for human triage only: they fire in rg-healthmodel-demo, which is not the agent's incident-ingestion scope, so they never become incidents. Decide. The error budget gates the release call: ship when healthy, stabilize when burning. The demo workload The workload is a small e-commerce store, deliberately boring so the reliability mechanics are the interesting part. Component What it is What it does Frontend Node.js on App Service Linux Customer site, proxies /api/* to the backend Backend Node.js on App Service Linux Serves /login and /checkout, calls the payment dependency, emits the SLI source metrics Payment dependency Simulated, inside the backend Exercised through checkout, never called directly OpenTelemetry Collector Container web app Receives OpenTelemetry Protocol (OTLP) traffic, fans traces to Application Insights and metrics toward Prometheus remote write Remote-write proxy Node.js on App Service Linux Attaches a managed identity token so remote write works on App Service, which has no Instance Metadata Service (IMDS) endpoint Azure Monitor workspace Managed Prometheus Both the SLI source and the SLI destination Application Insights + Log Analytics workspace Traces and logs The investigation surface the agent correlates against The three source metrics are the raw material for every SLI in the kit: Metric Type Labels Feeds http_server_requests_total counter service, route, status_class Checkout availability (good is status_class="2xx") http_server_request_duration_seconds histogram service, route Login latency (good is under 300 ms) dependency_calls_total counter dependency, status Payment dependency availability The chaos endpoint Use the backend admin endpoint to inject failures or latency: POST {backend}/admin/chaos Set service to "login" or "checkout", then use errorRate and extraLatencyMs to shape the fault. Do not pass "payment": the payment dependency is exercised through checkout, so "payment" returns HTTP 400. Before you start: prerequisites Start by cloning the kit: git clone https://github.com/jvargh/azure-reliability-starter-kit.git cd azure-reliability-starter-kit Every command in this post runs from that repository root. No step asks you to change directory. Open two terminals there: the traffic generator described later in "Start traffic and leave it running" blocks its shell for the full run. Two things the table cannot tell you. Every step creates role assignments, so you need a subscription where you can grant roles, not just create resources. And the App Service plan defaults to P1v3, which is what you want if you also care about Azure Resource Health signals in the health model; pass -PlanSku B1 for a cheaper run, and use the Clean up section when you are finished. Requirement Value used in this kit Subscription role Owner, or Contributor plus User Access Administrator Shell PowerShell 7+ (pwsh), two terminals CLI Azure CLI, signed in (az login) Tooling (Step 4) git, jq, Python 3 with PyYAML on PATH (Phase 2 can install the last three) Resource providers Microsoft.Monitor, Microsoft.Web, Microsoft.CloudHealth, Microsoft.App Network Outbound to *.azuresre.ai Workload region eastus2 (any region works) Health model region centralus (region limited, so the kit pins it) Azure SRE Agent region eastus2 (check the current region list before changing it) Prefer to paste the whole sequence and read afterwards? The full command sequence is consolidated later in "Try it now." Step 1: stand up the infrastructure and the app Folder: 01-sli-demo/infra Prerequisites: everything in the table above. infra-deploy.ps1 registers the required resource providers itself, so you do not need to pre-register them. What infra-deploy.ps1 does infra-deploy.ps1 is one script that takes you from an empty subscription to a running, instrumented workload: Creates the resource group (rg-sli-demo) in your chosen location, or leaves it alone if it already exists. Registers the required resource providers. Deploys the Bicep in main.bicep, which composes four modules: monitoring (Azure Monitor workspace, Log Analytics workspace, Application Insights), identity (the user-assigned managed identity plus its Monitoring roles), the App Service plan and four web apps, and the ingestion wiring for the workspace. Zip-deploys the three Node.js applications (backend, frontend, remote-write proxy) with Oryx building each one on the platform. Prints every value the later steps need: the frontend URL, the Azure Monitor workspace name, the managed identity client id, and the suggested service group name. az login az account set --subscription "<SUBSCRIPTION_ID>" ./01-sli-demo/infra/infra-deploy.ps1 -ResourceGroup rg-sli-demo -Location eastus2 A clean run, trimmed: PS ...\azure-reliability-starter-kit> ./01-sli-demo/infra/infra-deploy.ps1 -ResourceGroup rg-sli-demo -Location eastus2 ==> Ensuring resource group rg-sli-demo (eastus2) ==> Registering required resource providers ==> Deploying infrastructure (Bicep) ==> Deploying app code (backend, frontend, proxy) ==> Deploying code to slidemo-be-<suffix> Status: Build successful. Time: 52(s) Status: Site started successfully. Time: 87(s) ... ==> Done. Resources deployed and code pushed. Frontend: https://slidemo-fe-<suffix>.azurewebsites.net Backend: https://slidemo-be-<suffix>.azurewebsites.net Azure Monitor WS: slidemo-amw-<suffix> Service Group name: CheckoutSG-<suffix> (add rg-sli-demo as a member) Keep <suffix> handy. Every later script auto-discovers it from the deployment outputs, but you will see it in resource names throughout. Smoke-test it with infra-validate-lab.ps1 infra-validate-lab.ps1 reads the deployment outputs and asserts the deployment succeeded, all four App Services are running, and every health and functional endpoint responds (including the frontend-to-backend proxy path). It prints [PASS], [FAIL], or [SKIP] per check and exits non-zero on any failure, so you can gate a demo or a pipeline on it. Run it with no optional switches at this point. The metric and SLI checks depend on traffic and on Step 2, neither of which has happened yet. ./01-sli-demo/infra/infra-validate-lab.ps1 -ResourceGroup rg-sli-demo Validating SLI/SLO demo infrastructure in 'rg-sli-demo'... == Prerequisites == [PASS] Azure CLI signed in [PASS] Resource group 'rg-sli-demo' exists == Deployment == [PASS] Deployment 'main' found [PASS] Deployment provisioningState (Succeeded) ... == Health endpoints == [PASS] backend /healthz (GET -> 200) [PASS] frontend /healthz (GET -> 200) [PASS] proxy /healthz (GET -> 200) ... == Functional endpoints == [PASS] frontend /api/checkout (GET -> 200) ... The two optional switches, -IncludeMetrics and -IncludeSlo, are staged deliberately. Switch -IncludeMetrics needs live traffic, and -IncludeSlo looks for the recording-rule group that Step 2 creates, so both belong at the end of Step 2 (see Re-validate, now with the metric and SLI checks). A [FAIL] means a resource is missing; a [SKIP] means it exists but has no data yet. Start traffic and leave it running Run this in a second terminal at the repository root. It blocks the shell for the full duration, and every remaining step needs it flowing. pwsh -File ./01-sli-demo/load/generate-traffic-all.ps1 -ResourceGroup rg-sli-demo -Rps 30 -DurationSeconds 3600 generate-traffic-all.ps1 auto-discovers the frontend URL from the main deployment output (falling back to the App Service whose name contains -fe-), then drives a mixed load defaulting to 30 requests per second with a 70% checkout weight. It requires PowerShell 7 or later. PS ...\azure-reliability-starter-kit> pwsh -File ./01-sli-demo/load/generate-traffic-all.ps1 -ResourceGroup rg-sli-demo -Rps 30 -DurationSeconds 3600 Resolved target from 'rg-sli-demo': https://slidemo-fe-<suffix>.azurewebsites.net Driving ~30 rps against https://slidemo-fe-<suffix>.azurewebsites.net checkout 70% (also drives payment dependency) | login 30% duration: 3600 s [1188s] checkout: sent=11032 ok=10977 fail=23 | login: sent=4777 ok=4772 fail=1 | payment via checkout Keep traffic running before you author SLIs. The SLI query validator needs the Azure Monitor workspace to index metric dimensions first, and that only happens after metrics flow. Histogram-derived dimensions index later than plain counters, so starting traffic early avoids false validation errors such as status_class not being available yet. Step 2: author the SLIs Folder: 01-sli-demo Prerequisites: Step 1 deployed and green in infra-validate-lab.ps1, and generate-traffic-all.ps1 still running in its own terminal, for the indexing reason in the callout above. What deploy-sli.ps1 does deploy-sli.ps1 automates the SLI authoring flow: Stage What the script does Why it matters Read context Reads the Azure Monitor workspace, managed identity, and suggested service group name from the main deployment outputs. Keeps later commands tied to the deployed workload. Prepare metrics Deploys six Prometheus recording rules. Four feed the SLIs; two (sli:http_request_latency_p95:5m, sli:http_request_latency_avg:5m) support dashboards and the health model. The SLI engine can filter dimensions on recording-rule output, not raw remote-written series. Create scope Creates CheckoutSG-<suffix>, adds rg-sli-demo as a member, and sets the default managed identity and Azure Monitor workspace. Puts the frontend and backend in SLI scope. Wait for data Waits up to -MetricWaitMinutes for sli:http_requests:rate5m and sli:http_request_latency_total:rate5m, then retries SLI creation for up to -SliIndexingRetryMinutes while dimensions index. Avoids false validation failures while metric metadata catches up. Author SLIs Creates the three SLIs and polls until each reports Succeeded. Produces the customer-facing reliability measurements. Wire alerts Creates ag-sli-demo and the linked baseline, fast-burn, and slow-burn alerts for each SLI. Makes the SLIs visible with their alert configuration. The three SLIs it creates. All three sit at a 99.5% baseline over a 7 rolling-day window: SLI Type Good over total CheckoutAvailabilitySLI Availability 2xx checkout requests over all checkout requests LoginLatencySLI Latency Login requests under 300 ms over all login requests PaymentDependencySLI Dependency availability Successful payment calls over all payment calls Run this script from the repository root after traffic has started. It creates the recording rules, service group, SLIs, and linked alert configuration in one pass. ./01-sli-demo/infra/sli/deploy-sli.ps1 -ResourceGroup rg-sli-demo A successful run should show these checkpoints: PS ...\azure-reliability-starter-kit> ./01-sli-demo/infra/sli/deploy-sli.ps1 -ResourceGroup rg-sli-demo ==> Reading deployment context AMW : .../Microsoft.Monitor/accounts/slidemo-amw-<suffix> Identity : .../userAssignedIdentities/slidemo-id-<suffix> ServiceGroup : CheckoutSG-<suffix> ==> Deploying Prometheus recording rules Succeeded ==> Creating Service Group Service Group: Succeeded ==> Adding resource group as a Service Group member Member relationship submitted. ==> Enabling monitoring on the Service Group Default workspace and identity set. ==> Waiting up to 10 min for recording-rule metrics Counter metric present: True Latency total metric present: True ==> Creating SLIs CheckoutAvailabilitySLI created LoginLatencySLI created PaymentDependencySLI created ==> Verifying SLI provisioning CheckoutAvailabilitySLI Succeeded LoginLatencySLI Succeeded PaymentDependencySLI Succeeded The result is a service group view with three SLIs: checkout availability, login latency, and payment dependency availability. Each one uses the same 99.5% baseline over a 7 rolling-day window, and the list shows both the current SLI value and the remaining error budget. The guided design method: sli-run-lab.ps1 Automation gets you three SLIs. It does not teach you how to choose them for your own application. That is what sli-run-lab.ps1 is for: an eight-phase interactive method that walks from telemetry to a design checklist, prompting for the judgement calls and computing everything else. Phase Name What you get 1 Environment setup and access checks Resolved workspace, identity, service group, Prometheus endpoint 2 Enumerate ALL user journeys journey-inventory.csv built from live telemetry 3 Extract the CRITICAL journeys Criticality scores and a shortlist 4 Data collection (per critical journey) Dimensions confirmed, performance measured, continuity checked 5 Consolidate into the design checklist design-checklist.csv, one row per SLI 6 Author the SLIs in the portal The wizard, or deploy-sli.ps1 7 Validate end-to-end Published :value series cross-checked against your own math 8 Lab completion checklist What "done" looks like Phase 4 is where the evidence gets collected, per journey: ---- checkout ---- ==> 4.1 - Confirm the source metric and required dimensions exist checkout / 2xx checkout / 5xx ==> 4.2 - Measure CURRENT performance (evidence for the target) Measuring over the last 7d... Measured (7d): 99.796% ==> 4.3 - Confirm the signal is continuous (no silent gaps) Checking the last 6h in 5m buckets... Continuous: yes (no empty 5m buckets). ==> 4.4 - Write the good / valid definition (the contract) ==> 4.5 - Data-collection worksheet (fill one per critical journey) At target 99.5% the error budget is 0.5% (currently ~0.41x used). Recorded worksheet for CheckoutAvailabilitySLI. Phase 7 proves the engine is not just configured but actually publishing, and cross-checks its arithmetic against yours: ==> 7.2 - Confirm the engine publishes results Authored SLIs: CheckoutAvailabilitySLI, LoginLatencySLI, PaymentDependencySLI ---- CheckoutAvailabilitySLI ---- engine value = 99.6914 ==> 7.3 - Cross-check the engine against your own math 100*good/total = 99.6914 (internal consistency) ... ---- LoginLatencySLI ---- engine value = 100.0000 Right after you restart traffic, Phase 7 will report "No published :value series yet." That is the engine waiting on evaluation cycles, not a failure. The portal's SLI status and error budget columns lag a further 30 to 60 minutes. You can validate the same thing yourself with one PromQL (the Prometheus query language) query against the workspace: 100 * sum(sli:http_requests:rate5m{service="checkout",status_class="2xx"}) / sum(sli:http_requests:rate5m{service="checkout"}) Re-validate, now with the metric and SLI checks With traffic flowing and the recording rules deployed, the two switches you skipped in Step 1 now have something to assert against. This is the full 22-check run: ./01-sli-demo/infra/infra-validate-lab.ps1 -ResourceGroup rg-sli-demo -IncludeMetrics -IncludeSlo == Metric pipeline == [PASS] Prometheus query token acquired [PASS] Source metrics present (http_server_requests_total series=3) [PASS] Recording-rule group deployed (slidemo-sli-recording-rules) [PASS] Recording-rule metrics present (sli:http_requests:rate5m) Summary: 22 passed, 0 failed, 0 skipped Before you move to Step 3, give the SLI engine 30 to 60 minutes to publish evaluated values into the workspace. The health model reads those stored results rather than recomputing them, so starting Step 3 too early gives you a graph of Unknown states and nothing to debug. Step 3: roll it up with an Azure Monitor health model Folder: 02-healthmodel-demo Prerequisites: the three SLIs authored and publishing values, and generate-traffic-all.ps1 still running. What healthmodel-run-lab.ps1 does healthmodel-run-lab.ps1 is a six-phase runner that calls two write scripts: src/healthmodel-deploy.ps1 creates the model, and src/configure-signals-alerts.ps1 attaches signals and alerts. Phase Name 1 Environment setup and access checks 2 Create the health model 3 Discover the app as entities 4 Map the SLIs to entities (from the sli label) 5 Configure signals and alerts 6 Validate end-to-end ./02-healthmodel-demo/healthmodel-run-lab.ps1 Phase 2 creates the health model (hm-checkout-demo) with a system-assigned identity under the Microsoft.CloudHealth provider at API version 2026-05-01-preview, grants that identity Monitoring Reader on the workload resource group, binds an authentication setting, and creates the discovery rules. Why there are two discovery nodes The kit creates two discovery rules, not one, because they answer different questions: Azure Resource Graph discovery imports the workload's Azure resources (the four App Services and the plan) as entities. This is the infrastructure view: concrete resource ids the Azure SRE Agent can act on. Application Insights topology discovery imports the application's own component map (sli-demo-frontend, sli-demo-backend) and their observed dependencies. This is the application view, which survives resource renames and shows call relationships that Resource Graph cannot see. The model uses a "worst of" rollup: if any child entity is Unhealthy, the parent moves to Unhealthy too. Discovery is not instant; it runs every five minutes, so wait 5 to 10 minutes after Phase 2 before checking for entities in Phase 3. The critical detail: tap the stored SLI results The health model does not recompute your SLIs from raw metrics. It reads the stored SLI result series that the SLI engine writes back into the Azure Monitor workspace. That is what keeps the model's numbers identical to the SLI blade's numbers. Those series are named ns::<servicegroup-lowercase>/m::<sli-lowercase>:value (with :good and :total alongside). The :: and / characters make that invalid as a bare metric token, so the selector has to be pinned with __name__ equality: last_over_time({__name__="ns::checkoutsg-<suffix>/m::checkoutavailabilitysli:value"}[1h]) Thresholds and the one-hour lookback. The one-hour last_over_time lookback is what keeps a brief gap in traffic from reading as an error: the signal returns the most recently published value instead of an empty result, and only goes Unknown when the SLI has published nothing for a full hour. Thresholds on that signal are degraded below 99 and unhealthy below 95, which means a 99.9% reading correctly stays Healthy instead of tripping on a "below 100" rule. ==> 5.1 - Invoking src/configure-signals-alerts.ps1 ==> Ensuring AMW query roles (Monitoring Data Reader + Monitoring Reader) for the health model identity Monitoring Data Reader assigned Monitoring Reader assigned ==> Discovering published SLI result series in the AMW CheckoutAvailabilitySLI: found LoginLatencySLI: found PaymentDependencySLI: found ==> Checkout (backend): slidemo-be-<suffix>: Checkout availability SLI (AMW), Payment dependency SLI (AMW) ==> Login (frontend): slidemo-fe-<suffix>: Login latency SLI (AMW) ==> App Service plan tier: PremiumV3 (Resource Health supported: True) ==> Uptime signal (Resource Health) on 'slidemo-promproxy-<suffix>' ==> Linking the model root to each discovery node so health rolls up root -> appinsights-topology updated root -> resource-graph updated Phase 6 reads the resulting states and confirms the numbers match: ==> 6.1 - Entity health states and attached SLI signals Entity Health SliSignals ------ ------ ---------- slidemo-be-<suffix> Healthy Checkout availability SLI (AMW), Payment dependency SLI (AMW) slidemo-fe-<suffix> Healthy Login latency SLI (AMW) Checkout/Login workload Healthy hm-checkout-demo Healthy ... -- 6.2 stored :value series -- checkoutavailabilitysli = 99.82 loginlatencysli = 100 paymentdependencysli = 99.82 Tier awareness matters. Azure Resource Health is unsupported on Free and Shared App Service plans, so configure-signals-alerts.ps1 reads the plan SKU and adapts: Basic and above use the built-in Resource Health signal, while Free and Shared fall back to the Http2xx platform metric on the sites and CpuPercentage on the plan. Without that fallback, every supporting entity reads Unknown on a cheap plan and the model looks broken when it is not. Step 4: deploy the Azure SRE Agent Folder: 03-sre-agent Prerequisites: Microsoft.App registered on the subscription, Owner or User Access Administrator so the deployment can create role assignments on both managed resource groups, outbound access to *.azuresre.ai for the agent data plane, and git, jq, and Python 3 with PyYAML available on PATH. Phase 2 can install the last three for you through the templates' Install-Prerequisites.ps1, so a clean machine only needs git in advance. What sre-run-lab.ps1 does sre-run-lab.ps1 runs six phases: Phase Name 1 Environment and access checks 2 Acquire the Azure SRE Agent IaC templates 3 Generate the agent config from the recipe 4 Deploy the agent 5 Validate the agent is up 6 Wire inputs from the health model and SLI 6.1 Alerts on the target resource groups 6.2 Action group (human notification path) 6.3 Confirm the agent target scope covers both resource groups 6.4 Apply response plans (incident filters) so alerts are auto-handled 6.5 Final data-plane verification 6.6 Upload knowledge (app topology and remediation runbooks) Phase 2 pulls the official Infrastructure as Code templates from github.com/microsoft/sre-agent. Phase 3 generates config from the azmon-lawappinsights recipe, which wires Azure Monitor alert response together with Log Analytics and Application Insights connectors, safety defaults, and a daily health check. Phase 4 deploys Microsoft.App/agents (API version 2025-05-01-preview) plus a user-assigned managed identity, a Log Analytics workspace, Application Insights, and role assignments on both managed resource groups. The Azure Resource Manager (ARM) deployment itself takes roughly 2 to 3 minutes. One naming trap to get ahead of: sre-run-lab.ps1 defaults -ResourceGroup to rg-sre-agent, while sli-alert-scenario.ps1 defaults -AgentResourceGroup to rg-sre-checkout. Pass the name explicitly so both scripts point at the same agent. -SkipRepos strips the optional placeholder GitHub connection, so the deploy never pauses for a browser sign-in. ./03-sre-agent/sre-run-lab.ps1 -SkipRepos -ResourceGroup rg-sre-checkout The deploy header confirms the safety posture before anything is created: ==> 4.1 - Deploy-Agent.ps1 ──────────────── SRE Agent deployment ──────────────── Region: eastus2 Agent name: sre-checkout Agent RG: rg-sre-checkout (will be created) Target RGs: rg-sli-demo, rg-healthmodel-demo Access level: Low Action mode: Review ───────────────────────────────────────────────────── ─────────────── Deployment Succeeded ─────────────── Agent (portal): https://sre.azure.com/#/agent/<SUBSCRIPTION_ID>/rg-sre-checkout/sre-checkout Phase 6.5 is the authoritative check. It re-reads the data plane and compares actual against expected: ARM PATCH -> incidentManagementConfiguration.type=AzMonitor ok ==> 6.4 - Apply response plans (incident filters) so alerts are auto-handled Response plan applied: azmon-sev01 (priorities Sev0/Sev1 -> alert-investigator) ==> 6.5 - Final data-plane verification (all config applied) Check Actual Expected Result ───────────────────────── ────────── ────────── ────── Incident platform AzMonitor AzMonitor PASS Connectors (total) 0 0 PASS Response Plans 1 1 PASS Filter names azmon-sev01 azmon-sev01 PASS ... Results: 22 passed, 0 failed All 22 checks pass on a clean run. One earlier line reads like a failure and is not. Phase 6.1 reports that rg-healthmodel-demo has no metric alert rules. That is correct, because health-model alerts live inside the health model resource and never appear in az monitor metrics alert list. The key settings are incidentManagementConfiguration.type = AzMonitor and response plan azmon-sev01. Together they turn Sev0 and Sev1 Azure Monitor alerts into agent investigations; the agent still runs in review mode, so it proposes mitigation and waits for approval. Finish the two portal steps that cannot be scripted The runner provisions everything it can, but two interactive OAuth steps have no scriptable equivalent. Do both before you run The end-to-end run, or no incident will appear and the agent will look inert. Open the agent in sre.azure.com using the portal link the deployment prints. Complete the GitHub sign-in prompt if you want the agent to correlate deploys. Skip it if you passed -SkipRepos. Open the agent's incident source settings and confirm the Azure Monitor Alerts incident source. Until you confirm it, fired alerts are not converted into incidents. The knowledge upload (phase 6.6) Phase 6.6 uploads a knowledge base to the agent's Knowledge settings, indexed for semantic search. This is the difference between an agent that spends its first incident rediscovering your architecture and one that starts from a map. Two kinds of document go up. The first is checkout-app-topology-and-runbook.md: the services, the telemetry pipeline (crucially, that request metrics live in the Azure Monitor workspace and not in Application Insights), the recording rules, the alerts, and the common failure scenarios. Without it, the agent burns cycles querying Application Insights for request data that is not there. The second is every remediation runbook, each wrapped into an indexed markdown document, because a .ps1 file is not an indexable knowledge type on its own. Runbook When to use it What it does disable-chaos.ps1 Injected or demo failure, chaos knobs non-zero Resets errorRate and extraLatencyMs to 0 per service restart-backend.ps1 Transient backend state Runs az webapp restart on the backend scale-plan.ps1 Latency under load Scales the App Service plan out or up rollback-deploy.ps1 Regression correlates with a deploy Lists recent deployments and prints the rollback command ==> 6.6 - Upload knowledge (app topology + all remediation runbooks) =================== Upload knowledge to SRE Agent =================== Agent : sre-checkout (rg-sre-checkout) Files : 1 knowledge + 4 runbook doc(s) ==> Uploading checkout-app-topology-and-runbook.md ok (indexed for semantic search) ==> Uploading runbook-disable-chaos.md ok (indexed for semantic search) ... 5/5 document(s) uploaded to sre-checkout Knowledge settings. The end-to-end run Prerequisites: the agent deployed and its knowledge uploaded (Step 4 complete, Phase 6.6 green), and traffic running against the workload. The scenario script starts its own traffic job, but the SLI needs recent data before the fault lands. sli-alert-scenario.ps1 drives the whole scenario, and it stops once the alert fires. Nothing in the script contacts the agent: the agent's Azure Monitor incident source ingests the fired alert on its own and opens the incident. What the scenario script does ./03-sre-agent/sli-alert-scenario.ps1 sli-alert-scenario.ps1 does five things: Stage What happens Reset Clears old chaos settings, traffic jobs, and prior trigger rules. Create trigger Creates a unique Sev1 Prometheus rule group on the Azure Monitor workspace in rg-sli-demo. Start traffic Starts load and warms up for 90 seconds so the SLI has recent data. Inject fault Sets checkout errorRate to 0.30, so about 30% of checkout requests fail. Watch alert Polls Azure Monitor until the new alert fires, reports it, and exits. Representative output, reconstructed from the script's messages. Timestamps and the per-run suffix will differ. =================== SLI alert -> SRE Agent scenario =================== Subscription : <SUBSCRIPTION_ID> AMW : .../Microsoft.Monitor/accounts/slidemo-amw-<suffix> (eastus2) Action group : .../actionGroups/ag-sli-demo Backend : https://slidemo-be-<suffix>.azurewebsites.net Agent : sre-checkout (rg-sre-checkout) Alert : sli-fast-alerts-<run> / checkoutAvailabilityFastBreach (Sev1, checkout availability < 95%; unique per run) ====================================================================== ==> 0 - Reset leftover state from any previous run Prior chaos cleared, stale traffic stopped, and old trigger alerts removed. ==> 1 - Create the fast SRE-Agent trigger alert (unique name per run) Alert 'sli-fast-alerts-<timestamp>/checkoutAvailabilityFastBreach' created (Sev1; unique name = new SRE-A incident). Auto-resolves ~5m after recovery. ==> 2 - Start traffic against the workload [<time>] Traffic job 'sli-scenario-traffic' started (~30 rps). Warming up 90s so the SLI value has fresh data... ==> 3 - Inject the fault (chaos) on 'checkout' [<time>] Chaos injected (errorRate 0.3). Watching for the SLI alert to fire... ==> 4 - Watch for the alert (it should fire in ~2-3 min) ... Alert FIRED (within the expected 2 to 3 minute band): checkoutAvailabilityFastBreach severity : Sev1 monitorService : Prometheus targetRG : rg-sli-demo (in the agent's managed scope) ==> 5 - The SRE Agent engages The timeline The default path, with the agent deployed as the kit ships it: T+ Event 0:00 30% error rate injected on checkout about 2 to 3 minutes Sev1 Prometheus alert fires on the Azure Monitor workspace, scoped to rg-sli-demo within a minute or two The Azure SRE Agent ingests the alert as an incident and investigates on its own next It reads the uploaded topology doc, identifies the chaos knob as the cause, and proposes the disable-chaos runbook on your approval The chaos knob is reset and checkout availability climbs back above 95% about 5 minutes after recovery The alert auto-resolves, because the rule carries timeToResolve: PT5M Watch it happen in sre.azure.com under Incidents. The Azure SRE Agent Lab covers the rest: widening the agent identity beyond the default Reader and Log Analytics Reader, the alerts that look like triggers but never fire, and a troubleshooting table for every failure mode above. Clean up Prerequisites: the same shell, at the repository root, with az login still valid. Work in reverse order. Steps 1 and 2 tear down together, and the scenario state is reset first. # Reset first: removes the per-run Prometheus rule group, clears the injected chaos, stops traffic ./03-sre-agent/sli-alert-scenario.ps1 -TeardownAlert # Step 4: delete the Azure SRE Agent (and optionally its resource group) ./03-sre-agent/teardown.ps1 -ResourceGroup rg-sre-checkout -AgentName sre-checkout -DeleteResourceGroup -Yes # Step 3: delete the health model and its Monitoring Reader role assignment ./02-healthmodel-demo/teardown.ps1 -ResourceGroup rg-healthmodel-demo -HealthModelName hm-checkout-demo -DeleteResourceGroup # Steps 1 and 2: remove the service group and SLIs first, then delete the workload resource group ./01-sli-demo/infra/infra-teardown.ps1 Two things the comments do not say. -ResourceGroup rg-sre-checkout is required on the agent teardown because the script defaults to rg-sre-agent, and -Yes skips its confirmation prompt. And infra-teardown.ps1 asks you to type yes before it deletes anything (skip with -Force). The order matters for one reason. The service group and its SLIs are tenant scoped, so they live outside rg-sli-demo and a plain resource group delete would orphan them. infra-teardown.ps1 removes them first, then deletes the resource group. To drop only the service group and leave the workload standing, run teardown-slo.ps1 instead. Conclusion and next steps You now have the full path: a metric a customer would recognize, an SLI that scores it, a health model that rolls it up, an alert that means something, and an agent that acts on it. The wiring is the product. Try it now Terminal 1 (leave running). Clone, deploy, then start traffic and leave it flowing for the rest of the walkthrough. The traffic generator blocks this shell for the full hour. git clone https://github.com/jvargh/azure-reliability-starter-kit.git cd azure-reliability-starter-kit az login az account set --subscription "<SUBSCRIPTION_ID>" # Step 1: infrastructure + apps, then traffic ./01-sli-demo/infra/infra-deploy.ps1 -ResourceGroup rg-sli-demo -Location eastus2 ./01-sli-demo/infra/infra-validate-lab.ps1 -ResourceGroup rg-sli-demo pwsh -File ./01-sli-demo/load/generate-traffic-all.ps1 -ResourceGroup rg-sli-demo -Rps 30 -DurationSeconds 3600 Terminal 2. Open a second shell at the same repository root and run the remaining steps while traffic flows. # Step 2: SLIs on the service group ./01-sli-demo/infra/sli/deploy-sli.ps1 -ResourceGroup rg-sli-demo # Step 3: health model (allow 30 to 60 min after Step 2 for SLI values to publish) ./02-healthmodel-demo/healthmodel-run-lab.ps1 # Step 4: Azure SRE Agent, then break checkout and watch it heal ./03-sre-agent/sre-run-lab.ps1 -SkipRepos -ResourceGroup rg-sre-checkout ./03-sre-agent/sli-alert-scenario.ps1 Learn more Repository lab guides. Each one carries the full captured console transcript of a validated run, so you can compare your output line by line: SLI/SLO Design Lab and the SLI/SLO Design Guide Health Model Lab and the Health Model Design Guide Azure SRE Agent Lab Video walkthroughs: # Walkthrough Video 01 Infrastructure and SLI demo Watch 02 Health modeling Watch 03 Azure SRE Agent Watch 04 End-to-end test Watch Microsoft Learn documentation: Create service level indicators Azure Monitor health models overview Azure SRE Agent overview Connect and contribute Run the steps, break them, and tell the repository what broke. Open an issue or a pull request at the solution repo.1.4KViews5likes0Comments