A subscription total tells you what you spent. The next question is harder: which resources changed, what explains the difference, and what should the team investigate next? This conversational cost analytics prototype brings those questions into Azure SRE Agent, with reusable skills and an interactive Live Report.
The question after the cost chart
The monthly cost review usually starts with a straightforward observation: Azure spending changed.
Then come the questions that take the time.
Which subscription accounts for the increase? Is it an existing workload getting more expensive, or something that only started generating charges this month? Did a reduction somewhere else hide part of the increase? And which optimization recommendations are worth taking to a workload owner?
Azure already has the underlying information. Cost Management provides spending data. Azure Advisor provides optimization recommendations. Resource inventory provides context about what those resources are.
The work is connecting those sources into an explanation that someone can check and act on.
Conversational Cost Analytics Agent: a solution built around Azure SRE Agent that lets operations and FinOps leads start with a question, investigate cost drivers, identify optimization opportunities, and generate reusable reports. The solution can also generate proactive alerts and scheduled reports.
Scope of this post: The repository contains a prototype, an importable dashboard template, reusable skills, and example report screenshots. These demonstrate the reporting approach; they are not evidence of measured customer savings, verified production readiness, or a completed deployment in your environment. The prompts below are examples to try, not a transcript of a measured production investigation.
What we built
This is a custom cost-investigation workflow on Azure SRE Agent, not a separate billing system or a claim that every feature is available out of the box.
The solution brings together three pieces:
- An analytical skill that describes how to compare spending, calculate resource contributions, identify newly billed resources, and handle incomplete periods.
- A query-reference skill that records the Cost Management query patterns, response shapes, aggregation rules, and SRE Agent tool mappings used by the dashboard workflow.
- An HTML Live Report template that presents subscription selection, summary metrics, six-month trends, and expandable resource-level comparisons.
The distinction matters. A template determines how findings appear. A skill determines how the agent should investigate. Neither replaces access to the underlying data.
The agent still needs scoped permissions, supported tools, and a successful data refresh before the report can represent your subscriptions.'
How the investigation works
The workflow starts by discovering the subscriptions the agent can access. It then queries Cost Management for historical totals and current- and previous-month resource-level details, aggregates the results, and populates the report template.
| Source or component | Role in the investigation |
| Azure Cost Management | Billing-based cost data and historical comparisons |
| Azure Resource Graph | Resource inventory and metadata enrichment, not cost data |
| Azure Advisor | Optimization recommendations to review alongside spending |
| Reusable agent skills | Investigation rules, query patterns, and interpretation guardrails |
| Live Report template | Interactive presentation of the refreshed data snapshot |
- How cost data is collected: The agent sends a request to Azure Cost Management to retrieve spending data. The request uses HTTP POST, so the kit runs it through RunAzCliWriteCommands, even though it only reads data.
- Reading costs does not change resources: This query does not resize, delete, or modify resources. Still, configure permissions and tools carefully to limit what the agent can do.
- The report shows the most recently refreshed data: Opening the report displays the data collected during its most recent refresh. It does not automatically request updated billing data.
- Fetching data directly from the report requires a connector: A supported connector gives the report access to a cost-query tool. The report cannot directly use the agent’s built-in CLI tools.
- You can start without a connector: Use the report with periodically refreshed data, and add a connector later if you need to fetch updates directly from the report.
Four questions to explore in the report
1. Where is spending heading?
Start with the broad view:
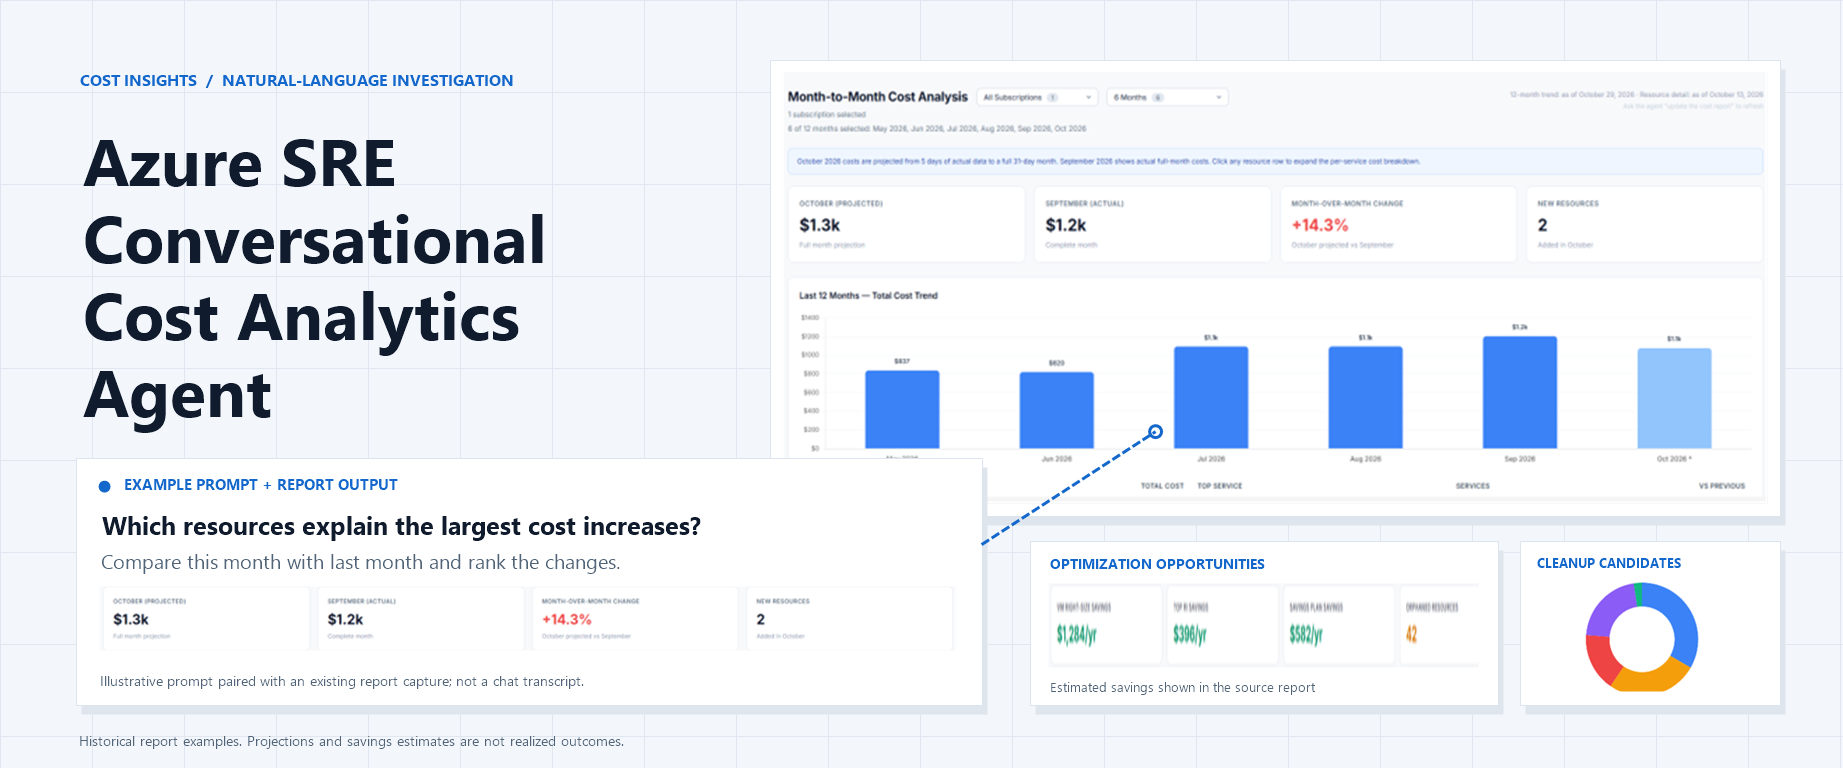
The overview brings subscription selection, summary KPIs, previous-month actuals, and an adjustable cost trend into one view. Select the number of months you want to compare, up to 12, and expand any month to explore the services behind the spending changes.
Figure 1. Historical prototype snapshot, not current pricing or a verified financial result. The current-month KPI is a projection; the screenshot does not establish that the partial-month trend bar uses the same basis. Reconcile those values and use consistent labels before relying on the comparison.
This is also where an apparently simple comparison can become misleading. Ten days of current-month spend and a full previous month are not comparable periods.
For an in-progress month, ask for matched month-to-date periods when investigating change. If the report displays a full-month run-rate projection, keep it labeled as a projection. Do not describe it as a Cost Management forecast unless that forecast was actually retrieved.
The useful outcome is not just a larger or smaller bar. It is an explicit statement of the period, cost basis, currency, and freshness behind that bar.
2. Which resources explain the change?
Once the subscription-level movement is clear, move to the contributors:
"Rank the resources driving increases and decreases. Separate newly billed resources from existing resources whose costs changed."
The resource view compares spending at the resource level, highlights resources appearing in the current period’s billing data, and supports expandable service breakdowns.
Figure 2. Historical prototype comparison. The screenshot's "New Resources" label means newly observed in billing, not confirmed creation. In this example workflow, current-month "Full" values are projections, not completed-month actuals.
The agent can help break down cost changes that might otherwise require multiple spreadsheets and time-consuming manual comparisons:
- New charges do not always mean new resources: An existing resource may start generating charges after a period of inactivity. Costs may also rise because of autoscaling, longer VM running hours, increased storage usage, more read/write operations, or billable data transfers. These changes can be difficult to spot in summary reports.
- Newly created resources can add to spending: The agent can highlight resources appearing in the current period’s billing data. Resource inventory or deployment history is needed to confirm whether they were newly created or simply started generating charges.
- One resource can have several cost entries: A resource may appear in multiple billing records for different services or meters. Adding the relevant entries together helps show its total cost and contribution to the change.
- The net change can hide larger movements: For example, if one resource’s cost increases by $800 while another decreases by $300 over comparable periods, the net increase is $500. Showing both changes reveals the increase and the offsetting reduction. These figures are illustrative.
- Finding the cost driver is not the same as finding the cause: Identifying which resource contributed to an increase is the first step. Explaining why it happened may require additional evidence about usage, configuration changes, pricing, or other factors.
3. Which optimization opportunities deserve attention?
The next question is usually practical:
"Show Azure Advisor cost optimization recommendations for the subscriptions in scope. Separate estimated savings from confirmed spending reductions."
The repository includes an example Advisor optimization view for reviewing rightsizing and commitment-related opportunities alongside the cost investigation.
Figure 3. Historical prototype optimization view. Displayed savings are estimates, not realized savings; low CPU alone does not establish that shutdown is appropriate. A displayed zero for reservations requires a successful, authorized query before it can be interpreted as no reservations.
The useful next step is to review the findings with the workload owner, not to make an automatic purchase or resize a resource.
Rightsizing can change the baseline for a reservation or savings plan decision. Recommendations can also overlap, so adding every displayed savings figure may overstate the opportunity. Billing and commitment visibility depend on the identity's actual access; subscription resource access does not automatically expose every reservation or savings plan dataset.
An unavailable dataset should be reported as unavailable. It should never silently become "no recommendations" or "no commitments."
4. What might we be paying for without using?
Finally, investigate cleanup candidates:
"Identify potentially orphaned resources and show the evidence that makes each one a candidate for owner review."
The example orphaned-resource view covers candidates such as unattached disks, stale snapshots, unassociated public IP addresses and network interfaces, and empty App Service plans.
Figure 4. Example cleanup-candidate inventory. An apparent orphan is an investigation finding, not deletion approval.
An unattached disk may be retained for recovery. A snapshot may be subject to a retention requirement. A network resource may be reserved for a planned deployment.
The report should help the owner answer those questions by identifying the resource, its state, and any observed charges. It should not turn "not currently attached" into "safe to delete."
The intended configuration is read-only reporting and investigation. Validate the identity's effective permissions and enabled tools before use; the template alone does not enforce that boundary. Any cleanup requires separate validation and explicit approval.
Have a meaningful cost conversation with the agent
A cost dashboard remains useful. It shows the shape of spending and gives people a shared view. However, a conversational approach takes this further by helping users investigate what is driving spending, identify key contributors, distinguish new charges from changes in existing resources, and explore cost optimization opportunities.
Start with a simple cost question, then use follow-up prompts to explore what changed, which resources contributed, and what needs further investigation.
Example prompts include:
“Which subscriptions and resources explain the largest cost increases compared with last month?”
“Why did costs increase this month?”
“Which resources contributed most to the increase?”
“Is this newly billed spending or higher costs from existing resources?”
“Compare the last three months and show the biggest changes.”
“Create a report focused on this subscription and its top cost drivers.”
“Show Azure Advisor savings opportunities and orphaned resources that require owner review.”
“Refresh this report every Monday morning.”
With the required data access and tools configured, the agent can help rerun analyses, narrow the scope, and generate reports focused on specific cost questions. Scheduled reports and cost alerts require supported capabilities, appropriate permissions, and separate configuration. Check findings against source data before making decisions or changing resources.
Try it in your environment
Start with one subscription whose costs you already understand. That makes it easier to reconcile the first report before expanding the scope.
- Review the kit. Start with the repository overview
- Add the three skills from the skills folder, and upload the cost analysis playbook as a knowledge source.
- Configure scoped access. The kit calls for Cost Management Reader and Reader on each target subscription for cost queries and inventory enrichment. Validate any additional billing or commitment access separately.
- Bootstrap the report. Submit the first-run prompt from the bootstrap prompts and provide the HTML report template.
- Validate the result. Reconcile a completed month's totals against Cost Management using the same scope, currency, and cost basis. Check resource aggregation, labels, and missing-data states.
- Configure refresh only after validation. The kit includes a suggested Monday 07:00 UTC refresh prompt. Confirm scheduling support, permissions, and failure handling in your environment before relying on it.
Using this workflow may incur Azure SRE Agent charges and other applicable service charges. Review Azure SRE Agent pricing and billing and the pricing for the services you configure before running a pilot. This post does not describe a free service offering.
Further reading

 Microsoft