azure app testing
4 TopicsWhy Did Our Azure Bill Change? Investigating Cloud Spend with Azure SRE Agent
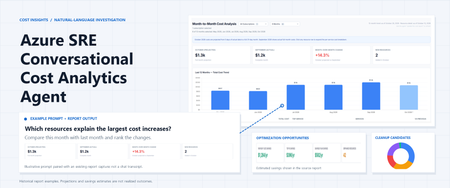
The question after the cost chart The monthly cost review usually starts with a straightforward observation: Azure spending changed. Then come the questions that take the time. Which subscription accounts for the increase? Is it an existing workload getting more expensive, or something that only started generating charges this month? Did a reduction somewhere else hide part of the increase? And which optimization recommendations are worth taking to a workload owner? Azure already has the underlying information. Cost Management provides spending data. Azure Advisor provides optimization recommendations. Resource inventory provides context about what those resources are. The work is connecting those sources into an explanation that someone can check and act on. Conversational Cost Analytics Agent: a solution built around Azure SRE Agent that lets operations and FinOps leads start with a question, investigate cost drivers, identify optimization opportunities, and generate reusable reports. The solution can also generate proactive alerts and scheduled reports. Scope of this post: The repository contains a prototype, an importable dashboard template, reusable skills, and example report screenshots. These demonstrate the reporting approach; they are not evidence of measured customer savings, verified production readiness, or a completed deployment in your environment. The prompts below are examples to try, not a transcript of a measured production investigation. What we built This is a custom cost-investigation workflow on Azure SRE Agent, not a separate billing system or a claim that every feature is available out of the box. The solution brings together three pieces: An analytical skill that describes how to compare spending, calculate resource contributions, identify newly billed resources, and handle incomplete periods. A query-reference skill that records the Cost Management query patterns, response shapes, aggregation rules, and SRE Agent tool mappings used by the dashboard workflow. An HTML Live Report template that presents subscription selection, summary metrics, six-month trends, and expandable resource-level comparisons. The distinction matters. A template determines how findings appear. A skill determines how the agent should investigate. Neither replaces access to the underlying data. The agent still needs scoped permissions, supported tools, and a successful data refresh before the report can represent your subscriptions.' How the investigation works The workflow starts by discovering the subscriptions the agent can access. It then queries Cost Management for historical totals and current- and previous-month resource-level details, aggregates the results, and populates the report template. Source or component Role in the investigation Azure Cost Management Billing-based cost data and historical comparisons Azure Resource Graph Resource inventory and metadata enrichment, not cost data Azure Advisor Optimization recommendations to review alongside spending Reusable agent skills Investigation rules, query patterns, and interpretation guardrails Live Report template Interactive presentation of the refreshed data snapshot How cost data is collected: The agent sends a request to Azure Cost Management to retrieve spending data. The request uses HTTP POST, so the kit runs it through RunAzCliWriteCommands, even though it only reads data. Reading costs does not change resources: This query does not resize, delete, or modify resources. Still, configure permissions and tools carefully to limit what the agent can do. The report shows the most recently refreshed data: Opening the report displays the data collected during its most recent refresh. It does not automatically request updated billing data. Fetching data directly from the report requires a connector: A supported connector gives the report access to a cost-query tool. The report cannot directly use the agent’s built-in CLI tools. You can start without a connector: Use the report with periodically refreshed data, and add a connector later if you need to fetch updates directly from the report. Four questions to explore in the report 1. Where is spending heading? Start with the broad view: The overview brings subscription selection, summary KPIs, previous-month actuals, and an adjustable cost trend into one view. Select the number of months you want to compare, up to 12, and expand any month to explore the services behind the spending changes. Figure 1. Historical prototype snapshot, not current pricing or a verified financial result. The current-month KPI is a projection; the screenshot does not establish that the partial-month trend bar uses the same basis. Reconcile those values and use consistent labels before relying on the comparison. This is also where an apparently simple comparison can become misleading. Ten days of current-month spend and a full previous month are not comparable periods. For an in-progress month, ask for matched month-to-date periods when investigating change. If the report displays a full-month run-rate projection, keep it labeled as a projection. Do not describe it as a Cost Management forecast unless that forecast was actually retrieved. The useful outcome is not just a larger or smaller bar. It is an explicit statement of the period, cost basis, currency, and freshness behind that bar. 2. Which resources explain the change? Once the subscription-level movement is clear, move to the contributors: "Rank the resources driving increases and decreases. Separate newly billed resources from existing resources whose costs changed." The resource view compares spending at the resource level, highlights resources appearing in the current period’s billing data, and supports expandable service breakdowns. Figure 2. Historical prototype comparison. The screenshot's "New Resources" label means newly observed in billing, not confirmed creation. In this example workflow, current-month "Full" values are projections, not completed-month actuals. The agent can help break down cost changes that might otherwise require multiple spreadsheets and time-consuming manual comparisons: New charges do not always mean new resources: An existing resource may start generating charges after a period of inactivity. Costs may also rise because of autoscaling, longer VM running hours, increased storage usage, more read/write operations, or billable data transfers. These changes can be difficult to spot in summary reports. Newly created resources can add to spending: The agent can highlight resources appearing in the current period’s billing data. Resource inventory or deployment history is needed to confirm whether they were newly created or simply started generating charges. One resource can have several cost entries: A resource may appear in multiple billing records for different services or meters. Adding the relevant entries together helps show its total cost and contribution to the change. The net change can hide larger movements: For example, if one resource’s cost increases by $800 while another decreases by $300 over comparable periods, the net increase is $500. Showing both changes reveals the increase and the offsetting reduction. These figures are illustrative. Finding the cost driver is not the same as finding the cause: Identifying which resource contributed to an increase is the first step. Explaining why it happened may require additional evidence about usage, configuration changes, pricing, or other factors. 3. Which optimization opportunities deserve attention? The next question is usually practical: "Show Azure Advisor cost optimization recommendations for the subscriptions in scope. Separate estimated savings from confirmed spending reductions." The repository includes an example Advisor optimization view for reviewing rightsizing and commitment-related opportunities alongside the cost investigation. Figure 3. Historical prototype optimization view. Displayed savings are estimates, not realized savings; low CPU alone does not establish that shutdown is appropriate. A displayed zero for reservations requires a successful, authorized query before it can be interpreted as no reservations. The useful next step is to review the findings with the workload owner, not to make an automatic purchase or resize a resource. Rightsizing can change the baseline for a reservation or savings plan decision. Recommendations can also overlap, so adding every displayed savings figure may overstate the opportunity. Billing and commitment visibility depend on the identity's actual access; subscription resource access does not automatically expose every reservation or savings plan dataset. An unavailable dataset should be reported as unavailable. It should never silently become "no recommendations" or "no commitments." 4. What might we be paying for without using? Finally, investigate cleanup candidates: "Identify potentially orphaned resources and show the evidence that makes each one a candidate for owner review." The example orphaned-resource view covers candidates such as unattached disks, stale snapshots, unassociated public IP addresses and network interfaces, and empty App Service plans. Figure 4. Example cleanup-candidate inventory. An apparent orphan is an investigation finding, not deletion approval. An unattached disk may be retained for recovery. A snapshot may be subject to a retention requirement. A network resource may be reserved for a planned deployment. The report should help the owner answer those questions by identifying the resource, its state, and any observed charges. It should not turn "not currently attached" into "safe to delete." The intended configuration is read-only reporting and investigation. Validate the identity's effective permissions and enabled tools before use; the template alone does not enforce that boundary. Any cleanup requires separate validation and explicit approval. Have a meaningful cost conversation with the agent A cost dashboard remains useful. It shows the shape of spending and gives people a shared view. However, a conversational approach takes this further by helping users investigate what is driving spending, identify key contributors, distinguish new charges from changes in existing resources, and explore cost optimization opportunities. Start with a simple cost question, then use follow-up prompts to explore what changed, which resources contributed, and what needs further investigation. Example prompts include: “Which subscriptions and resources explain the largest cost increases compared with last month?” “Why did costs increase this month?” “Which resources contributed most to the increase?” “Is this newly billed spending or higher costs from existing resources?” “Compare the last three months and show the biggest changes.” “Create a report focused on this subscription and its top cost drivers.” “Show Azure Advisor savings opportunities and orphaned resources that require owner review.” “Refresh this report every Monday morning.” With the required data access and tools configured, the agent can help rerun analyses, narrow the scope, and generate reports focused on specific cost questions. Scheduled reports and cost alerts require supported capabilities, appropriate permissions, and separate configuration. Check findings against source data before making decisions or changing resources. Try it in your environment Start with one subscription whose costs you already understand. That makes it easier to reconcile the first report before expanding the scope. Review the kit. Start with the repository overview Add the three skills from the skills folder, and upload the cost analysis playbook as a knowledge source. Configure scoped access. The kit calls for Cost Management Reader and Reader on each target subscription for cost queries and inventory enrichment. Validate any additional billing or commitment access separately. Bootstrap the report. Submit the first-run prompt from the bootstrap prompts and provide the HTML report template. Validate the result. Reconcile a completed month's totals against Cost Management using the same scope, currency, and cost basis. Check resource aggregation, labels, and missing-data states. Configure refresh only after validation. The kit includes a suggested Monday 07:00 UTC refresh prompt. Confirm scheduling support, permissions, and failure handling in your environment before relying on it. Using this workflow may incur Azure SRE Agent charges and other applicable service charges. Review Azure SRE Agent pricing and billing and the pricing for the services you configure before running a pilot. This post does not describe a free service offering. Further reading Azure SRE Agent overview Azure Cost Management overview Azure Cost Management Query API Azure Advisor cost recommendations Azure Resource Graph overview249Views1like0Comments
Bring managed browser automation to your agent applications
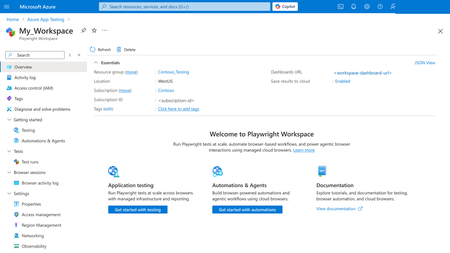
AI agents become more useful when they can move beyond conversation and complete real workflows. Playwright Cloud Browsers provides managed, on-demand browser capacity that agent applications can access through Model Context Protocol (MCP). You can connect Playwright Cloud Browsers to agent applications, including coding agents such as the GitHub Copilot app and Visual Studio Code: when they support custom remote MCP servers. Once connected, an agent can navigate an approved application, complete forms, verify results, capture evidence, and close the managed browser session. Your team gets browser automation without maintaining browsers in every user or agent environment. In this example, we use the GitHub Copilot app to show the connection and workflow. You can extend the same approach to other compatible applications by adding the Playwright workspace endpoint through their custom remote MCP configuration. Example: Follow one registration request from start to finish If your team processes employee registrations for approved training programs, each request can involve several repetitive steps: open the portal, enter employee and course information, check required fields, review the details, submit the form, and retain confirmation evidence. After you connect the workspace MCP endpoint, you can ask your agent application to handle the browser steps. In the GitHub Copilot app, for example, you could use this prompt: "Use Playwright Cloud Browsers to open <approved-registration-portal-url> and process case <number>. Enter the employee and course information I provide, validate all required fields, and show me a structured summary. Do not submit until I approve it. After approval, submit once, verify the confirmation number and success message, capture a screenshot, and close the browser session. If submission times out, inspect the page before deciding whether a retry is safe." The prompt defines the outcome, approved destination, human decision point, evidence, and cleanup expectation. The agent handles repetitive browser interaction while you remain in control of the consequential submission. Connect managed browser capacity in minutes Every Playwright workspace provides a workspace-scoped MCP endpoint: https://<region>.mcp.playwright.microsoft.com/playwrightworkspaces/<workspace-id>/mcp Provision a Playwright workspace in the Azure portal. Open the workspace and copy its MCP endpoint. In the GitHub Copilot app, open Customize, select Add, and then select MCP. Choose HTTP, enter a server name, paste the endpoint, and select Save. For this illustrated setup, only the server name and workspace endpoint are entered. Follow your organization's authentication and access policies for the workspace. Figure 1. Open the Playwright workspace Overview page in the Azure portal Figure 2. Copy the workspace-scoped MCP endpoint Figure 3. Open Customize in the GitHub Copilot app Figure 4. Select 'MCP' Tab, and add the workspace endpoint as a custom HTTP MCP server This article demonstrates Add > MCP in the GitHub Copilot app. Other compatible applications use their own custom remote MCP configuration. Using another compatible application? In Visual Studio Code or another client that supports custom remote MCP servers, add the same workspace endpoint through that application’s MCP configuration. The interface can differ, but the endpoint and connection model remain the same. Features of Playwright Cloud Browsers 1. Watch the agent complete the form When the task begins, the agent creates a managed browser session and uses its browserSessionId throughout the registration flow. Session creation might also return a liveViewUrl; Live View availability depends on the session. When available, Live View lets you watch while the agent opens the portal, finds the registration fields, and enters the supplied information. The agent follows an observe-act-verify loop: inspect the page, enter the required values, wait for validation or dependent fields, and observe the page again. If you need to intervene rather than observe, Playwright Cloud Browsers provides Take Control for supported active sessions. An authorized operator can interact directly with the running browser to address an unexpected page state, complete an action that requires human judgment, or help troubleshoot the flow. Control can then return to automation. 2. Review before the consequential action Before submission, the agent presents a structured summary with the case ID, employee name, selected course, date, contact information, required acknowledgements, and any validation warning. It waits for explicit approval. Automation removes repetitive entry and navigation, while you retain authority over the action that creates the registration. After approval, the agent submits once. It verifies the success message and confirmation identifier, captures a screenshot when evidence is required, and reports the outcome. 3. Investigate errors before retrying A timeout or disconnected caller does not prove that submission failed. Repeating a non-idempotent action can create a duplicate registration. If the result is unclear, the agent first checks the page for a confirmation number, success message, changed status, or validation error. It retries only when the page state shows that repeating the action is safe. Console messages and network activity can explain client-side errors, failed requests, authentication problems, or validation behavior. Playwright Cloud Browsers also provides built-in observability and browser session data, including logs, traces, screenshots, recordings, and execution artifacts. Availability depends on the workflow, session, and configuration. 4. Close the session and monitor the result The agent closes the browser session whether the registration succeeds, fails, or is cancelled. Closed or expired sessions cannot be reopened. Explicit cleanup releases browser capacity promptly and reduces unexpected activity. Figure 5. Review MCP created sessions in the Azure portal Browser activity log Use Browser sessions > Browser activity log to review MCP-created sessions, source, start time, and duration. The result is one connected workflow: your agent application provides the conversational or coding experience, MCP provides the connection, and Playwright Cloud Browsers provides managed execution, visibility, human intervention, evidence, diagnostics, and auditability. Responsible use: Use browser automation only with approved websites, accounts, and data. Retain human review before consequential submissions, and never place workspace credentials, access tokens, or sensitive form data in prompts, source control, screenshots, or logs. Learn more Azure portal: https://portal.azure.com/ What is Playwright Workspaces?: https://learn.microsoft.com/azure/app-testing/playwright-workspaces/overview-what-is-microsoft-playwright-workspaces Create and manage a workspace: https://learn.microsoft.com/azure/app-testing/playwright-workspaces/how-to-manage-playwright-workspace Playwright Workspaces remote MCP server: https://learn.microsoft.com/en-us/azure/app-testing/playwright-cloud-browsers/quickstart-automate-browser-tasks-remote-mcp Manage workspace access tokens: https://learn.microsoft.com/azure/app-testing/playwright-workspaces/how-to-manage-access-tokens Customize the GitHub Copilot app: https://docs.github.com/copilot/how-tos/github-copilot-app/customize-github-copilot-app Add and manage MCP servers in Visual Studio Code: https://code.visualstudio.com/docs/agent-customization/mcp-servers490Views0likes0CommentsComparing Three Approaches to AI Agent Evaluation and Observability
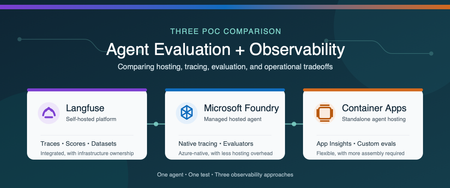
Why evaluation and observability belong together Agent evaluation and observability answer two related questions: Is the agent producing the right result? What happened from the initial request through every model and tool call? Evaluation measures quality with repeatable scores (is our system working), such as task completion, tool-call accuracy, groundedness, or safety. Observability captures the end-to-end execution flow, including prompts, model responses, tool calls, latency, token usage, and errors. You need both. A score can tell you that an agent failed, while a trace helps you understand why. Microsoft provides several ways to host and monitor agents. You can use a Microsoft Foundry hosted agent with integrated tracing and evaluation, or run the agent independently on a service such as Azure Container Apps and connect it to Azure Monitor. Open-source platforms such as Langfuse provide another option and can be self-hosted in Azure. We built three proofs of concept (POCs) to compare these approaches: Self-hosted Langfuse A Microsoft Foundry hosted agent A standalone agent on Azure Container Apps The best choice depends on more than features. Authentication, networking, security boundaries, operational ownership, and the existing Azure architecture all affect the decision. Note These findings come from one controlled comparison, not a general performance benchmark. We used the same agent image, model deployment, prompt, tools, and synthetic test data in all three POCs. The common test The test agent summarized a synthetic portfolio. It had to call three deterministic tools in a fixed order: Load the dataset Validate its schema Compute the summary The expected answer was known in advance, which allowed us to evaluate both the final result and the tool trajectory. We also created a deterministic tool-call-accuracy score so we could compare how each platform stored and displayed the same custom metric. POC 1: Self-hosted Langfuse For the Langfuse POC, one private Azure virtual machine ran the agent and the Langfuse stack with Docker Compose. The deployment included Langfuse web and worker services, PostgreSQL, ClickHouse, Redis, MinIO, and an OpenTelemetry Collector. Azure Bastion provided private administrative access, and a managed identity retrieved secrets from Azure Key Vault. The main advantage was the integrated experience. Traces, scores, datasets, experiments, annotations, latency, token usage, and cost appeared in one application. We could move from the original prompt to each tool call, the final response, and the evaluation score without building a separate dashboard. That capability comes with operational responsibility. A production self-hosted deployment requires patching, scaling, backup, recovery, data retention, access control, and monitoring for the Langfuse services and their data stores. Choose this approach when a unified, open-source AI engineering platform and deployment control are higher priorities than minimizing platform operations. POC 2: Microsoft Foundry hosted agent For the Foundry POC, Microsoft Foundry hosted the agent from a pinned container image. Application Insights and Log Analytics stored the telemetry. We used Foundry's Traces experience for agent trajectories and added an Azure Workbook for custom evaluation metrics. Foundry provided the strongest Azure-native developer experience. Its trace view displayed model and tool activity as an agent trajectory, and its evaluation capabilities included built-in and custom evaluators. The underlying traces still flowed to Application Insights, where they could be queried and used in Azure Monitor visualizations. The tradeoff is architectural alignment. The application must fit the customer's Foundry account, identity, networking, and deployment model. Custom business metrics can also require additional emission and visualization work beyond the native evaluation experience. Choose this approach when managed agent hosting, Foundry-native tracing, and Azure-native evaluation are the priorities. POC 3: Standalone agent on Azure Container Apps For the third POC, we removed Foundry from the hosting path. The same image ran as an Azure Container App and used a managed identity to pull from Azure Container Registry and call Azure OpenAI. OpenTelemetry sent agent activity to Application Insights and Log Analytics. This POC demonstrated that the Azure Monitor foundation is not limited to Foundry-hosted agents. Application Insights still provided an end-to-end transaction waterfall showing model calls, tool executions, latency, and errors, along with agent-level monitoring views. The difference was the amount of assembly required. The team owns application instrumentation, the evaluation runner, custom metric emission, dashboards, and CI integration. The result offers more control over hosting, authentication, ingress, and network placement, but it requires more engineering than the Foundry-native experience. Choose this approach when the agent must fit an existing container platform or custom security architecture and the team is prepared to build the evaluation workflow around it. Side-by-side comparison Decision area Langfuse Foundry hosted agent Azure Container Apps Agent hosting Customer-operated in this POC Microsoft-managed hosted agent Customer-managed container app Primary trace experience Native Langfuse tracing Foundry Traces plus Application Insights Application Insights Evaluation Native scores, evaluators, datasets, and experiments Foundry built-in and custom evaluators Custom runner or separate evaluation service Custom metrics Native scores and dashboards Emit to Azure Monitor and visualize as needed Emit to Azure Monitor and visualize as needed Infrastructure ownership Highest Lowest for agent hosting Moderate Architecture flexibility High, but the platform must be operated Aligned to Foundry architecture Highest for the application hosting layer Best fit Integrated open-source AI engineering platform Managed Azure-native agent experience Existing container and security architecture What we learned All three approaches can support meaningful evaluation and observability. The real difference is where the capabilities live and how much the customer must assemble and operate. Langfuse provided the most integrated tracing and evaluation experience in this comparison, but we owned the platform infrastructure. Foundry reduced hosting operations and provided a purpose-built agent trace and evaluation experience. Azure Container Apps provided the greatest hosting flexibility while preserving Azure Monitor observability, but required us to supply the evaluation and custom visualization layers. Because all three POCs used the same model, prompt, and tool sequence, the LLM token cost for an equivalent run was effectively the same. Platform and infrastructure costs were not equivalent and require a separate estimate based on scale, retention, networking, support, and operational requirements. The decision should start with the customer's constraints: Does the agent fit the Foundry hosting and identity model? Does the organization want to operate an open-source observability platform? Does the agent need to run inside an existing container and network architecture? Which evaluation capabilities must be available before deployment and in production? Who will own instrumentation, dashboards, storage, upgrades, and incident response? There is no single correct platform for every agent. The right choice is the one that provides the required evidence about quality and behavior while fitting the customer's security, architecture, and operating model. Learn more Set up tracing for agents in Microsoft Foundry Monitor AI agents with Application Insights Review Microsoft Foundry agent evaluators Collect OpenTelemetry data in Azure Container Apps Explore Langfuse observability Explore Langfuse evaluation Deploy Langfuse on Azure650Views2likes0CommentsAzure Container Apps Express is now Generally Available
For many web apps and APIs, a container image should be enough to get started. Developers should not have to choose and configure an environment before the first deployment. Today, Azure Container Apps Express reaches general availability. It is the fastest way to go from a container image to a production-ready app on Azure, with instant provisioning, startup optimized for sub-second performance, and scale-from-zero. Customers created many thousands of Express apps during public preview and told us, clearly and often, what was missing. That feedback set the priorities for general availability, and it continues to guide what comes next. From container image to running app Express starts with the application. Bring a container image, choose a region, add the configuration your app needs, and deploy. In the Express experience, there is no environment to stand up first. Azure provisions the underlying compute, ingress, and scaling. That shorter path matters when you are shipping a web app or API. It matters even more when the thing doing the shipping is an agent: AI-assisted workflows can create and update apps far faster than anyone can configure infrastructure by hand. Speed continues after deployment. Express apps can scale to zero when idle and are optimized for sub-second startup when traffic returns. For a measured look at that experience, see Express scale from zero. Broad regional availability At general availability, Express is available in more than 40 Azure regions, covering almost every public region where Azure Container Apps is offered. You get the same direct deployment experience while placing applications close to users and data. See the current list in the Express region availability documentation. Built on Azure Container Apps Sandboxes Azure Container Apps Express runs on Azure Container Apps Sandboxes, the isolated compute layer behind its provisioning and startup speed. Developers can also use Sandboxes directly to build agent platforms, secure code-execution services, and other systems that need isolated compute on demand. The Azure Container Apps Sandboxes announcement covers the compute platform underneath Express. Where Express goes next We launched Express in public preview while its focused feature set was still taking shape. That gave customers access sooner and let real usage shape the work that followed. Since preview, we have expanded regional availability, strengthened Express for production workloads, and added capabilities that fit its direct application model. General availability makes Express ready for production use. We will continue adding features while preserving its focus on fast, simple deployment. Express offers a focused subset of Azure Container Apps capabilities. Choose Express when speed and simplicity matter most. Choose a standard Container Apps environment when you need greater control over networking, GPU compute, advanced configuration, or environment-level capabilities such as Dapr. Deploy your first Express app Ready to try it? Create an Azure Container Apps Express app. Then read the Express documentation, see Express scale from zero, or learn about Azure Container Apps Sandboxes.1.6KViews0likes0Comments