updates
100 Topics
Find anomalies in Prometheus and OpenTelemetry metrics with Dynamic Thresholds (Preview)
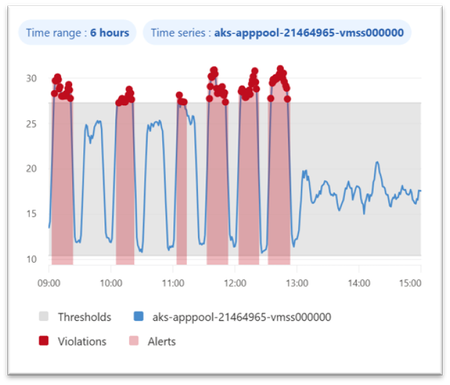
Dynamic thresholds are extended to query-based metric alerts in Azure Monitor, allowing to detect and alert on anomalies in Azure Monitor managed Prometheus metrics and OpenTelemetry metrics stored in an Azure Monitor Workspace. This follows the introduction of Dynamic Thresholds for Log search alerts — Azure Monitor now offers consistent Dynamic Thresholds support across logs and metrics — platform metrics, log search queries, and now query-based metric alerts. A consistent anomaly-detection approach, wherever your signals live. Dynamic thresholds are not a single static formula. They apply a range of machine-learning models and algorithms to historical query results, learn each series’ normal rhythm — including hourly, daily, and weekly seasonality — and automatically fit the most appropriate baseline separately to every time series. This way, a single alert rule can monitor many resources or dimensions while each one gets its own independent, self-refining baseline. Why Dynamic Thresholds Matter Simpler configuration: Reduce the need to define, maintain, and continuously tune static thresholds inside PromQL alert logic. Adaptive monitoring: Let alert thresholds adjust to changing workload behavior, recurring traffic peaks, and seasonal usage patterns. At-scale intelligence: Monitor multiple time series with a single alert rule, while Azure Monitor learns an independent baseline for each resource or dimension combination. Example 1 — Spot CPU anomalies in AKS workloads Scenario: Monitor container CPU utilization across pods or deployments in AKS with a query-based metric alert built on Prometheus metrics. Example query: sum by (microsoft_resource_id, namespace, deployment, container) (rate(container_cpu_usage_seconds_total[5m])) / sum by (microsoft_resource_id, namespace, deployment, container) (container_spec_cpu_quota / container_spec_cpu_period) Why dynamic thresholds help: CPU usage of a Kubernetes workload changes with workload mix, deployment timing, scaling activity, and traffic patterns. Static thresholds can be difficult to tune across namespaces, deployments, and containers. Dynamic thresholds learn a separate baseline for each monitored time series — in this example, for every pod, deployment, and container combination — so genuine CPU spikes stand out while expected variation from autoscaling and traffic mix stays quiet. Example 2 — Catch application latency regressions sooner Scenario: Detect abnormal latency patterns in an application by alerting on custom OpenTelemetry metrics stored in an Azure Monitor Workspace. Example query: histogram_quantile(0.95, sum by (le, service_name, http_route, http_method) (rate(http_server_duration_seconds_bucket[5m]))) Why dynamic thresholds help: Application latency naturally changes with traffic, user behavior, and release cadence. Fixed thresholds can be noisy during peak periods and too loose during quiet ones. Dynamic thresholds learn a separate baseline for each time series — here, for every service, route, and method — so real p95 latency regressions surface even as traffic and release cadence shift throughout the day. Best practices for better results To get the best results from dynamic thresholds for PromQL-based alerts, design your query so Azure Monitor can learn a clear, stable signal over time: Keep the expression numeric. Dynamic thresholds work best when the query returns a continuous numeric signal rather than a Boolean true/false result. For example, use an expression that calculates CPU usage, not a Boolean comparison like CPU > 0.8. Use meaningful dimensions. Split by dimensions such as namespace, deployment, service, or route when you want separate baselines for different workloads or endpoints. Prefer stable entities. Use longer-lived dimensions or aggregate across short-lived entities so the model has enough consistent history to learn from. In Kubernetes, for example, deployment is usually a better baseline dimension than individual pod ID. Choose the right threshold behavior. Decide whether the alert should trigger on values above the learned upper bound, below the lower bound, or both. Start with medium sensitivity. Use Medium as a balanced default, then tune up or down based on noise and missed anomalies. Allow enough historical data. Dynamic thresholds improve as more history is collected. Initial seasonal patterns use recent history, and weekly seasonality becomes more effective after several weeks of data. Get started Ready to try it? Create a query-based metric alert with dynamic thresholds on your metrics in Azure Monitor Workspace. You can create such rules in the Azure portal, where the built-in preview chart shows when your dynamic threshold alert would have fired based on historical baseline analysis. Use the preview chart to tune both the PromQL query and the dynamic threshold sensitivity before enabling the rule. You can also create query-based metric alert rules using programmatic interfaces or resource templates. Figure 1. Dynamic thresholds preview chart showing the learned baseline and the points where an alert would have fired. Dynamic thresholds cut alert noise where it starts — at detection. The alerts that do fire connect into Azure Monitor’s broader AIOps experience, where the Azure Copilot Observability Agent can help correlate signals into investigated issues with explainable reasoning — with humans in control. Next steps Related blog: Anomaly detection made easy with Dynamic thresholds for Log search alerts Dynamic thresholds in Azure Monitor Query-based metric alerts overview Create query-based metric alerts Prometheus metrics in Azure Monitor OpenTelemetry on Azure Monitor Stay connected Follow the Azure Observability Blog for more updates on Azure Monitor, Prometheus-based monitoring, alerting, and troubleshooting experiences. We’ll continue sharing product updates, practical guidance, and examples to help you improve observability across your Azure environments. Feedback We’d love to hear how dynamic thresholds for query-based metric alerts work for your scenarios. Share your feedback through your Microsoft account team, Azure support channels, or the feedback options in the Azure portal so we can continue improving the experience.212Views0likes0Comments
Azure Copilot Observability Agent is generally available, with autonomous operations in preview
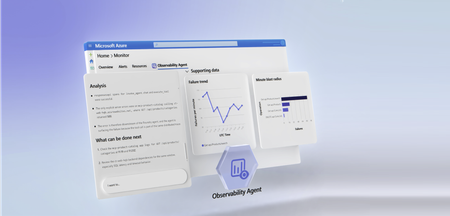
Complex cloud environments have outpaced manual operations. Agentic cloud operations connect people, tools, and data to streamline investigation workflows and move teams from scattered signals to evidence-backed next steps. With unified observability, teams can investigate Azure-monitored applications, Azure Kubernetes Service (AKS) environments, VMs, Foundry telemetry, infrastructure, and platform signals with greater context and control. Powered by Azure Monitor, the Azure Copilot Observability Agent is now generally available. It helps engineering, SRE, DevOps, and operations teams move from telemetry and alert noise to investigated issues, explainable reasoning, and recommended next steps that can reduce Time-To-Mitigate (TTM). Autonomous operations are also available in public preview. They help prepare context and reduce triage work while people remain responsible for mitigation decisions and any changes to the environment. From alert noise to investigated issues The Observability Agent helps teams reduce the effort required to understand operational problems. Instead of starting every investigation from a dashboard, query editor, or alert payload, teams can work with an AI companion that reasons across telemetry, Azure resource context, discovered topology, and custom instructions to identify what changed, what is correlated, and what evidence supports the conclusion. Teams can start with natural-language exploration and continue into deeper investigations when an issue requires more evidence. That light-to-deep workflow helps responders move from broad questions to a structured investigation without losing the reasoning trail. Here's what this looks like in practice: after a deployment, several alerts might fire across an app, database dependency, and compute resource. The Observability Agent can group those signals around the affected service, identify when the regression started, compare related dependencies and infrastructure metrics, and capture the findings in an Azure Monitor issue. The responder can then validate the evidence, add team context, route work to the right owner, and decide whether a rollback, configuration change, or code fix is appropriate. Explainable investigations across Azure-monitored signals Operations teams need more than a chatbot that answers questions. The Observability Agent follows an investigation workflow: it frames hypotheses, gathers evidence, compares signals by time, scope, and type, rules out weak explanations, and shows the reasoning path behind its findings. The Observability Agent can help teams: Investigate incidents and alerts across Azure-monitored applications, Azure Kubernetes Service (AKS) environments, VMs, Foundry telemetry, infrastructure, and platform signals Correlate related signals to reduce noise and surface higher-signal issues with context Explore telemetry using natural language while preserving transparency into the supporting data Compare signals by time, scope, and type to separate likely causes from coincidental changes Provide a reasoning trail that shows what the agent found, what it ruled out, and why Recommend next steps that engineers can review before deciding how to act This same investigation model applies to specialized skills and issue types, including customer's application, Azure Kubernetes Service (AKS), Foundry, VMs, and GenAI issues. When the relevant telemetry is available, the Observability Agent can correlate logs, metrics, traces, alerts, dependencies, resource graph, resource health, activity logs, Foundry telemetry, and changes. This helps teams investigate customer-visible issues with evidence, including latency, token spikes, tool-call failures, agent errors, hallucinations, deployments, API failures, performance regressions, infrastructure dependencies, and platform incidents. This explainability is central to the product. In production operations, trust is earned through evidence. The Observability agent is built to support human judgment, not bypass it. . Azure expertise, with context from your environment Context matters in every investigation. The same symptom can mean different things depending on application architecture, recent deployments, dependencies, historical incidents, and team practices. The Observability Agent brings Microsoft and Azure operational knowledge into the investigation experience. It can use discovered topology, Azure resource context, logs, metrics, traces, and custom instructions to ground investigations in signals that are more relevant to your environment. Native to Azure Monitor, with humans in control Because the Observability Agent is built into Azure Monitor, teams can use it close to the telemetry, alerts, and workflows they already rely on. Investigations can also be captured as Azure Monitor issues, creating a shared case file for humans and agents to collaborate on evidence, reasoning, and next steps. The Observability Agent is designed for governed AI operations inside Azure Monitor. Interactive chat and investigations use the signed-in user's identity and Azure role-based access control (RBAC). Prompts and responses are not used to train foundation models, and the agent doesn't restart resources, change configuration, or resolve issues on its own. Autonomous operations in public preview Alongside general availability, autonomous operations for the Observability Agent are available in public preview. When enabled, the agent can analyze alerts in the background, correlate related alerts when they likely represent the same incident, create Azure Monitor issues automatically, and run deep investigations on agent-created issues. This automatic triage helps reduce alert noise by turning streams of individual alerts into higher-signal issues with context, findings, and recommended next steps. Teams can review the issue, continue the investigation, and decide what action to take. Autonomous operations are designed to prepare context and reduce triage work, not to remove human control. Engineers remain responsible for decisions, approvals, and any changes to the environment. Next steps Check out our latest announcements and related blogs: Azure Blog and OMB Blog. Learn how to use the Observability Agent in Azure Copilot Observability Agent. Explore how investigations work in Deep investigations in the Azure Copilot Observability Agent. Learn more on how to Chat with your observability data Learn how teams preserve context in Azure Monitor issues. Review preview details in Autonomous operations in the Azure Copilot Observability Agent. Stay connected Follow this blog for ongoing deep dives, updates on current capabilities, and a preview of what's coming next. Live webinar - a walkthrough of real Observability Agent scenarios, best practices, and what's available today - along with a look at what's coming next, and live Q&A with the product team. Register for the Observability Agent webinar. We'd love your feedback The Observability agent continues to evolve based on real-world usage and operator feedback. Share your thoughts directly through the Give Feedback option in the experience, or reach us at enauerman@microsoft.com.10KViews6likes0CommentsAccelerating AKS troubleshooting with the Azure Copilot Observability Agent
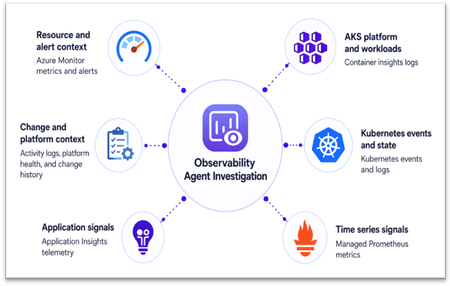
AKS incidents rarely stay within one Kubernetes object, signal, or tool. A latency spike might first appear in application telemetry, but the root cause may sit elsewhere: pod restarts, node pressure, scheduling failures, or a recent configuration change. The Azure Copilot Observability Agent in Azure Monitor helps connect these signals into an explainable investigation, so teams can move from symptoms to evidence-backed next steps. Why AKS troubleshooting is complex Troubleshooting Azure Kubernetes Service (AKS) is complex because failures can originate in workloads, platform components, infrastructure, or the application code running on the cluster. For example, pods stuck in Pending may indicate capacity or scheduling issues, while application latency may be caused by throttling, failed probes, pod restarts, or node pressure below the app. During an incident, simply having more telemetry is not enough. Teams need a way to test likely causes, rule out unrelated signals, and keep the investigation tied to the affected workload and time window. From signal to root cause: the investigation flow The Observability Agent follows a consistent investigation pipeline: Scope the problem by identifying the most likely infrastructure resources involved, plus connected dependencies. Collect data across metrics, logs, traces, change history, and related signals. Detect anomalies using learned baselines (for metrics) and log analysis. Correlate across resources spanning infrastructure and application layers. Run deep diagnostics by invoking resource-specific tools when needed to pinpoint root cause. Summarize findings in a structured format: what happened, why it happened, and what to do next. AKS investigation data sources The agent works with telemetry already available in your Azure Monitor environment. Investigation depth improves as more relevant signals are enabled, including Container insights logs, Kubernetes events and state, Azure managed service for Prometheus, container and pod logs, Application Insights telemetry for AKS-hosted workloads, Azure Activity Log changes, control plane logs routed through diagnostic settings, and resource metadata for the cluster, node pools, workloads, and related Azure resources. Figure 1. AKS investigation data sources You don’t need to enable every telemetry source to get started. The Observability Agent uses the data already available in Azure Monitor, and its findings become more complete as more AKS and application signals are collected. Example 1: AKS infrastructure — explaining why new pods never start Consider a workload rollout on AKS where replacement pods remain stuck in Pending state. What looks like a failed release may stem from the workload definition, cluster state, or underlying infrastructure. Investigation walkthrough Symptom: rollout is blocked Replacement pods remain in Pending during rollout, and Kubernetes events show repeated scheduling failures. This indicates that the rollout is blocked before new pods can start. Workload evidence: scheduling, not startup Pod state identifies the affected workload, while Kubernetes events show repeated placement failures. The issue is therefore tied to scheduling rather than application startup or container crash behavior. Cluster evidence: capacity pressure When enabled, Prometheus node metrics show CPU and memory utilization near capacity. Cluster-level trends show resource pressure increasing at the same time as pending pods and scheduling failures. Likely cause: insufficient schedulable capacity The scheduler cannot place new pods because the relevant node pool does not have enough available capacity. The failed rollout is best explained by capacity pressure in the target node pool rather than an application crash or image startup failure. Recommended action Scale out the affected node pool or adjust workload resource requests, then retry the rollout once schedulable capacity is restored. Figure 2. AKS investigation flow The Observability Agent connects pod state, scheduling events, and node pressure to explain why the rollout is blocked and which capacity action to consider next. Example 2: Joint app-AKS investigation — tracing application latency to pod restarts Now consider a customer-facing application where users see increased latency and intermittent HTTP 5xx errors after deployment. The first symptom appears in application telemetry, but the unhealthy requests are served by pods that are repeatedly restarting in AKS. Investigation walkthrough Symptom: customer-facing service degradation After deployment, application telemetry shows increased latency and HTTP 5xx errors. The first visible impact appears at the application layer. AKS evidence: unstable pods Affected pods enter CrashLoopBackOff, restart counts increase, and Kubernetes events show back-off restarts, probe failures, or image or command errors. Container logs point to startup exceptions, missing configuration, or crash details. Resource evidence: workload-specific pressure Container memory usage approaches configured limits before restarts, while node metrics show no broad node pressure. This suggests the issue is workload-specific rather than cluster-wide capacity related. Change evidence: deployment correlation Deployment history shows a new image or configuration change shortly before restarts began, with no matching platform health event. The timing points to the latest deployment or configuration change. Recommended action Review the latest image or configuration change, inspect container logs, adjust memory limits, or roll back if needed. Focus remediation on the workload change rather than node pool scaling. This pattern shows how an application symptom can map back to AKS workload behavior. Application telemetry establishes the user impact, while Kubernetes events, container logs, and resource metrics help explain why the affected pods keep failing. Operational impact For site reliability engineers, platform teams, and IT professionals, the Observability Agent reduces the time spent moving between application and AKS telemetry. It brings relevant signals into one investigation, surfaces supporting evidence, and applies Azure Monitor and AKS context so your team can review the findings, validate the recommended path, and decide which production changes to make. Figure 3. AKS investigation results Using the Observability Agent You can start using the Observability Agent from the Azure portal in two common AKS troubleshooting flows: Investigation mode: Start an investigation from an Azure Monitor alert on an AKS resource or from an Application Insights alert for an AKS-hosted workload. The agent uses the alert context to scope the incident, correlate application and cluster telemetry, and summarize the likely cause with recommended next steps. Chat-based exploration: Open the Monitor experience in AKS and select the Observability Agent button to chat with your telemetry. Use natural language to ask follow-up questions, explore logs and metrics, detect and inspect anomalies, and narrow down likely causes. Figure 4. Starting Observability Agent from AKS Monitor experience Next steps Azure Copilot Observability Agent overview Monitor Azure Kubernetes Service with Azure Monitor Stay connected Follow this blog for ongoing deep dives, updates on current capabilities, and a preview of what's coming next. Live webinar — A walkthrough of real Observability Agent scenarios, best practices, and what's available today, along with a look at what's coming next and live Q&A with the product team. Register for the Observability Agent webinar. We'd love your feedback The Observability Agent continues to evolve based on real-world usage and operator feedback. Share your thoughts directly through the Give Feedback option in the experience, or reach us at: azureobsagent@microsoft.com345Views0likes0CommentsModern VM monitoring, powered by OpenTelemetry
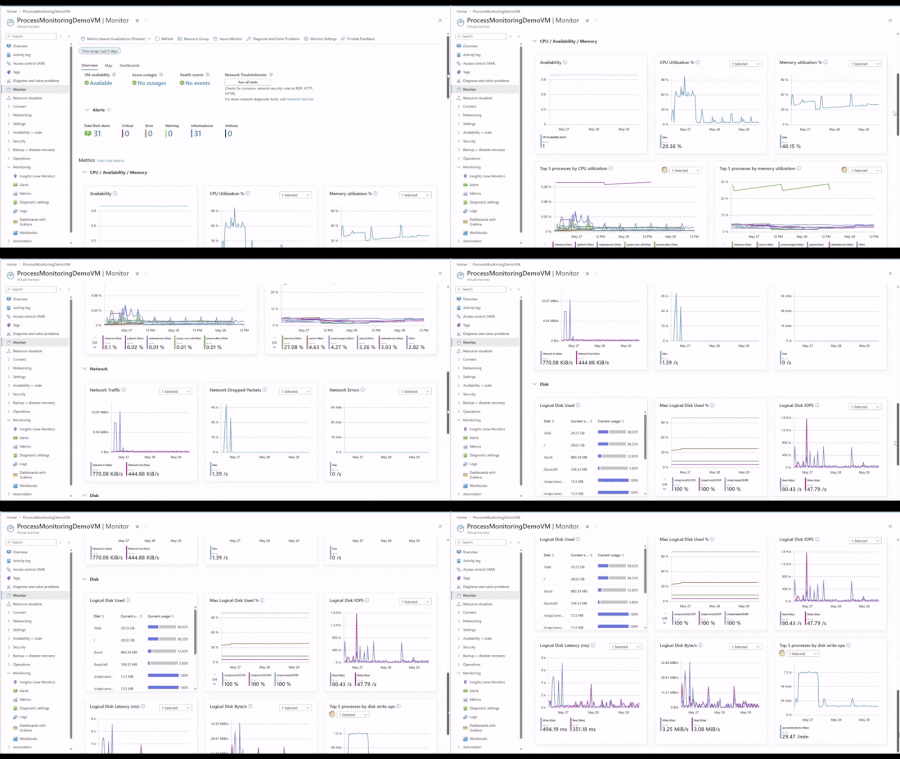
At Build 2026, we're announcing the general availability of OpenTelemetry (OTel) Guest OS metrics for Azure VMs and Arc-enabled Servers. OTel provides a standards-based foundation for VM monitoring with consistent metrics across Windows and Linux, richer Guest OS and per-process visibility, and streamlined integration with open-source and cloud-native observability tools. Alongside the GA, we're introducing an enhanced VM monitoring experience, recommended alerts, and out-of-the-box Grafana dashboards, all powered by OTel Guest OS metrics. We're also sharing upcoming VM troubleshooting capabilities in the Azure Copilot observability agent enriched by OTel Guest OS metrics. What are OpenTelemetry Guest OS metrics OTel Guest OS metrics are collected from inside a VM. Today's coverage includes a curated set of CPU, memory, disk I/O, networking, and per-process metrics including CPU utilization, memory usage, uptime, and thread count. The supported set is point-in-time and will continue to expand as the OTel Host Metrics Receiver evolves upstream. This level of visibility helps customers diagnose operating system and application issues without manually signing into individual VMs. Why they matter 1. Lower cost and faster queries Default OTel Guest OS metrics are available at no additional cost. They are stored in Azure Monitor Workspace using metric-optimized storage and pricing, providing lower cost and faster query performance compared to LA-based metrics. 2. Per-process visibility for deeper troubleshooting Customers can optionally enable per-process metrics for deeper visibility into VM resource consumption. This helps identify noisy processes, memory leaks, runaway jobs, or resource-intensive applications without manually signing into the VM. 3. Consistent metrics across Windows and Linux Use the same metric names, dashboards, and alerts across operating systems without maintaining separate monitoring configurations. 4. Native PromQL support Use PromQL with the scale and managed experience of Azure Monitor Workspace. 5. OpenTelemetry-based standardization Use the same metrics across Azure Monitor, existing OTel pipelines, or other compatible observability backends. Log Analytics (LA)‑based metrics vs OTel‑based metrics Customers running workloads on Azure VMs and Arc-enabled Servers have long relied on Log Analytics (LA)-based metrics for fleet visibility. That experience continues to be generally available and trusted by thousands of customers. We recommend evaluating your requirements to determine which approach best suits your needs. LA-based metrics remain the foundation for customers who need advanced analytics and correlation, while OTel-based metrics open new possibilities for modern VM observability. Learn more. New Capabilities Powered by OpenTelemetry VM monitoring experience powered by OpenTelemetry (GA) We're excited to announce the general availability of the enhanced monitoring experience for Azure VMs and Arc servers. This experience brings comprehensive monitoring capabilities in a single, streamlined view, helping you more efficiently observe, diagnose, and optimize your virtual machines. The new experience offers two levels of insight within one unified interface: Basic view (Host OS-based): Available for all Azure VMs with no configuration required. This view surfaces key host-level metrics including CPU, disk, and network performance for quick health checks. Detailed view (Guest OS-based): Requires simple onboarding. Azure Monitor continues to support the GA detailed view powered by Log Analytics-based metrics. Customers can now choose to power the experience using OTel Guest OS metrics, which enable recommended alerts and provide expanded visibility into Guest OS and process-level resource consumption, including CPU, memory, disk I/O, and networking. Dashboards with Grafana for VMs For deeper analysis and customization, customers can leverage Azure Monitor dashboards with Grafana powered by OTel Guest OS metrics and PromQL at no additional cost. Built-in dashboards provide out-of-the-box visualizations for at-scale monitoring, host-level monitoring, Guest OS monitoring, and per-process monitoring, while still allowing teams to: Customize panels and dashboards Run ad hoc investigations Import dashboards from the Grafana community Share dashboards using Azure RBAC and ARM/Bicep deployment support Together, the enhanced VM monitoring experience and Grafana dashboards provide both streamlined day-to-day monitoring and flexible deep troubleshooting capabilities for modern VM environments. Query metrics in the context of your resources (GA) We’re also announcing the general availability of resource-scope querying for Azure Monitor Workspace (AMW) metrics, including OTel Guest OS metrics. With resource-scope query, you can query metrics directly from the context of a resource, resource group, or subscription, without needing to know which workspace stores the data. This simplifies troubleshooting, aligns with Azure-native workflows, and enforces least-privilege access using Azure RBAC. This capability powers scenarios like querying OTel Guest OS metrics directly from the Virtual Machine resource in Azure Portal, or resources can be scoped as a dedicated data source in Grafana to query with PromQL, making it easier for application and infrastructure teams to monitor and troubleshoot in the context of their workloads. Coming soon: Observability Agent Troubleshooting for VMs (Public Preview) Today, the Observability Agent helps customers investigate issues by correlating applications, infrastructure signals, LA-based metrics, logs, alerts, health information, and recent changes into a guided investigation narrative. Support for OTel Guest OS metrics is coming soon, extending investigations with richer Guest OS and per-process visibility. With OTel Guest OS metrics, the Observability Agent will be able to incorporate finer-grained operating system and process-level insights into its analysis, helping customers more quickly identify resource bottlenecks and understand their impact on application performance. Instead of manually piecing signals together across multiple tools and timelines, customers will receive a guided investigation summary with likely causes and recommended next steps. Combined with the new VM monitoring experience and Grafana dashboards, customers will have both AI-assisted investigations and powerful manual troubleshooting tools built on the same OTel foundation. Onboarding VMs at scale to OpenTelemetry Onboarding Azure VMs and Arc-enabled Servers to OTel Guest OS metrics is now simpler and more cost-efficient than ever. For teams getting started at scale, the easiest path is through the Monitoring Coverage experience in the Azure portal, where you can review recommended resources and onboard VMs through a guided workflow. Customers that prefer infrastructure-as-code can use ARM and Bicep templates to apply the same monitoring configuration programmatically. Azure Advisor recommendations provide another seamless entry point for onboarding, proactively identifying VMs that are not fully monitored and guiding customers to enable OTel -based monitoring with a few clicks. This helps teams continuously improve coverage across their fleet without needing to manually audit resources. Customers can now also reuse an existing Data Collection Rule (DCR) during onboarding, making it easier to standardize monitoring across large VM fleets. After onboarding, teams can centrally evolve their monitoring configuration by updating that DCR to collect additional metrics and logs, with changes applying across all associated VMs. Get Started Explore the new OpenTelemetry-powered experiences today: Enable enhanced monitoring for an Azure virtual machine - Azure Monitor Migrate from logs-based to OpenTelemetry metrics for Azure virtual machines - Azure Monitor Metrics experience for virtual machines in Azure Monitor - Azure Monitor Use Dashboards with Grafana for Azure Virtual Machines - Azure Monitor999Views3likes1CommentAzure Monitor SLIs now Generally Available
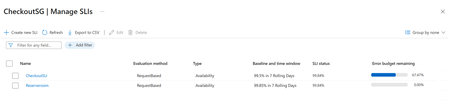
Azure Monitor SLIs are now generally available Service Level Indicators (SLIs) and Service Level Objectives (SLOs) in Azure Monitor are now generally available. Teams can now measure reliability based on customer experience, not just infrastructure signals. SLI: A quantitative measure of how well an application or service is performing from the customer’s point of view. SLO: A defined target for an SLI that represents how good or bad the SLI is over a given time-period. This is also referred to as a baseline in Azure Monitor. Traditional monitoring shows what is happening across your systems, but not always what customers are experiencing. A service can be technically available and still feel unreliable because of latency, partial failures, or dependency issues. SLIs help close that gap by measuring reliability from the customer’s point of view. With GA, Azure Monitor now brings SLI authoring, SLO tracking, error budgets, and burn rate–based alerting into one experience, helping teams focus on whether they are meeting the reliability their customers expect. What Azure Monitor SLI helps you do Azure Monitor SLI lets you measure availability and latency with either request-based or window-based evaluation methods. In Azure Monitor, SLIs are defined at the Service Group level, which provides a logical representation of your application across multiple resources. This gives teams a clearer view of application health, customer impact, and the signals that matter most. SLIs continuously evaluate your service by using existing Azure Monitor metrics and store the resulting evaluations in your Azure Monitor Workspace. Azure Monitor uses these SLI evaluations to power error budgets, burn rate visualization, and alerting. This helps teams spot reliability issues earlier and make better release and incident response decisions. Get started To get started, you’ll need: A Service Group. Application metrics flowing into an Azure Monitor Workspace, for example through Managed Prometheus or OpenTelemetry Collect and analyze OpenTelemetry data with Azure Monitor (Preview) - Azure Monitor | Microsoft Learn Learn more here. Summary Azure Monitor SLI helps teams measure customer experience, track reliability against clear targets, and respond sooner with error budgets and burn rate–based alerting. Learn more in the product documentation and start defining SLIs for your services in Azure Monitor today.540Views0likes0CommentsAzure Monitor Metrics Export Generally Available
Today, we’re excited to announce the general availability of Azure Monitor Metrics Export using data collection rules (DCRs). A scalable, flexible way to continuously export platform metrics with dimensional fidelity, lower latency, and more control over what you send downstream. Azure Monitor Metrics Export is configured through data collection rules and can route platform metrics to Azure Storage accounts, Azure Event Hubs, or Azure Log Analytics workspaces. Compared to diagnostic settings, DCR-based metrics export supports multidimensional metrics, metric-name filtering, and improved scalability for large environments. Here are some of the key benefits of Azure Monitor Metrics Export: Control what you export: You can export all supported metrics for a resource type or filter to specific metric names, helping reduce downstream volume and manage cost. Preserve dimensional fidelity: The DCR-based metric export supports multidimensional metrics, making downstream analysis and correlation more meaningful. Get faster export latency: End-to-end export latency is typically within about 3 minutes, improving time to insight for operational and analytics workflows. With Azure Monitor Metrics Export, organizations can build more scalable observability pipelines, route metrics to the destinations that fit their architecture, and unlock richer analysis for operations, reporting, and integration scenarios. What’s new in GA With general availability, Azure Monitor Metrics Export offers a production-ready path to continuously stream supported platform metrics using data collection rules. Azure Monitor Metrics Export now covers 44 Azure regions, up from 12 regions previously. This expanded footprint helps more customers adopt DCR-based metrics export closer to where their resources run, improving rollout flexibility for global deployments. Customers can export metrics to Azure Storage, Azure Event Hubs, or Azure Log Analytics, preserve metric dimensions, and filter by metric name to better control downstream volume and cost. Learn more about metrics export using data collection rules. We’re excited to make Azure Monitor Metrics Export generally available and look forward to seeing how customers use it to build more reliable, cost-conscious, and extensible monitoring solutions on Azure.484Views0likes0CommentsPUBLIC PREVIEW - Azure Monitor - Collect Azure Resource Platform Logs at Scale with DCRs
PUBLIC PREVIEW - Azure Monitor - Collect Azure Resource Platform Logs at Scale with DCRs. How DCR-based platform logs simplify the telemetry collection for organizations managing 1,000+ resources.1.1KViews2likes1Comment
Is 94% of your syslog just noise? Now you can filter it out before ingestion.
At Microsoft Build 2026, we are announcing the public preview of multi-stage transformations for Azure Monitor Data Collection Rules (DCRs). Multi-stage transformations let you filter, aggregate, parse, and map your logs at the point of collection, before data is ingested into your workspace. Processing happens in a defined sequence of steps called processors, and you can chain them together to build precise data pipelines that reduce ingestion volume, improve data quality, and lower monitoring costs. Processors in orange run on the agent (client-side). The KQL transform in green runs in the ingestion pipeline. Data volume shrinks at each stage. What are multi-stage transformations? A Data Collection Rule defines how Azure Monitor collects, transforms, and routes telemetry data. Until now, DCRs supported a single KQL transformation step on the ingestion side. Multi-stage transformations extend this model by introducing a processor pipeline: an ordered sequence of processing steps that run on the agent (client-side) or at the ingestion endpoint (ingestion-side), or both. Each processor performs one operation: filtering records, parsing structured fields from raw text, renaming or dropping columns, aggregating metrics, or running a KQL expression. Processors execute in order, and the output of one becomes the input to the next. This composable design replaces what previously required complex, monolithic KQL queries or external pre-processing scripts. Client-side processors run on the Azure Monitor Agent before data leaves the source machine. This means filtered and aggregated data never crosses the network, reducing both egress and ingestion costs. Ingestion-side processors run in the Log Analytics ingestion pipeline and support KQL-based transformations for more complex logic. Key applications The most immediate use case is cost reduction. When you can filter records on the agent before they leave the machine, you stop paying for data you never query. Syslog is the classic example: in many environments, informational and debug messages make up the vast majority of volume, and none of it gets looked at unless something breaks. A single filter processor can cut that stream by 90% or more. Aggregation is equally powerful for high-frequency telemetry. Performance counters sampled every 15 seconds produce millions of records per hour across a large fleet, but most dashboards and alert rules only need 5-minute granularity. Rolling up those samples on the agent, before they cross the network, dramatically reduces ingestion without losing the operational signal your team actually relies on. Beyond cost, multi-stage transformations improve the quality of the data that does reach your workspace. Parsing structured fields out of raw text (JSON payloads, XML event data, CEF security logs) at collection time means downstream queries are simpler and faster. And because each processor handles one step in a readable sequence, maintaining the pipeline is far easier than debugging a single monolithic KQL expression that tries to do everything at once. To make this concrete, let’s walk through the two highest-impact patterns we see with preview customers: filtering noisy syslog data and aggregating performance counters. Filter data before ingestion The filter processor evaluates each record against conditions you define and drops anything that does not match. Because filtering runs on the agent, dropped records are never serialized, transmitted, or ingested. This makes it the highest-impact processor for cost reduction. You configure filters using simple field-level conditions: specify a column name, an operator (equals, not equals, greater than, contains, etc.), and a value. Conditions can be combined with AND/OR logic for precise control. Scenario: Keep only warning-and-above syslog messages A typical syslog stream generates thousands of informational and debug messages for every actionable warning or error. With a filter processor, you set a severity threshold, and the agent drops everything below it before transmission. In this example, the filter keeps records where SeverityNumber >= 4 (Warning). The 57,000 debug and informational records per hour are dropped on the machine. Only the 3,250 actionable records are transmitted and ingested, a 94% reduction in syslog volume. Filters also support compound conditions. For example, you can keep auth-facility errors OR any critical message regardless of facility, all in a single processor step. This kind of targeted filtering is especially useful for security teams that need specific event categories without paying for the full syslog firehose. Aggregate logs before ingestion The aggregate processor rolls up high-frequency records into time-windowed summaries on the agent. This is especially valuable for performance counters, heartbeat signals, and any telemetry where per-second granularity is not needed for operational decisions. You configure the processor with a time window (for example, 5 minutes), the aggregation operators to apply (average, sum, min, max, count), and the dimension columns to group by (such as host name and counter name). The agent collects records within each window, computes the aggregates, and emits one summary record per group. Scenario: Roll up performance counters into 5-minute summaries A fleet of 500 VMs, each reporting 10 performance counters every 15 seconds, generates roughly 2 million raw records per hour. Most operational dashboards and alert rules use 5-minute granularity, making the per-sample detail redundant. With the aggregate processor, each agent rolls up its local counter stream into 5-minute windows, grouped by counter name. Each summary record contains the average, maximum, and sample count for that window. Raw data After aggregation (5-min windows) Records per VM per hour 2,400 (10 counters x 4/min x 60 min) 120 (10 counters x 12 windows) Records across 500 VMs per hour 1,200,000 60,000 Volume reduction 95% Operational fidelity Per-sample (15s) Avg, max, and count per 5 min Because the aggregation runs on the agent, the reduced data set is what gets transmitted and ingested. Dashboards and alerts that rely on 5-minute granularity work identically, but ingestion costs drop by 95%. Route the output to a custom table with columns that match the aggregate output (average, max, count, and your dimension columns). Chain processors for complete pipelines Processors are composable. A common pattern chains a header processor (to convert raw data into tabular format), a filter (to drop irrelevant records), a parse step (to extract fields from structured payloads), and a column drop (to remove fields not needed downstream). Scenario: Parse, filter, and slim down Windows Event logs Consider a security team that needs logon success and failure events (Event IDs 4624 and 4625) from the Windows Security log. The raw event stream contains hundreds of event types, each carrying a large XML payload. A four-step pipeline handles this: Header processor converts the raw event stream into tabular rows Parse processor extracts EventID and TargetUser from the XML payload into typed columns Filter processor keeps only logon success (4624) and failure (4625) events, dropping everything else Drop processor removes the bulky RawXml and RenderingInfo columns that are no longer needed The result is a lean, security-focused data set containing only the events and fields the team actually queries. Each step is independent and can be modified without affecting the others. Authoring multi-stage DCRs Multi-stage transformations are available through the Azure portal and through the REST API (version 2025-05-11). The portal provides a visual editor for building processor pipelines, previewing the schema at each stage, and validating the configuration before deployment. The Transform tab in the DCR data source configuration lets you add processors at each stage and preview the resulting schema. For infrastructure-as-code workflows, the full DCR JSON can be authored and deployed via ARM templates, Bicep, or direct REST API calls. To get started: Open Azure Monitor in the Azure portal and navigate to Data Collection Rules Create a new DCR or edit an existing one In the data source configuration, select Edit transformation Author your transformation logic across client and ingestion stages using the set of available processors Preview the schema output at each stage to verify the pipeline produces the expected result Save and associate the DCR with your target resources Preview notes: Multi-stage transformations are available in public preview starting June 3, 2026 Client-side processors require Azure Monitor Agent version 1.35 or later Aggregation output must be routed to custom tables (standard table schemas do not match aggregate output) Data collection, workspace ingestion, and alert rules may incur costs based on the settings you enable. Preview pricing may differ from general availability pricing. See Azure Monitor pricing for current rates To learn more, see: Data Collection Rules overview Looking ahead Multi-stage transformations are part of our continued investment in giving teams control over their data before it reaches the workspace. During the preview period, we plan to expand processor coverage, add support for additional data source types, and incorporate user feedback into the authoring and validation experience. We are also exploring how multi-stage transformations can serve as the foundation for advanced scenarios such as data scrubbing, inline enrichment from external reference data, and AI-assisted pipeline authoring. These capabilities will build on the same processor model, so pipelines you create today will extend naturally as new processors become available. We welcome your feedback as you try multi-stage transformations. Use the feedback options in the Azure portal, or reach out through your Microsoft account team. This feature is currently in preview. Previews are provided "as-is," "with all faults," and "as available," and are excluded from the service level agreements and limited warranty. For more information, see Supplemental Terms of Use for Microsoft Azure Previews]. Statements in this post about future plans and capabilities represent our current intentions and are subject to change. They should not be relied upon when making purchasing decisions.2KViews3likes2Comments
When Telemetry Volume Gets Real: Azure Monitor pipeline’s Performance Story!
What is Azure Monitor pipeline? Azure Monitor pipeline provides centralized governance and a single point of control that runs close to your data sources, so you can filter, transform, aggregate, and route telemetry before it's sent to Azure Monitor. This approach helps you reduce ingestion volume, improve reliability in disconnected environments, and apply consistent data processing across hybrid and multi-cloud deployments. Built on OpenTelemetry technology, the pipeline supports standard ingestion protocols including Syslog and OTLP, enabling it to receive telemetry from a wide range of clients and environments. Read more about Azure Monitor pipeline here - Azure Monitor pipeline GA: Centralized, Secure Telemetry Ingestion Azure Monitor pipeline Performance A single replica on a stock 8-core node sustains ~200,000 Syslog messages per second end-to-end into Log Analytics — roughly 17 billion events or ~20 TB per day — using only ~2.8 GB of working-set memory. That's ~2.5 TB/day of throughput per vCPU, on commodity hardware, with no special tuning. (Measured on pipeline v1.1.1, May 2026.) Find more detailed performance information in the table below - vCPUs Example node Syslog Basic* Syslog Fully Formed* CEF Fully Formed* 2 Standard_D2as_v6 ~50,000/sec ~35,000/sec ~17,000/sec 4 Standard_D4as_v6 ~100,000/sec ~70,000/sec ~35,000/sec 8 Standard_D8as_v6 ~200,000/sec ~150,000/sec ~65,000/sec 16 Standard_D16as_v6 ~400,000/sec ~300,000/sec ~130,000/sec Syslog Basic* – Azure Monitor pipeline ingesting raw syslog data into Azure Monitor custom table Syslog Fully Formed* – Azure Monitor pipeline ingesting syslog data in Azure Monitor standard syslog table CEF Fully Formed* – Azure Monitor pipeline ingesting CEF data in Azure Monitor standard CEF table Further, adding replicas scales throughput linearly. Linear scaling is what makes the rest of the performance story credible in practice: if one 4-core node handles about 100,000 Syslog logs per second, eight replicas scale that to roughly 800,000 logs per second without changing the architecture. In other words, you do not hit an arbitrary throughput wall as volume grows—you add cores or replicas and get predictable capacity growth. We are continuously improving these numbers, and the latest guidance is documented here -- Azure Monitor pipeline performance and sizing - Azure Monitor | Microsoft Learn Why this Performance Story Matters? Zero-config core usage. The pipeline automatically uses every available CPU core. Move to a bigger node and it just goes faster — no tuning, no config. Backpressure, not data loss. When you exceed capacity, the pipeline applies TCP backpressure to senders instead of dropping messages. Rising send latency is your scale-up signal. Predictable sizing math. Pick your per-vCPU rate, divide your peak logs/sec, add 30% headroom, round up. Done. Efficient memory usage. ~2.8 GB working-set to push 200,000 logs/sec means you're paying for throughput, not overhead. One sizing tip worth knowing: make sure senders open at least as many concurrent TCP connections as there are cores on the pipeline node. The pipeline distributes traffic across cores by source connection, so too few connections leave cores idle. How this Stacks Up? Telemetry pipelines are usually sized per CPU core, making per-core throughput a practical way to reason about capacity and scaling. Against that backdrop, ~2.5 TB/day per vCPU for Syslog Basic — and ~65,000–150,000 logs/sec, on 8 cores for fully formed records — highlights the per-core efficiency of Azure Monitor pipeline for edge log collection. Exact numbers will vary based on event size and processing applied, but the key point is consistency: you get substantial throughput per core, and it scales linearly as you add capacity. Less hardware to move the same volume, efficient memory usage, backpressure instead of loss, and linear growth — that's the performance case for Azure Monitor pipeline. Get started Spin up a pipeline group on your Arc-enabled cluster, point your Syslog/CEF senders at it, and watch the throughput numbers above hold up in your own environment! Read more about getting started here -- What is Azure Monitor pipeline? - Azure Monitor | Microsoft Learn253Views0likes0CommentsWhat’s new in Observability at Build 2026
At Build 2026, Azure Monitor introduces major advancements in end-to-end observability, extending across AI agents, applications, and infrastructure with OpenTelemetry at its core. New capabilities with Azure Copilot Observability agent, SLI/SLO support, and smarter alerting help teams move faster from detection to root cause while reducing noise and manual effort. Together, these innovations enable developers and SREs to operate modern, AI-driven systems with greater insight, efficiency, and alignment to customer experience.1.2KViews2likes0Comments