updates
100 Topics
Query Azure Resource Graph from Azure Monitor
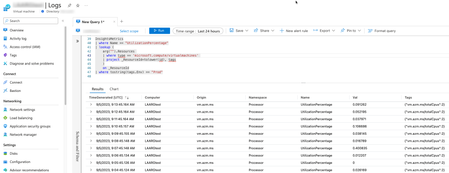
Azure Monitor now lets you query data in Azure Resource Graph from your Log Analytics workspace. You can utilize this feature to make your Azure Log Analytics queries aware of your resource’s properties such as tags, resource attributes and much more. You can run cross-service queries by using any client tools that support Kusto Query Language (KQL) queries, including the Log Analytics web UI, workbooks, PowerShell, and the REST API. Read more here23KViews10likes21CommentsMaking Azure the Best Place to Observe Your Apps with OpenTelemetry
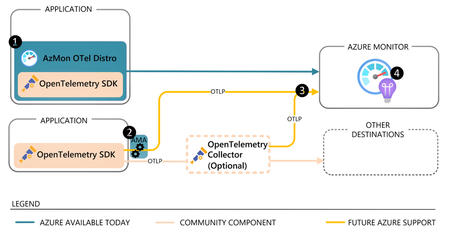
Our goal is to make Azure the most observable cloud. To that end, we are refactoring Azure’s native observability platform to be based on OpenTelemetry, an industry standard for instrumenting applications and transmitting telemetry.23KViews12likes3Comments
Log Analytics Query packs
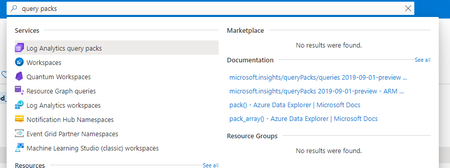
Introducing Log Analytics query packs - your new way to store and share queries in Log Analytics. Query packs is a huge leap forward in Log Analytics' ability to store, manage and share queries - allowing granular control of queries and enabling cross resource and cross subscription sharing of queries.20KViews1like3CommentsJoin Azure Monitor Monthly Connections on July 30 for live Q&A
Join the Azure Monitor engineering team for our next 'Monthly Connections' event on July 30, 2020. This will be an "Ask-Me-Anything (AMA)" event where you can have all of your monitoring questions answered live by our panel of experts. We will also highlight all the new scenarios & capabilities launched in the last month, that you can start using today!17KViews5likes6CommentsAccelerate your observability journey with Azure Monitor pipeline (preview)
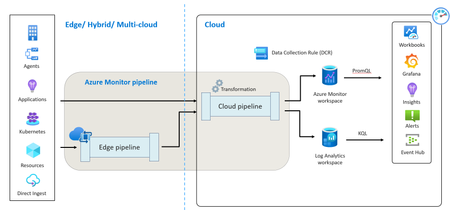
In the ever-evolving landscape of digital infrastructure, transparency in resource and application performance is imperative. Success hinges on visibility, and that’s true whether you’re operating on Azure, on-premise, or at the edge. As organizations scale their infrastructures and applications, the volume of observability data naturally increases. This surge can complicate the management of networking, data storage and ingestion, often forcing a trade-off between cost management and observability. The complexity doesn’t end there. The very tools designed to ingest, process, and route this data can be both costly and complex, adding layers of operational challenges. Moreover, edge infrastructure is deployed near IoT devices for optimal data processing, high availability, and reduced latency. This adds its own set of challenges when it comes to collecting telemetry from such constrained environments. Recognizing these challenges, our team has been focused on providing a robust, highly scalable, and secure data ingestion solution through Azure Monitor. We are thrilled to announce the preview of the Azure Monitor pipeline at edge. What is Azure Monitor pipeline? Azure Monitor pipeline, similar to ETL (Extract, Transform, Load) process, enhances traditional data collection methods. It streamlines data collection from various sources through a unified ingestion pipeline and utilizes a standardized configuration approach that is more efficient and scalable. This is particularly beneficial for cloud-based monitoring in Azure. We are now extending our Azure Monitor pipeline capabilities from the cloud to the edge, enabling high-scale data ingestion with centralized configuration management. What is Azure Monitor pipeline at edge? Azure Monitor pipeline at edge is a powerful solution designed to facilitate high-scale data ingestion and routing from edge environments to Azure Monitor for observability. It leverages the robust capabilities of the vendor-agnostic tool - OpenTelemetry Collector, which is used by enterprises worldwide to manage high volumes of telemetry each month. With the Azure Monitor pipeline at edge, organizations can tap into the same highly scalable platform with a standardized configuration and reliability. Whether dealing with petabytes of data or seeking consistent observability experience across Azure, edge, and multi-cloud, this solution empowers organizations to reliably collect telemetry and drive operational excellence. The Azure Monitor pipeline at edge is equipped with out-of-the-box capabilities to receive telemetry from a diverse range of resources and route it to Azure Monitor. Here are some key features: High scale data ingestion: Customers have various devices and resources at edge, emitting high volume of data. With Azure Monitor pipeline at edge, you can seamlessly scale to support ingestion of high volume of data in the cloud. Azure Monitor pipeline can be deployed on your on-premises Kubernetes cluster as an Arc Kubernetes cluster extension. This allows it to adapt to your data scaling needs by running multiple replica sets and provides you with full control to define workflows and route high-volume data to Azure Monitor. Observing resources in isolated environments: In the manufacturing sector, resources are often located in isolated network zones without direct cloud connectivity, posing challenges for telemetry collection. With the Azure Monitor pipeline at edge, combined with Azure IoT Layered Network Management, you can facilitate a connection between Azure and Kubernetes clusters in isolated networks, deploy the Azure Monitor pipeline at edge, collect data from resources in segmented networks, and route it to Azure Monitor for comprehensive observability. Reliable data ingestion and prevent data loss: Edge environments frequently encounter intermittent connectivity, leading to potential data loss and disrupting data continuity. The Azure Monitor pipeline at edge allows you to cache logs during periods of intermittent connectivity. When connectivity is re-established, your data is synchronized with Azure Monitor, preventing data loss. Getting started It’s super easy to get started! You need to deploy the Azure Monitor pipeline on a single Arc-enabled Kubernetes cluster in your environment. Once that is done, you can configure your resources to emit the telemetry to Azure Monitor pipeline at edge and ingest into Azure Monitor for observability. Once you Arc-enable your on-prem Kubernetes cluster and the prerequisites are met, go the Extension section, select Azure Monitor pipeline extension (preview) and create the instance. Alternatively, from the search bar in the Azure portal, select Azure Monitor pipeline and then click Create. Enter the information related to the pipeline instance. The Dataflow tab allows you to create and edit dataflows for the pipeline instance. Configure your resources to emit the telemetry to the Azure Monitor pipeline. Learn more in our documentation. Pricing There is no additional cost to use Azure Monitor pipeline to send data to Azure Monitor. You will be only charged for data ingestion as per the current pricing. FAQ What telemetry can be collected using Azure Monitor pipeline? Currently, in public preview, you can collect syslogs and OTLP logs using Azure Monitor pipeline at edge. We will keep expanding the data collection capabilities based on your feedback and requirements. How can I perform transformations on the telemetry that is collected? You can certainly transform your telemetry! Since this is an extension of Azure Monitor pipeline, you can perform the data collection transformations in the Azure Monitor pipeline at cloud. Is this another agent for data collection? Azure Monitor pipeline at edge is engineered to function in environments where installing agents on resources is not feasible, whether due to technical limitations or warranty concerns. It enables you to get the telemetry from these resources and acts as a central forwarding component to ingest high volume data. I have 100 Linux servers in my on-prem environment. Do I need to deploy Azure Monitor pipeline at edge on all of them? You need to deploy the Azure Monitor pipeline at edge on a single Arc-enabled Kubernetes cluster and configure it to ingest data into Azure Monitor. Once that is completed, you can configure your Linux servers to emit telemetry to the Azure Monitor pipeline at edge instance.13KViews7likes3CommentsLog Analytics results upgrade
Log Analytics team has shipped one of it's most significant updates to date - a new and upgraded results set grid. The new results set boasts a brand new experience and designed aimed at empowering Log Analytics users to do more with Logs. The new result set introduces numerous new features and improvements and is designed to be more accessible and easy to use. Users can now use on grid filters, drag and drop actions and even Pivot mode to easily analyze their query results with no KQL knowledge needed.11KViews10likes6CommentsAnnouncing the Launch of Customizable Email Subjects for Log Search Alerts V2 in Azure Monitor
We are thrilled to announce the launch of a new feature in Azure Monitor: Customizable Email Subjects for Log Search Alerts V2, available during May. What it is Customizable Email Subjects for Log Search Alerts V2 is a new feature that enables customers to personalize the subject lines of alert emails, making it easier to quickly identify and respond to alerts with more relevant and specific information. How it works This feature allows you to override email subjects with dynamic values by concatenating information from the common schema and custom text. For example, you can customize email subjects to include specific details such as the name of the virtual machine (VM) or patching details, allowing for quick identification without opening the email. Getting Started To get started with Customizable Email Subjects for Log Search Alerts V2, you can use the following methods: Using ARM Template: Create an alert rule with action properties using an ARM template. This option will be available during May. In order to create an alert rule with a customize email subject you should use ARM template with the latest API version (2021-08-01): Resource Manager template samples for log search alerts - Azure Monitor | Microsoft Learn And add the action properties parameter with the value of the subject (including static and dynamic values), for example: { "actionProperties": { "Email.Subject": "This is a custom email subject" } } At the end of the blog post you can find an example attached to an ARM template for your use. Using UI: Create an alert rule with action properties using the UI. This option will be available during June. How to use Dynamic values? To customize the email subject, you should use the action properties. The action properties are specified as key/value pairs by using static text, a dynamic value extracted from the alert payload, or a combination of both. The format for extracting a dynamic value from the alert payload is: ${<path to schema field>}. For example: ${data.essentials.monitorCondition}. Use the format of the common alert schema to specify the field in the payload, whether or not the action groups configured for the alert rule use the common schema. Looking Forward We are confident that this feature will significantly enhance your monitoring experience. By providing personalized alert emails, you can quickly identify and respond to issues with more relevant and specific information. Your Feedback Matters We look forward to your feedback, for questions or feedback, feel free to reach out to nolavime@microsoft.com or use the Give Feedback form directly in the Azure Monitor portal.11KViews2likes1CommentComprehensive network observability for AKS through Azure Monitor
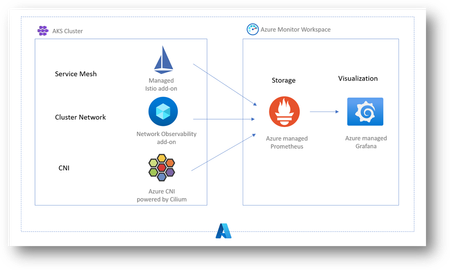
Get complete visibility into all the layers in the AKS cluster network through Azure Monitor. Incorporating the best of cloud native and Azure innovation - customers now have access to the best solutions for network observability.10KViews4likes0Comments