threat hunting
251 TopicsAgent 365 connector: Monitor, hunt, and investigate AI agent activity in Microsoft Sentinel
As enterprises scale the use of AI agents, SOC teams need visibility into AI agent behavior. The Agent 365 connector, now in public preview, streams rich agent telemetry from Agent 365 into Microsoft Sentinel data lake. Agent activity, such as agent data exposure or access drift, is surfaced alongside other security data, giving SOC teams a unified view across digital environments. AI Agent actions are correlated with agent identity, endpoint, and cloud signals, enabling analysts to run end‑to‑end investigations using KQL, graph, and MCP-powered workflows. Why this matters for organizations By centralizing security and AI agent telemetry in Sentinel data lake, organizations establish a unified control plane for securing AI agents. This enables security teams to analyze agent activity in context with broader signals and investigate using familiar Sentinel tools. This unlocks the ability for SOCs to detect risky or anomalous agent behavior early, understand impact quickly, and respond with speed and confidence. As AI agents take on real operational responsibility, this level of visibility is critical to prevent blind spots, reduce risk, and ensure agents operate safely at enterprise scale. End‑to‑end visibility into AI agent behavior: A centralized view of AI agent behavior allows AI agents to be treated as first-class entities alongside users, identities, endpoints, and workloads. Advanced hunting with KQL: Hunt using KQL to proactively uncover unusual AI agent execution patterns, sensitive actions, or activity without clear human context. These hunts help surface potential risk early using the same workflows already used for other security data. Analyzing blast radius and impact with Sentinel graph: Security teams can correlate AI agent activity with identities, endpoints, and cloud resources to understand blast radius and potential impact during an investigation. By pivoting across related entities in Sentinel, analysts can assess how agent actions connect to the broader environment and support deeper, end‑to‑end investigations. Querying agent data through MCP: Use MCP to surface agent observability data through AI assistants, letting analysts pull agent telemetry into investigation workflows alongside other Sentinel data. Agent 365 connector key capabilities Install the Agent 365 connector with a single click using Sentinel Content Hub in the Defender portal. Once enabled, two capabilities come online automatically: Unified agent telemetry across Agent 365 agent experiences: Rich Agent 365 agent telemetry streams into Sentinel data lake, ready to analyze alongside identity, endpoint, and cloud signals using familiar SOC workflows. ASIM unified schema for AI agent observability: Agent 365 agent observability data is normalized into an ASIM-aligned schema so it is consistent, queryable, and ready for analytics and detections. With the connector in place, Sentinel data lake becomes the system of record and the control plane for Agent 365 agent security—turning agent behavior into first-class security signals across SecOps workflows like hunting, investigation, detection engineering, and response. Use cases Prevent sensitive data exposure from misconfigured agents When an AI agent is granted broader access than intended, a crafted prompt could override safeguards and expose confidential data. With agent telemetry, security teams can trace the full execution path—from prompt to tools to data access—to quickly identify the root cause and contain the exposure. Detect and control agent access drift over time As agents take on new tasks, their permissions can expand beyond the original scope, often without clear visibility. Agent telemetry enables continuous behavioral baselining, making it easier to spot abnormal access patterns early and prevent privilege misuse before it escalates. Uncover hidden lateral movement across agent workflows Agents often collaborate and delegate tasks across systems, creating complex chains of execution that are difficult to track. Agent telemetry provides visibility into these interactions, mapping delegation paths and helping teams understand and limit the potential blast radius. Defend against prompt injection and manipulation attacks Attackers can craft prompts to override agent instructions and manipulate behavior. By capturing prompts and reasoning flows, agent telemetry enables detection of these attacks and provides the context needed to investigate and remediate quickly. Accelerate SOC investigations with end-to-end visibility When an agent is involved in a security alert, understanding its actions can be challenging. Agent telemetry correlates prompts, identities, tools, and data access into a unified timeline, giving SOC teams the clarity needed to investigate faster and respond with confidence. Strengthen governance and compliance for AI agents Organizations need visibility into what agents exist and what data they can access. Agent telemetry provides a comprehensive audit trail of agent activity and access patterns, supporting compliance reporting and policy enforcement. Enable proactive threat hunting on agent behavior Security teams need to stay ahead of emerging risks as agent usage grows. Agent telemetry enables advanced hunting across agent activity, helping detect anomalies, uncover patterns, and identify threats before they impact the organization. Get started with Agent 365 connector Getting started is straightforward. In the Microsoft Defender portal, navigate to Microsoft Sentinel Open Content hub and search for Agent 365 Install the Agent 365 Connector (if not already installed) Open the connector page and select Connect to begin ingestion Once connected, AI agent telemetry starts flowing into Sentinel, ready for hunting, investigation, and response. Data ingestion and analytics are billed using existing Sentinel meters. Learn more Find the Agent 365 data connector | Microsoft Learn Discover and manage Sentinel out-of-the-box content | Microsoft Learn Connect data sources to Sentinel by using data connectors | Microsoft Learn Sample KQL queries for Sentinel data lake | Microsoft Learn Watch the Sentinel data lake video playlist | Microsoft Security Get started with Sentinel data lake | Microsoft Learn860Views1like0CommentsXdrLogRaider Defender XDR portal telemetry
A Microsoft Sentinel custom data connector that ingests Microsoft Defender XDR portal-only telemetry — configuration, compliance, drift, exposure, governance — that public Microsoft APIs (Graph Security, Microsoft 365 Defender, MDE) don't expose. https://github.com/akefallonitis/xdrlograider— Defender XDR portal telemetry Happy Hunting 🥳 🎉68Views0likes2CommentsIdentity Attack Graph in Microsoft Sentinel
Identity is now one of the most important attack surfaces in cloud security. In many real-world incidents, attackers do not rely only on malware or network movement. Instead, they abuse identities, permissions, role assignments, group memberships, service principals, and misconfigured access paths to move from an initial compromise to high-value resources. This is why the new Identity Attack Graph in Microsoft Sentinel is an important capability. It helps security teams visualize how identities are connected to Azure resources and how an attacker could potentially move from one identity to another resource through permissions and relationships. What is the Identity Attack Graph? The Identity Attack Graph in Microsoft Sentinel provides a visual way to understand how identities, permissions, groups, and Azure resources are connected. Instead of manually checking multiple portals, logs, and role assignments, the graph helps analysts understand relationships such as: Which identities have access to specific Azure resources Which users or service principals are over-privileged Which groups provide indirect access to sensitive resources Which identities may have a path to critical assets What the potential blast radius of a compromised identity could be How attackers could move laterally through identity and permission relationships This is especially useful because identity risk is often not obvious when looking at a single user, group, or role assignment in isolation. The real risk usually appears when these relationships are connected together. A user may not directly have access to a sensitive resource, but the user may be a member of a group that has access to another resource, which then has permissions that create a path toward a high-value asset. The Identity Attack Graph helps expose these hidden relationships. Why this matters In many Azure environments, permissions grow over time. Users change roles, groups are reused, emergency access is granted, service principals are created, and temporary permissions are not always removed. As a result, organizations often end up with: Too many privileged identities Unused or stale permissions Service principals with excessive access Guest users with unnecessary permissions Groups that provide indirect access to sensitive resources Subscription-level roles that are broader than required Lack of visibility into who can reach critical assets Traditional investigation usually requires analysts to move between several places, including Microsoft Entra ID, Azure RBAC, Azure Activity logs, Sentinel queries, Defender XDR, and Azure Resource Graph. The Identity Attack Graph reduces this complexity by presenting identity relationships as a connected graph. This makes it easier to answer practical security questions such as: “What can this identity access?” “What happens if this user is compromised?” “Which identities have a path to critical resources?” “Which access path should we remediate first?” “Which permissions create the highest risk?” “Why does this identity have access to this asset?” Key use cases The feature can support several important identity security and cloud security scenarios. 1. Attack path discovery Security teams can use the graph to identify how an attacker could move from a compromised identity to a sensitive Azure resource. This is useful during both proactive assessments and active incident response. For example, if a user account is suspected to be compromised, the graph can help identify which resources may be reachable through that identity’s direct or indirect permissions. 2. Blast-radius analysis When an identity is compromised, one of the first questions is: What could the attacker access with this identity? The Identity Attack Graph can help analysts understand the potential impact of a compromised user, group, service principal, or managed identity. This can help with containment, prioritization, and communication with stakeholders. 3. Over-privileged identity detection The graph can help identify identities that have more permissions than they need. Include: Users with Owner or Contributor access at subscription level Service principals with broad permissions Guest users with privileged access Groups that grant access to sensitive resources Identities that have access to multiple critical assets This is useful for enforcing least privilege and reducing identity attack surface. 4. Privileged access review IAM and cloud security teams can use the graph to support access reviews. Instead of only reviewing a list of role assignments, teams can understand the real impact of those permissions. This helps answer: Is this role assignment still required? Does this group create unnecessary risk? Does this identity have access to critical resources? Is this access direct or inherited? Is this path expected or suspicious? 5. Incident response and threat hunting For SOC teams, the graph can support investigations involving: Suspicious sign-ins Compromised users Privilege escalation Suspicious role assignments Lateral movement Service principal abuse Unusual access to sensitive resources The graph does not replace logs or hunting queries, but it gives analysts a faster way to understand relationships and prioritize what to investigate next. Important prerequisites and setup notes During my evaluation, there were a few important setup requirements that should be clearly highlighted. Microsoft Sentinel permissions The environment must already be onboarded to Microsoft Sentinel, and the user testing or configuring the feature must have the appropriate Microsoft Sentinel permissions. The documented role requirement includes Microsoft Sentinel Contributor. However, in my experience, this is not always enough for the full onboarding and validation experience. Subscription-level Owner permission One important prerequisite that should be clearly mentioned is that Owner permissions at the Azure subscription level may be required. This is especially important during onboarding and activation, because the graph depends on access to Azure resource and permission relationships. If the user does not have sufficient subscription-level permissions, some setup steps or visibility into resources and relationships may not work as expected. Recommended permission note: In addition to Microsoft Sentinel permissions, ensure that the user configuring the preview has Owner permissions at the subscription level for the subscriptions that should be represented in the graph. This should be made very clear in the onboarding documentation to avoid confusion during deployment. Required data connector: Azure Resource Graph Another very important setup step is the Azure Resource Graph data connector. The Azure Resource Graph connector must be: Installed manually Activated manually Connected to the relevant Sentinel workspace This is a key point. The connector is not automatically enabled just because the Identity Attack Graph feature is available. Without this connector, Sentinel may not have the required Azure resource relationship data needed to build a useful graph. Why Azure Resource Graph is important Azure Resource Graph provides visibility across Azure resources, subscriptions, and relationships. For an identity attack graph, this data is essential. The graph needs to understand not only identities, but also the resources those identities can reach. This may include: Subscriptions Resource groups Storage accounts Key Vaults Virtual machines Managed identities Role assignments Resource relationships Resource hierarchy Critical assets Without Azure Resource Graph data, the attack graph may not provide the full picture of how identities connect to Azure resources. For this reason, I believe the onboarding instructions should explicitly state: The Azure Resource Graph data connector must be manually installed and activated before using the Identity Attack Graph. Recommended onboarding checklist Before using the Identity Attack Graph, I would recommend validating the following: Requirement Recommendation Microsoft Sentinel workspace Ensure the workspace is active and accessible Sentinel role Microsoft Sentinel Contributor or equivalent access Subscription permissions Owner permissions at subscription level Azure Resource Graph connector Manually install and activate the connector Azure RBAC visibility Ensure access to relevant role assignments Microsoft Entra ID visibility Ensure identity and group data is available Resource visibility Validate that relevant subscriptions and resources are visible Data freshness Allow enough time for data collection and graph population This checklist can help avoid issues where the feature appears available but does not show the expected relationships. How the Identity Attack Graph improves investigation Before using a graph-based approach, an analyst often needs to manually collect and correlate data from multiple sources. A typical investigation may include: Checking the user in Microsoft Entra ID Reviewing group memberships Reviewing Azure RBAC assignments Checking subscription-level access Looking at resource-level permissions Reviewing PIM activations Searching Sentinel logs Running KQL queries Checking Azure Activity logs Validating access with cloud or IAM teams This process can be time-consuming. The Identity Attack Graph helps reduce this effort by showing relationships visually. This allows the analyst to understand the possible path faster and decide where to focus. For example, instead of manually asking: “Does this user have access to this resource through any group, role, or inherited permission?” The graph can help show the relationship directly. This is valuable because many risky permissions are indirect. The user may not have direct access, but may inherit access through a group, role assignment, nested relationship, or service principal path. Where validation is still needed Although the graph provides strong visibility, I would still validate findings before taking remediation action. This is especially important because removing access can affect business operations or production systems. I would still validate with: Microsoft Sentinel KQL queries Microsoft Entra sign-in logs Microsoft Entra audit logs Azure Activity logs Azure RBAC role assignments PIM activation history Defender XDR signals Defender for Cloud recommendations Azure Resource Graph queries IAM team input Cloud platform team input Application owner confirmation The graph is very useful for discovery and prioritization, but final remediation decisions should still be validated. GQL and graph-based investigation One of the interesting aspects of this feature is the use of graph-based thinking. Security teams are already familiar with query languages such as KQL for log analytics. However, graph investigation is different. KQL is excellent for searching and analyzing events over time, such as sign-ins, alerts, audit logs, and activity logs. Graph Query Language, or GQL, is designed for querying connected data. Instead of only asking what happened at a specific time, graph queries help answer how entities are connected. In identity security, this is very powerful because the risk often exists in the relationship between objects. Graph entities include: Users Groups Service principals Managed identities Roles Subscriptions Resource groups Azure resources Permissions Sessions Attack paths Graph relationships include: User is member of group Group has role assignment Identity has access to resource Service principal owns application Managed identity can access Key Vault User can escalate privilege Identity can reach critical asset This allows analysts to ask more relationship-focused questions, such as: Which identities can reach this resource? What is the shortest path from this user to a critical asset? Which groups create privileged access? Which service principals have paths to sensitive resources? Which identities have indirect access through nested relationships? Which attack paths include subscription Owner or Contributor permissions? KQL vs GQL: why both are useful KQL and GQL serve different but complementary purposes. Area KQL GQL / Graph Querying Main purpose Analyze logs and events Analyze relationships and paths Best for Time-based investigation Connected identity/resource investigation question “Did this user sign in from a risky location?” “What resources can this user reach?” Data model Tables Nodes and edges Common use Detection, hunting, analytics Attack path discovery, relationship mapping Strength Event correlation Path discovery In practice, security teams need both. KQL can identify a suspicious sign-in. The Identity Attack Graph can show what the compromised identity could access. KQL can then be used again to validate whether the attacker interacted with those resources. This creates a strong workflow between event-based detection and relationship-based investigation. Graph investigation scenarios The following are conceptual are the types of graph questions that would be useful in identity attack path analysis. Find paths from a user to critical resources A useful graph query would help answer: Show me all paths from this user to critical Azure resources. This could help determine whether a compromised identity has a direct or indirect route to sensitive assets. Find identities with paths to Key Vaults Key Vaults often contain secrets, certificates, and keys. A graph query could help identify: Which users, groups, service principals, or managed identities have a path to Key Vault resources? This would be useful for prioritizing access review and remediation. Find subscription-level privileged identities Subscription-level roles are high-impact because they can provide broad access. A graph query could help find: Which identities have Owner or Contributor access at subscription level? This is especially important because subscription-level permissions can create wide attack paths. Find indirect access through groups Many access paths are created through group membership. A graph query could help answer: Which users have access to this resource through group membership? This can help IAM teams clean up excessive or unnecessary group-based access. Find service principals with broad access Service principals are often used for automation and applications, but they can become high-risk if over-privileged. A useful query would identify: Which service principals have broad access to subscriptions or critical resources? This is important because service principal compromise can lead to significant impact. How GQL can improve analyst workflows Adding strong GQL support to the graph explorer would make the feature more powerful for advanced users. You could use graph queries to: Search for specific paths Filter by identity type Filter by role Filter by resource type Find shortest paths Find high-risk paths Exclude known approved paths Focus on critical assets Query only privileged relationships Identify unexpected permission chains This would help both SOC analysts and cloud security engineers move from visual exploration to repeatable analysis. A SOC analyst may want a quick visual graph during an incident, while a cloud security engineer139Views0likes0CommentsSentinel Foundry - MCP Server (Preview) (Github Community Release)
I’ve been cooking something that a lot of people in SOC have been struggling with — especially on the engineering side of Microsoft Sentinel. Thanks to the Microsoft Security team for shaping the capabilities of Sentinel even better with Sentinel Data Lake & Modern SecOps. Today’s the day I can finally share it. Note: This is not an official Microsoft product, but it is designed to make the Sentinel Build even better (complement) with much more intelligence. 🚀 Sentinel Foundry is now in public preview with 43 tools. (Sentinel Foundry - MCP Server) It’s an MCP server built to act like the brain of a strong Sentinel engineer — helping make building, improving, and operating Sentinel far more practical, faster, and honestly more enjoyable. For a lot of teams, the challenge is not understanding what Sentinel can do. The hard part is the engineering work around it: -> Deciding what data should actually be ingested -> Building a clean, scalable Sentinel foundation -> Writing useful detections instead of noisy ones -> Balancing security value with cost -> Turning ideas into deployable engineering outputs That is exactly why I built Sentinel Foundry to help communities grow stronger. It helps with the real engineering tasks behind Sentinel — from architecture thinking to detection design, deployment planning, ingestion strategy, automation ideas, and many of the workflows outlined in the GitHub project. How does it work? Here’s one of the flagship prompts I ran with it: “Give me a complete security posture report for our workspace. Score each pillar and tell me what to prioritise.” And within seconds, it produced a structured engineering blueprint that would normally take a lot longer to pull together manually. You can see the example prompts here in what it can do: https://github.com/prabhukiranveesam/Sentinel-Foundry#what-can-it-do I want building Sentinel to feel less like repetitive engineering overhead — and more like real security engineering that is fast, creative, and enjoyable. If you work with Sentinel as a SOC L2 analyst, engineer, detection engineer, consultant, or architect, I’d genuinely love for you to try it and tell me what you think. 🔗 Public Preview: https://github.com/prabhukiranveesam/Sentinel-Foundry This is just the start of an AI era — and I’m excited to keep shaping it with more powerful features over the coming days. This is very easy to set up and will be available to all of you at no cost during this month as part of the public preview, and your feedback is extremely valuable to shape this as a powerful solution.325Views0likes0CommentsMicrosoft Defender: New Advanced hunting enhancements
Co-author: Jeremy Tan As a security analyst who actively hunts for critical threats, one of the most frustrating things that can happen is hitting a limit mid-query or encounter an experience that doesn’t behave as expected. The resulting friction and time spent troubleshooting or navigating takes valuable focus away from the investigation itself. To address this, we’ve made several enhancements across the experience to ensure investigations can scale seamlessly so analysts can stay focused on finding and stopping threats without interruption. These updates are based on your feedback and our commitment to continually improve the experience for analysts and customers alike. Scaling Investigations with Expanded Limits We’ve made several enhancements across the experience to expand limits and better support large-scale investigations so analysts can query, explore, and act on more data with fewer constraints. Results limitation increase (Preview) We have heard your feedback on the need for larger data sets and are excited to announce that the results limitation in advanced hunting has been raised from 30,000 to 100,000 records. Now, queries returning up to 100,000 results will display all available data. If a query exceeds this threshold, results are truncated as before, but the increase allows for more comprehensive analysis and improved incident response. Records limitation picker (Preview) One common challenge in advanced hunting has been the risk of running queries that return overwhelming result sets, consuming excessive resources and potentially hitting system limits. The new records limitation picker addresses this by allowing you to explicitly set how many rows a query should return, directly from the editor toolbar. Choose from predefined limits: 1,000, 5,000, or 10,000, 30,000 and 100,000 rows. Select the maximum system limit (currently 100,000 records). Define a custom value as needed. The selected limit applies alongside any KQL-defined row limitations, with the lower value always taking precedence. Your choice persists across page refreshes, navigation, and browser restarts. By default, tenants start at the maximum row limit, but you can tailor your selection via page preferences. This enhancement greatly improves performance and prevents unexpected limitations, making hunting safer and more efficient. Partial results on size limit (GA) Previously, queries that exceeded the 64 mb results size limit would fail outright, forcing analysts to modify their queries and rerun them. With the latest update, partial results are now provided when the size limit is reached: Queries return the maximum records that fit within the 64 MB cap. A clear message bar indicates when results are partial due to size constraints. This allows you to act on available data immediately, without repeating query adjustments. This improvement speeds up investigations and provides valuable data even in scenarios where limits are reached. Enhanced UI for Faster, More Intuitive Investigations We’ve made significant enhancements to the user experience delivering a more streamlined interface that helps analysts move through incidents with greater clarity, act with confidence, and spend less time searching and more time responding. Hear from one of our customers: “The recent updates to the Defender Advanced Hunting experience have gone a long way toward decluttering the interface and lowering the barrier for analysts and engineers who were previously more comfortable working exclusively in Microsoft Sentinel in the Azure portal. By simplifying navigation, reducing unnecessary visual noise, and adding pinnable tabs, the XDR portal now feels more familiar. This usability improvement has helped shift long-standing Sentinel users toward the XDR experience without forcing a change in how teams think about their data or workflows.” -Matt McCullogh, Senior SIEM Engineer, Best Buy Query details side pane: enhanced visibility and troubleshooting (GA) Understanding query execution and troubleshooting errors has often required tedious trial and error. The new query execution details side pane surfaces rich, actionable metadata for every query—successful or failed. With this feature, you can: View execution time breakdowns, data sources, scopes, and resource utilization. Examine response characteristics and detailed error information. Navigate tabs such as overview, raw statistics, and errors for comprehensive diagnostics. Access the side pane easily after running a query, or even from error messages in failure scenarios. This transparency makes it far easier to investigate issues and optimize your hunting experience. Improved error-handling for Advanced hunting queries (GA) Advanced hunting now provides improved output messages, including clearer error messages that explain query failures and actionable suggestions for common issues. This update simplifies troubleshooting and helps reduce downtime with complex queries. Simpler Navigation, More Powerful Hunting Alongside these updates, the Advanced hunting UI has received several enhancements focused on usability and streamlined workflows. Users can now easily filter results with a single click, making data exploration more efficient and responsive and enhanced configuration of the schema tree now allows for collapsing or expanding all nodes with ease. Additionally, the page layout has been thoughtfully restructured, organizing components in a more intuitive manner for a modern, cohesive experience that makes advanced hunting both powerful and easy to use. Rename tabs (GA) Another notable usability enhancement is the ability for users to rename their working tabs within advanced hunting. This feature enables users to organize their work sessions more efficiently, allowing for clear identification of ongoing investigations and queries without requiring them to save their work as long-term functions or queries. By simply renaming tabs, users can quickly switch between tasks and keep their workspace well-structured, further improving workflow and productivity. Saving KQL functions to log analytics workspace (GA) In addition to the above enhancements, we are delighted to introduce the ability to save KQL functions directly from the advanced hunting page into your log analytics workspace. To utilize this feature: Pick a folder under shared functions → Sentinel workspace functions. Functions saved in this folder are available for use in workbooks, analytics rules, and for execution in advanced hunting. Note: functions saved here are not available in custom detection rules. This new capability empowers you to build reusable logic and streamline your security workflows across Microsoft Sentinel and advanced hunting. Conclusion These enhancements represent our continued commitment to supporting your security investigations with robust, flexible, and efficient tools. We look forward to your feedback and to bringing even more improvements in the future. Learn more about the new advanced hunting enhancements in our documentation.3.8KViews2likes0CommentsUnderstand New Sentinel Pricing Model with Sentinel Data Lake Tier
Introduction on Sentinel and its New Pricing Model Microsoft Sentinel is a cloud-native Security Information and Event Management (SIEM) and Security Orchestration, Automation, and Response (SOAR) platform that collects, analyzes, and correlates security data from across your environment to detect threats and automate response. Traditionally, Sentinel stored all ingested data in the Analytics tier (Log Analytics workspace), which is powerful but expensive for high-volume logs. To reduce cost and enable customers to retain all security data without compromise, Microsoft introduced a new dual-tier pricing model consisting of the Analytics tier and the Data Lake tier. The Analytics tier continues to support fast, real-time querying and analytics for core security scenarios, while the new Data Lake tier provides very low-cost storage for long-term retention and high-volume datasets. Customers can now choose where each data type lands—analytics for high-value detections and investigations, and data lake for large or archival types—allowing organizations to significantly lower cost while still retaining all their security data for analytics, compliance, and hunting. Please flow diagram depicts new sentinel pricing model: Now let's understand this new pricing model with below scenarios: Scenario 1A (PAY GO) Scenario 1B (Usage Commitment) Scenario 2 (Data Lake Tier Only) Scenario 1A (PAY GO) Requirement Suppose you need to ingest 10 GB of data per day, and you must retain that data for 2 years. However, you will only frequently use, query, and analyze the data for the first 6 months. Solution To optimize cost, you can ingest the data into the Analytics tier and retain it there for the first 6 months, where active querying and investigation happen. After that period, the remaining 18 months of retention can be shifted to the Data Lake tier, which provides low-cost storage for compliance and auditing needs. But you will be charged separately for data lake tier querying and analytics which depicted as Compute (D) in pricing flow diagram. Pricing Flow / Notes The first 10 GB/day ingested into the Analytics tier is free for 31 days under the Analytics logs plan. All data ingested into the Analytics tier is automatically mirrored to the Data Lake tier at no additional ingestion or retention cost. For the first 6 months, you pay only for Analytics tier ingestion and retention, excluding any free capacity. For the next 18 months, you pay only for Data Lake tier retention, which is significantly cheaper. Azure Pricing Calculator Equivalent Assuming no data is queried or analyzed during the 18-month Data Lake tier retention period: Although the Analytics tier retention is set to 6 months, the first 3 months of retention fall under the free retention limit, so retention charges apply only for the remaining 3 months of the analytics retention window. Azure pricing calculator will adjust accordingly. Scenario 1B (Usage Commitment) Now, suppose you are ingesting 100 GB per day. If you follow the same pay-as-you-go pricing model described above, your estimated cost would be approximately $15,204 per month. However, you can reduce this cost by choosing a Commitment Tier, where Analytics tier ingestion is billed at a discounted rate. Note that the discount applies only to Analytics tier ingestion—it does not apply to Analytics tier retention costs or to any Data Lake tier–related charges. Please refer to the pricing flow and the equivalent pricing calculator results shown below. Monthly cost savings: $15,204 – $11,184 = $4,020 per month Now the question is: What happens if your usage reaches 150 GB per day? Will the additional 50 GB be billed at the Pay-As-You-Go rate? No. The entire 150 GB/day will still be billed at the discounted rate associated with the 100 GB/day commitment tier bucket. Azure Pricing Calculator Equivalent (100 GB/ Day) Azure Pricing Calculator Equivalent (150 GB/ Day) Scenario 2 (Data Lake Tier Only) Requirement Suppose you need to store certain audit or compliance logs amounting to 10 GB per day. These logs are not used for querying, analytics, or investigations on a regular basis, but must be retained for 2 years as per your organization’s compliance or forensic policies. Solution Since these logs are not actively analyzed, you should avoid ingesting them into the Analytics tier, which is more expensive and optimized for active querying. Instead, send them directly to the Data Lake tier, where they can be retained cost-effectively for future audit, compliance, or forensic needs. Pricing Flow Because the data is ingested directly into the Data Lake tier, you pay both ingestion and retention costs there for the entire 2-year period. If, at any point in the future, you need to perform advanced analytics, querying, or search, you will incur additional compute charges, based on actual usage. Even with occasional compute charges, the cost remains significantly lower than storing the same data in the Analytics tier. Realized Savings Scenario Cost per Month Scenario 1: 10 GB/day in Analytics tier $1,520.40 Scenario 2: 10 GB/day directly into Data Lake tier $202.20 (without compute) $257.20 (with sample compute price) Savings with no compute activity: $1,520.40 – $202.20 = $1,318.20 per month Savings with some compute activity (sample value): $1,520.40 – $257.20 = $1,263.20 per month Azure calculator equivalent without compute Azure calculator equivalent with Sample Compute Conclusion The combination of the Analytics tier and the Data Lake tier in Microsoft Sentinel enables organizations to optimize cost based on how their security data is used. High-value logs that require frequent querying, real-time analytics, and investigation can be stored in the Analytics tier, which provides powerful search performance and built-in detection capabilities. At the same time, large-volume or infrequently accessed logs—such as audit, compliance, or long-term retention data—can be directed to the Data Lake tier, which offers dramatically lower storage and ingestion costs. Because all Analytics tier data is automatically mirrored to the Data Lake tier at no extra cost, customers can use the Analytics tier only for the period they actively query data, and rely on the Data Lake tier for the remaining retention. This tiered model allows different scenarios—active investigation, archival storage, compliance retention, or large-scale telemetry ingestion—to be handled at the most cost-effective layer, ultimately delivering substantial savings without sacrificing visibility, retention, or future analytical capabilities.Solved2.6KViews2likes6CommentsMicrosoft Sentinel MCP Entity Analyzer: Explainable risk analysis for URLs and identities
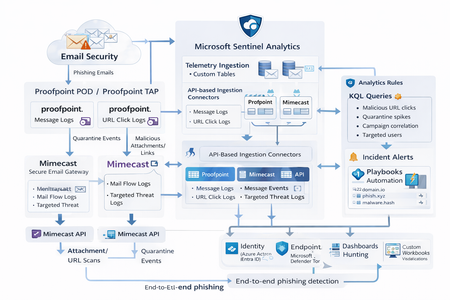
What makes this release important is not just that it adds another AI feature to Sentinel. It changes the implementation model for enrichment and triage. Instead of building and maintaining a chain of custom playbooks, KQL lookups, threat intel checks, and entity correlation logic, SOC teams can call a single analyzer that returns a reasoned verdict and supporting evidence. Microsoft positions the analyzer as available through Sentinel MCP server connections for agent platforms and through Logic Apps for SOAR workflows, which makes it useful both for interactive investigations and for automated response pipelines. Why this matters First, it formalizes Entity Analyzer as a production feature rather than a preview experiment. Second, it introduces a real cost model, which means organizations now need to govern usage instead of treating it as a free enrichment helper. Third, Microsoft’s documentation is now detailed enough to support repeatable implementation patterns, including prerequisites, limits, required tables, Logic Apps deployment, and cost behavior. From a SOC engineering perspective, Entity Analyzer is interesting because it focuses on explainability. Microsoft describes the feature as generating clear, explainable verdicts for URLs and user identities by analyzing multiple modalities, including threat intelligence, prevalence, and organizational context. That is a much stronger operational model than simple point-enrichment because it aims to return an assessment that analysts can act on, not just more raw evidence What Entity Analyzer actually does The Entity Analyzer tools are described as AI-powered tools that analyze data in the Microsoft Sentinel data lake and provide a verdict plus detailed insights on URLs, domains, and user entities. Microsoft explicitly says these tools help eliminate the need for manual data collection and complex integrations usually required for investigation and enrichment hat positioning is important. In practice, many SOC teams have built enrichment playbooks that fetch sign-in history, query TI feeds, inspect click data, read watchlists, and collect relevant alerts. Those workflows work, but they create maintenance overhead and produce inconsistent analyst experiences. Entity Analyzer centralizes that reasoning layer. For user entities, Microsoft’s preview architecture explains that the analyzer retrieves sign-in logs, security alerts, behavior analytics, cloud app events, identity information, and Microsoft Threat Intelligence, then correlates those signals and applies AI-based reasoning to produce a verdict. Microsoft lists verdict examples such as Compromised, Suspicious activity found, and No evidence of compromise, and also warns that AI-generated content may be incorrect and should be checked for accuracy. That warning matters. The right way to think about Entity Analyzer is not “automatic truth,” but “high-value, explainable triage acceleration.” It should reduce analyst effort and improve consistency, while still fitting into human review and response policy. Under the hood: the implementation model Technically, Entity Analyzer is delivered through the Microsoft Sentinel MCP data exploration tool collection. Microsoft documents that entity analysis is asynchronous: you start analysis, receive an identifier, and then poll for results. The docs note that analysis may take a few minutes and that the retrieval step may need to be run more than once if the internal timeout is not enough for long operations. That design has two immediate implications for implementers. First, this is not a lightweight synchronous enrichment call you should drop carelessly into every automation branch. Second, any production workflow should include retry logic, timeouts, and concurrency controls. If you ignore that, you will create fragile playbooks and unnecessary SCU burn. The supported access path for the data exploration collection requires Microsoft Sentinel data lake and one of the supported MCP-capable platforms. Microsoft also states that access to the tools is supported for identities with at least Security Administrator, Security Operator, or Security Reader. The data exploration collection is hosted at the Sentinel MCP endpoint, and the same documentation notes additional Entity Analyzer roles related to Security Copilot usage. The prerequisite many teams will miss The most important prerequisite is easy to overlook: Microsoft Sentinel data lake is required. This is more than a licensing footnote. It directly affects data quality, analyzer usefulness, and rollout success. If your organization has not onboarded the right tables into the data lake, Entity Analyzer will either fail or return reduced-confidence output. For user analysis, the following tables are required to ensure accuracy: AlertEvidence, SigninLogs, CloudAppEvents, and IdentityInfo. also notes that IdentityInfo depends on Defender for Identity, Defender for Cloud Apps, or Defender for Endpoint P2 licensing. The analyzer works best with AADNonInteractiveUserSignInLogs and BehaviorAnalytics as well. For URL analysis, the analyzer works best with EmailUrlInfo, UrlClickEvents, ThreatIntelIndicators, Watchlist, and DeviceNetworkEvents. If those tables are missing, the analyzer returns a disclaimer identifying the missing sources A practical architecture view An incident, hunting workflow, or analyst identifies a high-interest URL or user. A Sentinel MCP client or Logic App calls Entity Analyzer. Entity Analyzer queries relevant Sentinel data lake sources and correlates the findings. AI reasoning produces a verdict, evidence narrative, and recommendations. The result is returned to the analyst, incident record, or automation workflow for next-step action. This model is especially valuable because it collapses a multi-query, multi-tool investigation pattern into a single explainable decisioning step. Where it fits in real Sentinel operations Entity Analyzer is not a replacement for analytics rules, UEBA, or threat intelligence. It is a force multiplier for them. For identity triage, it fits naturally after incidents triggered by sign-in anomaly detections, UEBA signals, or Defender alerts because it already consumes sign-in logs, cloud app events, and behavior analytics as core evidence sources. For URL triage, it complements phishing and click-investigation workflows because it uses TI, URL activity, watchlists, and device/network context. Implementation path 1: MCP clients and security agents Microsoft states that Entity Analyzer integrates with agents through Sentinel MCP server connections to first-party and third-party AI runtime platforms. In practice, this makes it attractive for analyst copilots, engineering-side investigation agents, and guided triage experiences The benefit of this model is speed. A security engineer or analyst can invoke the analyzer directly from an MCP-capable client without building a custom orchestration layer. The tradeoff is governance: once you make the tool widely accessible, you need a clear policy for who can run it, when it should be used, and how results are validated before action is taken. Implementation path 2: Logic Apps and SOAR playbooks For SOC teams, Logic Apps is likely the most immediately useful deployment model. Microsoft documents an entity analyzer action inside the Microsoft Sentinel MCP tools connector and provides the required parameters for adding it to an existing logic app. These include: Workspace ID Look Back Days Properties payload for either URL or User The documented payloads are straightforward: { "entityType": "Url", "url": "[URL]" } And { "entityType": "User", "userId": "[Microsoft Entra object ID or User Principal Name]" } Also states that the connector supports Microsoft Entra ID, service principals, and managed identities, and that the Logic App identity requires Security Reader to operate. This makes playbook integration a strong pattern for incident enrichment. A high-severity incident can trigger a playbook, extract entities, invoke Entity Analyzer, and post the verdict back to the incident as a comment or decision artifact. The concurrency lesson most people will learn the hard way Unusually direct guidance on concurrency: to avoid timeouts and threshold issues, turn on Concurrency control in Logic Apps loops and start with a degree of parallelism of . The data exploration doc repeats the same guidance, stating that running multiple instances at once can increase latency and recommending starting with a maximum of five concurrent analyses. This is a strong indicator that the correct implementation pattern is selective analysis, not blanket analysis. Do not analyze every entity in every incident. Analyze the entities that matter most: external URLs in phishing or delivery chains accounts tied to high-confidence alerts entities associated with high-severity or high-impact incidents suspicious users with multiple correlated signals That keeps latency, quota pressure, and SCU consumption under control. KQL still matters Entity Analyzer does not eliminate KQL. It changes where KQL adds value. Before running the analyzer, KQL is still useful for scoping and selecting the right entities. After the analyzer returns, KQL is useful for validation, deeper hunting, and building custom evidence views around the analyzer’s verdict. For example, a simple sign-in baseline for a target user: let TargetUpn = "email address removed for privacy reasons"; SigninLogs | where TimeGenerated between (ago(7d) .. now()) | where UserPrincipalName == TargetUpn | summarize Total=count(), Failures=countif(ResultType != "0"), Successes=countif(ResultType == "0"), DistinctIPs=dcount(IPAddress), Apps=make_set(AppDisplayName, 20) by bin(TimeGenerated, 1d) | order by TimeGenerated desc And a lightweight URL prevalence check: let TargetUrl = "omicron-obl.com"; UrlClickEvents | where TimeGenerated between (ago(7d) .. now()) | search TargetUrl | take 50 Cost, billing, and governance GA is where technical excitement meets budget reality. Microsoft’s Sentinel billing documentation says there is no extra cost for the MCP server interface itself. However, for Entity Analyzer, customers are charged for the SCUs used for AI reasoning and also for the KQL queries executed against the Microsoft Sentinel data lake. Microsoft further states that existing Security Copilot entitlements apply The April 2026 “What’s new” entry also explicitly says that starting April 1, 2026, customers are charged for the SCUs required when using Entity Analyzer. That means every rollout should include a governance plan: define who can invoke the analyzer decide when playbooks are allowed to call it monitor SCU consumption limit unnecessary repeat runs preserve results in incident records so you do not rerun the same analysis within a short period Microsoft’s MCP billing documentation also defines service limits: 200 total runs per hour, 500 total runs per day, and around 15 concurrent runs every five minutes, with analysis results available for one hour. Those are not just product limits. They are design requirements. Limitations you should state clearly The analyze_user_entity supports a maximum time window of seven days and only works for users with a Microsoft Entra object ID. On-premises Active Directory-only users are not supported for user analysis. Microsoft also says Entity Analyzer results expire after one hour and that the tool collection currently supports English prompts only. Recommended rollout pattern If I were implementing this in a production SOC, I would phase it like this: Start with a narrow set of high-value use cases, such as suspicious user identities and phishing-related URLs. Confirm that the required tables are present in the data lake. Deploy a Logic App enrichment pattern for incident-triggered analysis. Add concurrency control and retry logic. Persist returned verdicts into incident comments or case notes. Then review SCU usage and analyst value before expanding coverage.880Views8likes0CommentsXDR Advanced hunting API region availability
Hi, I am exploring XDR advanced hunting API to fetch data specific to Microsoft Defender for Endpoint tenants. The official documentation (https://learn.microsoft.com/en-us/defender-xdr/api-advanced-hunting) mentions to switch to Microsoft Graph advanced hunting API. I had below questions related to it: To fetch the region specific(US , China, Global) token and Microsoft Graph service root endpoints(https://learn.microsoft.com/en-us/graph/deployments#app-registration-and-token-service-root-endpoints ) , is the recommended way to fetch the OpenID configuration document (https://learn.microsoft.com/en-us/entra/identity-platform/v2-protocols-oidc#find-your-apps-openid-configuration-document-uri) for a tenant ID and based on the response, the region specific SERVICE/TOKEN endpoints could be fetched? Using it, there is no need to maintain different end points for tenants in different regions. And do we use the global service URL https://login.microsoftonline.com to fetch OpenID config document for a tenantID in any region? As per the documentation, Microsoft Graph Advanced hunting API is not supported in China region (https://learn.microsoft.com/en-us/graph/api/security-security-runhuntingquery?view=graph-rest-1.0&tabs=http). In this case, is it recommended to use Microsoft XDR Advanced hunting APIs(https://learn.microsoft.com/en-us/defender-xdr/api-advanced-hunting) to support all region tenants(China, US, Global)?Solved110Views0likes1CommentMissing details in Azure Activity Logs – MICROSOFT.SECURITYINSIGHTS/ENTITIES/ACTION
The Azure Activity Logs are crucial for tracking access and actions within Sentinel. However, I’m encountering a significant lack of documentation and clarity regarding some specific operation types. Resources consulted: https://learn.microsoft.com/en-us/azure/sentinel/audit-sentinel-data https://learn.microsoft.com/en-us/rest/api/securityinsights/entities?view=rest-securityinsights-2024-01-01-preview https://learn.microsoft.com/en-us/rest/api/securityinsights/operations/list?view=rest-securityinsights-2024-09-01&tabs=HTTP My issue: I observed unauthorized activity on our Sentinel workspace. The Azure Activity Logs clearly indicate the user involved, the resource, and the operation type: "MICROSOFT.SECURITYINSIGHTS/ENTITIES/ACTION" But that’s it. No detail about what the action was, what entity it targeted, or how it was triggered. This makes auditing extremely difficult. It's clear the person was in Sentinel and perform an activity through it, from search, KQL, logs to find an entity from a KQL query. But, that's all... Strangely, this operation is not even listed in the official Sentinel Operations documentation linked above. My question: Has anyone encountered this and found a way to interpret this operation type properly? Any insight into how to retrieve more meaningful details (action context, target entity, etc.) from these events would be greatly appreciated.271Views0likes3Comments