sustainability
16 Topics
AssuredTest(tm) - Incremental Testing in CI/CD Lower Stages
I have introduced a new pair of products, AssuredTest(tm) and AssuredTest-C(tm). They are both ML driven but by functor models, not stochastic. This is an https://github.com/AutonomicAI/functor-resnet on GitHub for anyone interested. There are some various features with these products that my patent attorney advised me to only disclose under NDA. Knowing the features would be very easy to develop indepently for any competitor in incremental testing. The AssuredTest-C is a highly optimized companion to AssuredCode-C which generates bare metal MISRA C code in a benchmarked mean of 0.36 ms and I have created "https://www.functormodel.ai/assuredprocess" which uses blue-green digital twins, and I can support safe end-end generate to deploy in under 10 ms. This is not in competition with LLMs as AssuredCode-C is spec-based and has no NLP built in. AssuredTest will not run a test when there has been no code, dependency, configuration, or environment change that could affect its result, much like an incremental compiler. It maintains an internal registry of test results and their relevant dependencies. When nothing affecting a test has changed, AssuredTest returns the most recent valid result rather than unnecessarily executing the test again. This can significantly reduce the compute and energy consumed by large regression test suites. Some other features guarantee 100% code line coverage. Your team can avoid writing so many unit tests and focus on real business cases. A Cucumber/Gherkhin interface is used for "look ahead" style testing which may need to happen if the code is being generated. Through the years working with CI/CD I did always feel it was a design smell to have the same test executed so many times when the outcome was unquestionably known. I will say upfront as well, I am environmentally minded so I like to "invent green". I asked GPT how much energy would be saved if every IT shop in America used this instead of rerunning unit test harnesses in their dev & test environments? It estimated a potential 5 TWh. Of course that's a guesstimate in many ways, depending on many factors and of course advanced test environments like UAT and production are not included. I would obviously not advise anything other than running a certified test harness for production systems.
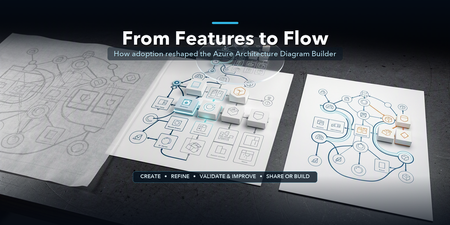
From Features to Flow: How Real-World Adoption Reshaped the Azure Architecture Diagram Builder
In May, I introduced the open-source Azure Architecture Diagram Builder as a way to move from a natural-language prompt to an Azure architecture diagram, cost estimate, Well-Architected assessment, and deployment guidance. In July, I shared how the project had become agent-ready through Model Context Protocol (MCP). Those posts described what the tool could do. The more interesting story came next: what happened when people actually used it. As adoption grew, the central product question changed. It was no longer simply, Can AI generate an Azure architecture? It became: How do we help an architect choose how to begin, improve a result without losing their work, validate it responsibly, and turn it into something another person can use? That question reshaped the Azure Architecture Diagram Builder from a collection of capabilities into a guided workflow: Create → Refine → Validate & Improve → Share or Build This post explains what we learned, what changed in the product, and why the hardest part of AI-assisted architecture is not the first diagram. It is everything that comes after it. TL;DR. Growing adoption created a feedback loop. Aggregate usage showed that people moved beyond generation into validation, recommendations, exports, and deployment guidance. Privacy-safe feedback revealed recurring problems with diagram integrity, preservation of human edits, cost credibility, export quality, and validation continuity. Those signals led to a four-stage architecture journey that keeps human judgment and professional review at the center. The same lesson now shapes agent access and the next product boundary: distinguish logical proposals from evidence-backed physical architecture. Adoption created a product feedback loop As of August 5, 2026, the first two Azure Architecture Blog articles had accumulated approximately 12,100 combined views. A refreshed view of deduplicated application telemetry through August 13 recorded: Activity Aggregate count Architecture generation and refinement events 5,023 Well-Architected validations 960 Recommendations applied 175 Diagram exports 2,020 Deployment guides generated 212 As of August 13, the public repository had reached 45 stars and 14 forks. In GitHub’s current rolling 14-day window, the repository recorded 277 unique visitors and 67 unique cloners. These numbers measure different things and should not be added together. Article views are not unique readers. Application activity uses anonymous telemetry identifiers, not verified people. GitHub traffic is a rolling aggregate window. The signals are useful because of the pattern they reveal, not because they can be combined into one headline user count. Activity also accelerated during the period following the second article. Compared with the May 19–July 9 baseline, daily activity from July 10 through August 13 was approximately 7.0 times higher for architecture generation and refinement, 5.6 times higher for Well-Architected validation, and 5.9 times higher for recommendation application. The timing coincided with publication; it does not prove that the article alone caused the growth. The important product lesson was simpler: people were not stopping after the first diagram. They were testing alternatives, validating designs, applying recommendations, exporting artifacts, and asking how to move toward implementation. Generation was the entry point, not the complete job. The first guided-journey signals reinforce the need for more than one starting path. Through August 13, the new journey instrumentation recorded 880 interactions from 174 anonymous identifiers across 241 sessions. At first start, structured brief/image generation and Guided Chat were selected at almost the same frequency (158 and 156 events), while template and live-Azure import added another 68 selections. These are interaction counts, not unique people or conversion rates, and the window is still too early to claim that the journey improves completion. They are enough to show that architecture work does not begin in one uniform way. In-product Start Here panel showing the four-stage Azure Architecture Diagram Builder journey: Create, Refine, Validate and Improve, and Share or Build. Figure 1. The in-product Start Here panel explains one complete architecture loop. The stages are recommendations, not gates, and direct access to every tool remains available. Stage 1: Create — make the starting choice explicit As capabilities accumulated, the first screen became harder to interpret. Architecture Chat and structured generation were both useful, but they competed for attention. Importing an existing architecture was available, yet easy to miss. The new starting experience makes three paths explicit: Starting path Best suited for Guided Chat Exploring requirements conversationally and refining them over multiple turns Generate Diagram Providing a structured brief or image and producing a first architecture quickly Import Existing Opening an existing architecture or infrastructure artifact for analysis and editing This is not a marketing landing page placed in front of the tool. It is a small decision point inside the authoring experience. Once a path is selected, the user lands on the real canvas. The distinction matters because different architecture tasks begin with different levels of certainty. Sometimes the architect knows the target services. Sometimes the problem needs discovery. Sometimes the architecture already exists and the work is to understand or improve it. The product should acknowledge those differences instead of pretending every design starts with a perfect prompt. Start chooser presenting Guided Chat, Generate Diagram, and Import Existing as three equal entry paths. Figure 2. Three starting paths reflect three different architecture situations: discovery, structured generation, and analysis of an existing design. Stage 2: Refine — preserve human work One of the clearest feedback themes was not about adding another AI capability. It was about preventing AI from casually undoing human effort. An architect might spend time arranging a one-page diagram for a review, resizing groups, moving labels, or emphasizing a specific boundary. A subsequent AI refinement could improve the service selection while disrupting that carefully prepared layout. The design principle that emerged was straightforward: AI acceleration should preserve deliberate human work by default. Refinement now retains existing node positions, group geometry, sizes, and viewport context whenever possible. The model can change the architecture without treating every turn as permission to redraw the entire document. The same principle applies beyond geometry: Preserve the prior validation result when recommendations change the architecture. Preserve the active light or dark theme in exported artifacts. Preserve the distinction between the authoring canvas and the presentation deliverable. Preserve user-configured pricing assumptions rather than replacing them with one fixed estimate. This is a broader lesson for AI-assisted tools. A generated result is not the only source of value. The edits, judgments, and communication choices a person adds afterward are part of the artifact too. Before-and-after AADB canvases showing an AI refinement that adds Azure Front Door and WAF while retaining the positions of eight existing services and the anchors of four existing groups. Figure 3. In this controlled synthetic refinement, all eight existing service positions and four group anchors remained unchanged. The containing Application group expanded to accommodate the new edge tier, so preservation does not imply that every group dimension stays fixed. Quality is structural, not only visual A diagram can look polished while still being architecturally confusing. Early feedback exposed cases where a generated service appeared disconnected because a model referenced a display name instead of the service identifier used by the canvas. The correction was not another prompt instruction alone. The application now resolves connection endpoints across identifiers, normalized service names, and service-type aliases. It repairs valid edges, drops invalid or self-referential edges, detects remaining orphan nodes, and records aggregate integrity signals. That creates a more useful definition of diagram quality: Are the services connected as intended? Were any generated edges repaired or dropped? Are there orphaned nodes? Did refinement preserve the existing layout? Did an architecture change receive a fresh validation? Visual polish still matters, especially when an artifact leaves the editor. But structural integrity gives the product something deterministic to test and monitor. Stage 3: Validate & Improve — treat validation as a lifecycle The Azure Well-Architected Framework is most useful when validation becomes iterative rather than ceremonial. The Diagram Builder can assess a proposed design across the five Well-Architected pillars, surface findings, and apply selected recommendations. But that workflow exposed an important state-management problem: when the architecture changed, the prior validation result disappeared along with the obvious route back to revalidation. The updated experience keeps the previous report, marks it Revalidate Needed, and makes clear that the score describes an earlier state of the architecture. A new validation replaces it only after the updated design has been assessed. This distinction prevents a stale score from looking current. It also clarifies what an architecture-level assessment can and cannot prove. A diagram may show that a WAF, cache, backup service, or secondary region exists. It usually cannot prove that purge protection, diagnostic routing, encryption settings, role assignments, health probes, or failover policies are configured correctly. That is why validation findings need to distinguish between: Pattern-level gaps — missing or misplaced architectural components Configuration-level gaps — required settings that must be verified in Infrastructure as Code or the deployed environment Generated scores and recommendations help architects review a design; they do not replace an Azure Well-Architected Review, security review, deployment validation, or professional judgment. Validation result retained after architecture recommendations are applied, with a Revalidate Needed status and action. Figure 4. Architecture changes make a previous validation historical, not useless. The result remains available while the interface clearly asks for a fresh validation. Stage 4: Share or Build — design for the artifact’s destination The editing canvas and the final deliverable serve different purposes. Canvas dots, handles, navigation controls, and selection states help during authoring. They can make an exported diagram feel unfinished. The Diagram Builder now separates those concerns with Plain, Dots, and Grid export backgrounds while preserving the active light or dark theme. The same AADB architecture shown first on the editing canvas with the export menu open and then as the resulting Plain PNG without authoring controls. Figure 5. Authoring and delivery are different contexts. The upper view shows the editable canvas and its real export controls; the lower view is the Plain PNG produced from that same canvas, without editing chrome. Cost language is deliberately qualified. Azure services often combine fixed, usage-based, and configuration-dependent charges. A baseline that includes six numerically priced services but excludes 20 usage-based items is not the total cost of the architecture. The output identifies those exclusions rather than treating missing values as zero. The final stage also includes deployment guides and Infrastructure as Code. Here, honesty about artifact coverage is essential. A generated Bicep file may be a useful starter while still omitting private endpoints, diagnostic settings, failover configuration, or service-specific resources. The artifact should state what it implements, what remains conceptual, and whether Azure Resource Manager validation passed. AI-generated diagrams, costs, validation results, deployment guides, and Infrastructure as Code should all be reviewed and validated before production use. The same journey now extends to agents The MCP server introduced in the previous article makes the Diagram Builder available to agent experiences such as Microsoft Scout. The four-stage journey provides a useful way to think about agent orchestration too: Import or create one canonical architecture. Refine it without silently changing the intended topology. Validate it, apply supported improvements, and revalidate. Render or generate artifacts with explicit coverage and limitations. The current MCP surface exposes 12 tools, three resources, and three reusable prompts. It can normalize an existing architecture, validate and harden it deterministically, estimate regional costs from a dated pricing snapshot, render presentation/technical/cost views, and generate Bicep, Terraform, and deployment guidance. The calling agent still owns orchestration and reasoning; the MCP server is intended to remain a deterministic architecture capability, not a second hidden agent. The native MCP renderer can project one canonical architecture into three communication profiles: Presentation emphasizes the primary request path, reduces supporting labels, and removes pricing. Technical preserves complete connection detail for engineering inspection. Cost retains the focused composition while adding service-level pricing assumptions, a fixed-priced baseline, and explicit exclusions. These are MCP-generated SVG views, not Blueprint diagrams or screenshots of the editable web canvas. The services, connections, and groups remain the same; only the information treatment changes. The AADB MCP renderer projecting the same canonical architecture into presentation, technical, and cost SVG profiles. Figure 6. Native AADB MCP output from one 8-service, 9-connection, 4-group architecture. Presentation prioritizes the story, Technical exposes connection detail, and Cost foregrounds pricing assumptions and exclusions. Recent work on the MCP renderer added purpose-built presentation, technical, and cost profiles. More importantly, testing agent-generated artifacts reinforced an accountability principle: a polished diagram and a compiled Bicep file do not prove deployability. An agent workflow should report whether topology changed, whether validation improved, which services are represented only conceptually, and whether the generated IaC passed Azure preflight. That is more useful than an unsupported claim that a design is production-ready. Trust also includes the tool boundary itself. The hosted MCP endpoints now require a bearer token for real session operations; missing or incorrect credentials are rejected. A shared token is appropriate for the current controlled integration, but it is not the end state for enterprise multi-user access. Entra ID/OAuth, per-client authorization, rotation, and revocation remain future hardening work. Microsoft Scout response after an authenticated Azure Architecture Diagram Builder MCP workflow, showing the tools used, initial and final validation scores, cost scope, Bicep classification, rendered architecture, artifact links, coverage gaps, and no-deployment warning. Figure 7. The guided lifecycle extends beyond the web application. In this synthetic Scout run with GPT-5.6 Sol, the agent used authenticated AADB MCP tools to validate, harden, cost, render, and generate starter artifacts while explicitly reporting coverage gaps and that nothing was deployed. Learning from adoption without identifying people Product learning does not require reconstructing individual identities. The findings behind this article use aggregate, deduplicated application telemetry, public article counters, public repository totals, and paraphrased feedback themes. They do not correlate Application Insights identifiers, feedback records, GitHub accounts, or email addresses. Written feedback remains submittable without contact information. When someone explicitly opts into follow-up, the email address is stored with the feedback record in Cosmos DB and is not sent to normal product telemetry. The current 180-day expiry field is a retention marker; automated deletion must be implemented and verified before describing that retention period as enforced. Those boundaries matter for both product design and public writing: Aggregate activity rather than profiling individuals. Paraphrase themes rather than publishing comments without permission. Keep optional contact consent separate from telemetry. Avoid presenting anonymous identifiers as confirmed people. Avoid claiming that publication timing proves acquisition causality. This is not a claim of legal compliance. It is a product discipline: collect less, preserve user agency, and make only the claims the evidence supports. What changed The guided journey is the visible result, but the deeper change is how the project now evaluates progress. Earlier question Better question Did the model generate a diagram? Did it generate a connected and understandable architecture? Did the user click Validate? Was the current architecture validated, and was it revalidated after changes? Did export start? Did a professional artifact finish generating successfully? Does the IaC compile? What does it actually implement, and does Azure preflight pass? How many features exist? Can an architect understand the next useful step? The model portfolio continued to evolve as well. The production selector now contains 15 configured entries, including MAI-Thinking-1 (Public Preview). But the more consequential changes in this article are deliberately model-independent: preserve human work, keep state and provenance explicit, qualify generated artifacts, and authenticate the tools agents can call. The goal is not to remove flexibility. Architects can still open any tool directly, rearrange the canvas, reject recommendations, change pricing assumptions, or export at any point. The goal is to make the workflow coherent without pretending architecture itself is linear. The next boundary: logical versus physical architecture Recent feedback points to a harder problem than adding another model or export format. Architects working with private Azure AI landing zones need to distinguish shared platform resources from project-owned resources, preserve VNet and subnet boundaries, and reason about CIDRs, NSGs, route tables, private endpoints, DNS, and managed identities. The current Topology mode can show services and relationships, but it should not imply exact physical fidelity when those facts are absent. A useful logical diagram answers what exists and how it interacts. A physical or low-level design must answer where it is deployed, how it is isolated, and which values came from evidence. That is the next technical direction I am exploring: an evidence-aware Physical Architecture view backed by deterministic reconstruction from Terraform plan/state, ARM, or a live Azure inventory. Exact fields would be labeled as observed or resolved; AI suggestions would remain explicitly proposed; unsupported or missing inputs would be reported instead of silently invented. This capability is not shipped today, and it will require its own schema, validation rules, layout, security review, and evaluation set. That distinction matters. The lesson from adoption is not to put every architecture concern into one crowded canvas. It is to make each artifact’s purpose and evidence boundary clear. Try it, challenge it, help shape what comes next The Azure Architecture Diagram Builder remains open source, and the live experience is available today: Live app: https://aka.ms/diagram-builder Source code: github.com/Arturo-Quiroga-MSFT/azure-architecture-diagram-builder Getting started: Documentation and deployment guidance The next phase is to measure whether the guided journey helps people complete the full loop, especially recommendation-to-revalidation and artifact-generation success. In parallel, I am beginning the narrower physical-architecture investigation described above. Both efforts will use aggregate signals, reviewed fixtures, and sufficiently large cohorts rather than individual journey reconstruction. Try the workflow with a real architecture problem. Tell me where the handoffs are unclear, where the diagram loses intent, or where an artifact claims more than it implements. Those are the gaps worth fixing next. Measurement note: Article views are rounded public counters observed August 5, 2026. Application figures use deduplicated retained telemetry through August 13 and anonymous identifiers. GitHub totals and rolling 14-day traffic were observed August 13. The comparison windows are May 19–July 9 and July 10–August 13. These signals have different populations and must not be added together. Timing comparisons show concurrent activity, not causal attribution.1.1KViews1like2Comments
Flexible Cooling for AI Growth: How Zonal Architecture Supports Diverse Hardware Needs
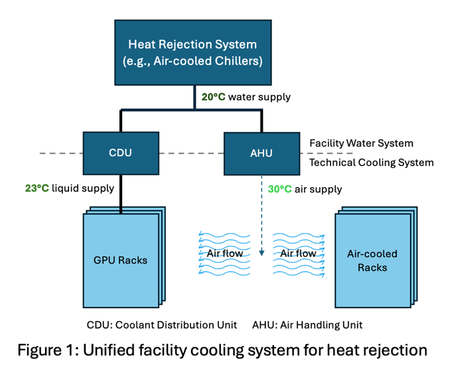
By: Ricardo Bianchini, Steve Solomon, Brijesh Warrier, Martin Herbert, Jay Jochim, Husam Alissa, Pulkit Misra, Eric Peterson and Cam Turner Context - Microsoft is pioneering zonal cooling in its next-generation AI datacenters, enabling flexible, performant, efficient, and sustainable thermal management for diverse workloads. The unprecedented growth of artificial intelligence (AI) is transforming datacenter infrastructure. Modern facilities must now support a diverse array of IT equipment, each with distinct cooling requirements. For example, modern GPUs and other AI accelerators require liquid cooling as air cooling is impractical at power draws exceeding 1 kW per accelerator due to the limited heat capacity of air to remove the resulting thermal load. Meanwhile, non-AI-accelerator (i.e., general-purpose) hardware deployments such as CPU-based compute, storage, and networking are expected to mostly remain air-cooled for the foreseeable future. Furthermore, liquid cooling offers a significant efficiency advantage: its superior heat dissipation allows coolant supply temperatures at the chip as high as 45°C without sacrificing peak performance. In contrast, air-cooled equipment requires much lower supply temperatures—around 30 °C—for optimal efficiency. The divergence in hardware cooling requirements creates a complex landscape that demands a strategy that is both flexible and adaptive. As shown in Figure 1, relying on a unified facility water system (FWS) introduces major inefficiencies. For example, liquid-cooled GPU racks may receive coolant below their required operating temperature when served by a single-temperature loop. This inefficiency becomes even more pronounced as the proportion of liquid- to air-cooled equipment increases (e.g., 90:10 liquid-to-air ratio for NVIDIA GB300 servers) since a larger share of the equipment is unnecessarily overcooled. Beyond operational efficiency, sustainability is a key priority for Microsoft even as we grow our AI infrastructure. Among our sustainability commitments, Microsoft has set goals to become carbon negative and eliminate water evaporation as a cooling method in its next-generation datacenters. A key lever for reducing carbon emissions is improving PUE (Power Usage Effectiveness, i.e., total power divided by IT power), a standard measure of datacenter power and energy efficiency. Achieving this requires dynamically matching cooling delivery to the specific needs of each equipment type, ensuring optimal performance, reduced energy consumption, and enhanced sustainability. Zonal Cooling: Flexible by Design Zonal cooling is a facility design that introduces multiple independent water loops, each supplying coolant at different temperatures. Figure 2 illustrates a specific implementation of the zonal concept with two facility-level zones: one loop serves air-cooled equipment, maintaining lower temperatures for human comfort and general-purpose hardware, and the other loop caters to liquid-cooled IT AI accelerators, which can operate efficiently at higher supply temperatures. This separation enables datacenter operators to precisely match cooling supply to the requirements of each zone, avoiding the inefficiency of over-cooling all equipment to the lowest common denominator. A key strength of zonal cooling is its flexibility. As new generations of IT hardware emerge, with varying thermal profiles, zonal cooling allows datacenters to adapt without major infrastructure overhauls. For example, future AI accelerators may need different liquid temperature ranges (see 30℃ Coolant - A Durable Roadmap for the Future) or technological improvements, such as microfluidics, may enable operating at even higher coolant temperatures, while general-purpose equipment requirements may remain unchanged. Zonal cooling’s architecture supports these changes by enabling operators to adjust loop temperatures and reconfigure cooling assignments as needed. Forms of Zonal Cooling Liquid cooling expands the allowable coolant supply temperature range and enables temperature-specific zones. This zonal approach can be applied at multiple layers: Facility-level: Two distinct temperature zones within a datacenter—one for air-cooled equipment and another for liquid-cooled equipment. Row-level: Tailor coolant temperature for each row based on deployed hardware (e.g., general-purpose vs GPU servers). Rack-level: Enable multiple temperature zones within a single rack for fine-grained optimization across servers. Chip-level: Apply zonal cooling inside the server. For example, use colder coolant for a GPU’s high-bandwidth memory (HBM) while supplying warmer coolant for the SoC and CPUs. This fine-grained approach can enable higher HBM stacking for improved performance, while avoiding unnecessary cooling overhead. Microsoft is building facility-level zonal cooling in the next generation of its AI datacenters going live in 2028 and beyond, while exploring the other three approaches in the lab. Facility-level zonal cooling is expected to reduce PUEs by up to 10%. Benefits from Zonal Cooling Zonal cooling is a strategic enabler for performance and efficiency. It can deliver: Improved energy efficiency and sustainability: By reducing the load on datacenter cooling infrastructure, zonal cooling improves energy efficiency as captured by annualized PUE, which measures average efficiency across all operating conditions. Lower annualized PUE means energy savings and lower carbon emissions. Increased server density: Tailored zonal cooling reduces peak cooling power demand during the hottest days, which in turn lowers peak PUE. Designers can leverage this reduction to reserve power for lower water temperatures (anticipating future accelerator needs), add more servers within the same utility power envelope, or contract less utility power per datacenter. Higher performance: Strategic control of coolant temperatures unlocks higher chip performance without sacrificing efficiency. For example, colder loops allow GPUs and CPUs to sustain elevated clock speeds via safe overclocking, while optimized memory cooling supports greater stacking density and increased bandwidth. Improved flexibility: With independent zones, operators can easily adjust coolant supply temperatures or reconfigure zones as new generations of hardware with varied cooling requirements emerge. This flexibility ensures compatibility with future innovations while maintaining optimal performance. Looking Ahead Zonal cooling represents a paradigm shift in datacenter thermal management. Its flexible, zone-specific approach to cooling air- and liquid-cooled IT equipment positions datacenters to efficiently adapt to future hardware innovations and workload diversity. As the industry continues to push boundaries in performance and sustainability, zonal cooling will be a foundational strategy for building performance and efficient infrastructure that meets tomorrow’s challenges.3.5KViews5likes1CommentDesigning Reliable Health Check Endpoints for IIS Behind Azure Application Gateway
Why Health Probes Matter in Azure Application Gateway Azure Application Gateway relies entirely on health probes to determine whether backend instances should receive traffic. If a probe: Receives a non‑200 response Times out Gets redirected Requires authentication …the backend is marked Unhealthy, and traffic is stopped—resulting in user-facing errors. A healthy IIS application does not automatically mean a healthy Application Gateway backend. Failure Flow: How a Misconfigured Health Probe Leads to 502 Errors One of the most confusing scenarios teams encounter is when the IIS application is running correctly, yet users intermittently receive 502 Bad Gateway errors. This typically happens when health probes fail, causing Azure Application Gateway to mark backend instances as Unhealthy and stop routing traffic to them. The following diagram illustrates this failure flow. Failure Flow Diagram (Probe Fails → Backend Unhealthy → 502) Key takeaway: Most 502 errors behind Azure Application Gateway are not application failures—they are health probe failures. What’s Happening Here? Azure Application Gateway periodically sends health probes to backend IIS instances. If the probe endpoint: o Redirects to /login o Requires authentication o Returns 401 / 403 / 302 o Times out the probe is considered failed. After consecutive failures, the backend instance is marked Unhealthy. Application Gateway stops forwarding traffic to unhealthy backends. If all backend instances are unhealthy, every client request results in a 502 Bad Gateway—even though IIS itself may still be running. This is why a dedicated, lightweight, unauthenticated health endpoint is critical for production stability. Common Health Probe Pitfalls with IIS Before designing a solution, let’s look at what commonly goes wrong. 1. Probing the Root Path (/) Many IIS applications: Redirect / → /login Require authentication Return 401 / 302 / 403 Application Gateway expects a clean 200 OK, not redirects or auth challenges. 2. Authentication-Enabled Endpoints Health probes do not support authentication headers. If your app enforces: Windows Authentication OAuth / JWT Client certificates …the probe will fail. 3. Slow or Heavy Endpoints Probing a controller that: Calls a database Performs startup checks Loads configuration can cause intermittent failures, especially under load. 4. Certificate and Host Header Mismatch TLS-enabled backends may fail probes due to: Missing Host header Incorrect SNI configuration Certificate CN mismatch Design Principles for a Reliable IIS Health Endpoint A good health check endpoint should be: Lightweight Anonymous Fast (< 100 ms) Always return HTTP 200 Independent of business logic Client Browser | | HTTPS (Public DNS) v +-------------------------------------------------+ | Azure Application Gateway (v2) | | - HTTPS Listener | | - SSL Certificate | | - Custom Health Probe (/health) | +-------------------------------------------------+ | | HTTPS (SNI + Host Header) v +-------------------------------------------------------------------+ | IIS Backend VM | | | | Site Bindings: | | - HTTPS : app.domain.com | | | | Endpoints: | | - /health (Anonymous, Static, 200 OK) | | - /login (Authenticated) | | | +-------------------------------------------------------------------+ Azure Application Gateway health probe architecture for IIS backends using a dedicated /health endpoint. Azure Application Gateway continuously probes a dedicated /health endpoint on each IIS backend instance. The health endpoint is designed to return a fast, unauthenticated 200 OK response, allowing Application Gateway to reliably determine backend health while keeping application endpoints secure. Step 1: Create a Dedicated Health Endpoint Recommended Path 1 /health This endpoint should: Bypass authentication Avoid redirects Avoid database calls Example: Simple IIS Health Page Create a static file: 1 C:\inetpub\wwwroot\website\health\index.html Static Fast Zero dependencies Step 2: Exclude the Health Endpoint from Authentication If your IIS site uses authentication, explicitly allow anonymous access to /health. web.config Example 1 <location path="health"> 2 <system.webServer> 3 <security> 4 <authentication> 5 <anonymousAuthentication enabled="true" /> 6 <windowsAuthentication enabled="false" /> 7 </authentication> 8 </security> 9 </system.webServer> 10 </location> ⚠️ This ensures probes succeed even if the rest of the site is secured. Step 3: Configure Azure Application Gateway Health Probe Recommended Probe Settings Setting Value Protocol HTTPS Path /health Interval 30 seconds Timeout 30 seconds Unhealthy threshold 3 Pick host name from backend Enabled Why “Pick host name from backend” matters This ensures: Correct Host header Proper certificate validation Avoids TLS handshake failures Step 4: Validate Health Probe Behavior From Application Gateway Navigate to Backend health Ensure status shows Healthy Confirm response code = 200 From the IIS VM 1 Invoke-WebRequest https://your-app-domain/health Expected: 1 StatusCode : 200 Troubleshooting Common Failures Probe shows Unhealthy but app works ✔ Check authentication rules ✔ Verify /health does not redirect ✔ Confirm HTTP 200 response TLS or certificate errors ✔ Ensure certificate CN matches backend domain ✔ Enable “Pick host name from backend” ✔ Validate certificate is bound in IIS Intermittent failures ✔ Reduce probe complexity ✔ Avoid DB or service calls ✔ Use static content Production Best Practices Use separate health endpoints per application Never reuse business endpoints for probes Monitor probe failures as early warning signs Test probes after every deployment Keep health endpoints simple and boring Final Thoughts A reliable health check endpoint is not optional when running IIS behind Azure Application Gateway—it is a core part of application availability. By designing a dedicated, authentication‑free, lightweight health endpoint, you can eliminate a large class of false outages and significantly improve platform stability. If you’re migrating IIS applications to Azure or troubleshooting unexplained Application Gateway failures, start with your health probe—it’s often the silent culprit.762Views0likes0Comments
0.011W Power Floor on i7-1255U: A Step Toward Microsoft’s Sustainability Vision
It is inspiring to see Microsoft leading the tech industry toward a greener future. Initiatives such as the Carbon Negative 2030 goal and the Energy Saver features in Windows 11 are important steps in environmental stewardship. These efforts show that software and hardware can work in harmony to preserve our planet. As a researcher, I have spent 18 months exploring how to further support this vision by identifying the absolute efficiency “floors” of the Intel Core i7-1255U (Alder Lake). My study focuses on a configuration that enhances Microsoft’s energy-saving protocols to achieve maximum hardware longevity. Key Technical Findings (18-Month Case Study): Dynamic Power Floors: Through precise optimization, I observed CPU power draw dropping to a floor of 0.011W at 1.8MHz during deep idle/sleep states, with the GPU reaching a 0W floor. Efficiency in Motion: During active productivity tasks, the system can reach 0.4W – 0.5W at a voltage range of 0.6V – 0.8V, demonstrating impressive scaling flexibility. Thermal Performance: The system consistently operates between 25°C – 35°C. In cooler ambient environments (15°C – 25°C), hardware can maintain 16°C – 20°C, virtually eliminating thermal stress. Battery Endurance: Using a standard 3-cell battery with 5% wear (originally marketed for 6 hours), these optimizations enabled up to 10 hours of continuous video playback. Uncompromised Stability: Over 18 months of daily usage, the system has encountered zero Blue Screen of Death (BSOD) events. This confirms that pushing efficiency boundaries can be done while maintaining the rock-solid reliability expected of the Windows platform. This study is a tribute to the versatility of Windows 11 and the engineering behind modern silicon. By maximizing the life of the devices we already own, we contribute directly to reducing global e-waste. Detailed technical logs (HWiNFO) and configuration data are available for verification here: 👉 [[Intel 12th] 0.011W Package Power Floor via Custom Optimization | Microsoft Community Hub] I look forward to discussing these efficiency milestones with the community and Microsoft engineers.219Views0likes0CommentsTechSpark Fireside Chat: Sustainable Funding
Nonprofit sustainability is looking at today, tomorrow, and years down the road. At this fireside chat, the Microsoft TechSpark team will explore approaches and funding strategies toward the viability of organizations. You will hear from experts in research, practice, and on the public and private side. Gain perspectives and insights on how the advancement of sustainability advances overall impact. This event will be presented by Linda Nguyen from Microsoft TechSpark, Mark Muro, Senior Fellow at Brookings Metro, Edwina Manyeh, Tech Hubs Deputy Director, U.S. Economic Development Administration (EDA), U.S. Department of Commerce and Myung J. Lee, Chief Strategy Officer for Living Cities. Register for the event here1.6KViews0likes0CommentsThis is AI for Sustainability
Join us on February 13 to see how Microsoft data and AI solutions can support your sustainability journey. Hear how customers are using these solutions to advance their sustainability progress, prepare for evolving regulations, and drive business transformation. Register for this digital event to see in-depth demos and learn how to: Improve ESG (environmental, social, and governance) data management to help meet reporting needs and commitments. Deliver clear insights and empower employees to drive action on sustainability initiatives. Discover new opportunities for agility, resilience, and business growth. Plus, get guidance about how to confidently navigate sustainability challenges with market-leading data and AI solutions from Microsoft. This is AI … for Sustainability Tuesday, February 13, 2024 8:00 AM–9:15 AM Pacific Time (UTC-8) Register now >Microsoft's AI & Sustainability Playbook
How can AI be used to help accelerate sustainability? Microsoft's Vice Chair and President, Brad Smith, shared a new playbook that outlines five enabling conditions for using AI to accelerate sustainability solutions. Learn more and access the playbook here: Brad Smith LinkedIn - Accelerating Sustainability with AI: A Playbook432Views4likes0CommentsMicrosoft fortalece su compromiso eco en tareas sostenibles
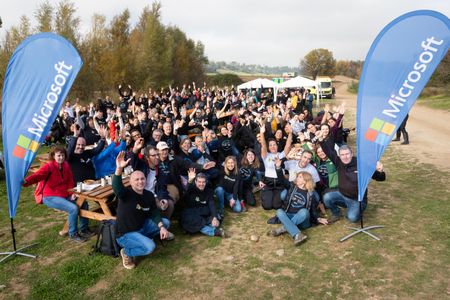
En Microsoft España seguimos al pie del cañón con nuestro compromiso con el medioambiente y hemos reunido junto a Fundación FDI a más de 300 personas, entre nuestros partners, Fundación AMAS y Fundació Privada Rosella para la reforestación de más de 600 árboles en las localidades de Sitges y Algete. ¿Nuestro objetivo? Revitalizar ambas áreas, reducir las emisiones de carbono y potenciar la biodiversidad. Esta actividad forma parte de la iniciativa Microsoft Community Empowerment, que pertenece al programa Datacenter Community Development de Microsoft y busca un impacto positivo en las comunidades donde se ubicarán los centros de datos de Microsoft. Lee más aquí.243Views0likes0Comments