statistics
1 Topic
Join us for the GeoStats preview in Microsoft Planetary Computer Pro
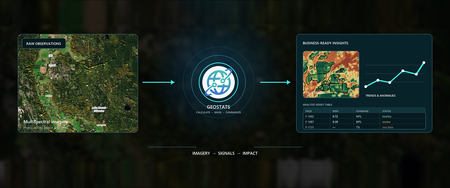
An agricultural lender monitoring a portfolio of farms wants a weekly view of vegetation conditions so its risk team can identify fields that need attention. Satellite imagery contains that signal, but reviewing imagery field by field does not scale. Turning millions of raster pixels into operational insights can require a specialized pipeline to find imagery, align it to operational boundaries, calculate indices, summarize pixels, and publish results. GeoStats in Microsoft Planetary Computer Pro is designed to simplify that process, computing raster-derived statistics for geometries at scale and publishing the results as analysis-ready tables in your GeoCatalog. With this feature, you bring the areas that matter to your organization, select imagery and a calculation, and choose the statistics you need. GeoStats matches observations to geometries, processes raster values, and returns rows that can feed reporting, forecasting, risk models, and operational decisions. GeoStats is currently in preview. Features, API contracts, supported formats, and service limits might change before general availability. Move from pixels to business-ready data Most organizations do not make decisions one pixel at a time. They make decisions about fields, properties, service areas, watersheds, administrative regions, and other recognizable units of work. GeoStats connects those two worlds. It takes a set of geometries and one or more raster observations (overlapping scenes from Sentinel 2, for example), evaluates the requested calculations, and summarizes the valid pixels inside each geometry. The result is statistical values translated from pixels, that preserve a stable geometry identifier from your original inputs and add columns for the requested calculation. With GeoStats, teams can: Bring geometries that represent their areas of interest, including field boundaries, H3 grid cells, or other custom polygons, for statistical analysis. Select from a prebuilt set of vegetation, water, burn, moisture, snow, or soil indices, or define custom expressions for other calculations. Use collection-compatible built-in formulas without writing expressions or mapping source bands manually. Calculate statistics such as mean, minimum, maximum, median, standard deviation, sum, count, and percentiles. Process each raster item independently, resolve observations into a mosaic, or pool observations across a time period. Apply product-specific quality masks for conditions such as cloud, shadows, or snow. Estimate work before running a computation. Reuse saved computations with different geometry inputs or output destinations. Publish results as GeoParquet, GeoJSON, or Delta and register them as STAC items in the GeoCatalog. Optionally include image chips with item or mosaic results for visual review. Runs are asynchronous, so applications can submit larger analyses, monitor their progress, and discover the published result when processing completes. GeoStats uses the same Microsoft Entra ID authentication, GeoCatalog authorization, and tenant isolation model as other Planetary Computer Pro data-plane capabilities. – Field boundaries overlaid on vegetation health data (NDVI). Two inputs that GeoStats uses to reduce data to singular statistical value per geometry. From field boundaries to a prioritized inspection list Consider, again, the agricultural lender that monitors a portfolio of farms. Its risk team has field boundaries and basic business attributes, but reviewing imagery field by field does not scale. The team wants a weekly view of vegetation conditions so it can identify fields at risk and prioritize conversations with growers. The input is a table of field geometries. This simplified sample uses Well-Known Text to make the polygons readable; in practice, the geometries can be supplied in GeoJSON format or referenced from a supported vector asset in the user’s GeoCatalog. The tables that follow are for illustrative purposes only. They contain fictional data and do not represent actual results. field_id farm_name crop area_ha geometry F-1042 North Valley Wheat 86.4 POLYGON ((-120.50 47.50, -120.49 47.50, -120.49 47.51, -120.50 47.51, -120.50 47.50)) F-1087 Cedar Ridge Corn 112.7 POLYGON ((-120.44 47.46, -120.42 47.46, -120.42 47.48, -120.44 47.48, -120.44 47.46)) F-1131 River Bend Soy 64.9 POLYGON ((-120.38 47.53, -120.37 47.53, -120.37 47.54, -120.38 47.54, -120.38 47.53)) The team selects a Sentinel-2 collection copied from the Planetary Computer into its own GeoCatalog. Rather than building its own Normalized Difference Vegetation Index (NDVI) expression and manually choosing red and near-infrared assets, it first lists the formulas available to that collection. When NDVI is an allowable formula given the input source imagery, the computation references the preset directly: { "calculations": [ { "formulaId": "ndvi" } ], "statistics": [ "mean", "percentile_10", "percentile_90", "count" ], "observationStrategy": { "mode": "all" }, "temporal": { "period": "P1W", "gridPolicy": "reproject", "resampling": "nearest", "minValidFraction": 0.8 } } The preset contains the expression and collection-specific band mapping that GeoStats resolved from the source metadata. This matters for imagery products whose bands can be stored in separate assets or at different native resolutions. The user chooses a compatible formula and runs it; GeoStats handles the configured mapping instead of asking the user to recreate it. For a weekly analysis, GeoStats can pool valid observations for each field and period, then add the requested statistics and quality information. The following illustrative output shows selected columns; the stable geometry_id links every result row back to the source field_id. geometry_id period_start period_end item_count ndvi_mean ndvi_percentile_10 ndvi_percentile_90 ndvi_count spatial_valid_fraction status F-1042 2026-07-01 2026-07-08 3 0.72 0.58 0.84 8,436.7 0.94 ok F-1087 2026-07-01 2026-07-08 2 0.39 0.18 0.61 9,882.2 0.89 ok F-1131 2026-07-01 2026-07-08 2 null null null 0.0 0.07 belowValidFraction The result is more than a single index value: ndvi_mean provides a portfolio-friendly summary for comparison and trend analysis. ndvi_percentile_10 is the value at or below which 10% of valid NDVI observations fall, while ndvi_percentile_90 is the value at or below which 90% fall. Comparing these percentiles with the mean shows the spread of conditions within a field; a low 10th percentile may signal that part of the field is underperforming even when the average remains relatively high. ndvi_count reports valid observation weight across the contributing images, including fractional contributions from pixels along polygon boundaries. spatial_valid_fraction helps the team distinguish a meaningful observation from one with too little usable coverage. status makes rows with insufficient or missing data explicit instead of silently treating them as healthy or unhealthy fields. The lender can join these rows to its portfolio table, compare each field with prior periods or similar crops, and route unusual conditions for review. GeoStats does not make the lending or agronomic decision. It helps shorten their path from imagery to a consistent, traceable signal that domain experts can evaluate alongside weather, grower reports, financial information, and local context. The same pattern can support many other workflows: monitor vegetation near utility corridors, summarize burn severity by management unit, track water conditions by watershed, compare urban heat indicators across neighborhoods, or measure environmental conditions around insured assets. Capabilities for repeatable analysis Start with prebuilt formulas or define your own GeoStats includes built-in formulas for commonly used indices, including NDVI, Normalized Difference Water Index, Normalized Burn Ratio, Normalized Difference Moisture Index, Normalized Difference Snow Index, Bare Soil Index, and several other indices. Formula availability is collection-specific. GeoStats adds a built-in only when the collection metadata identifies every required band without ambiguity. The formulas endpoint shows which can be used with a particular collection in a particular GeoCatalog. This preset-first experience is designed to make common analysis approachable for people who understand the business question but should not need to know every asset key, band name, or resolution detail in the source product. Advanced users can still save custom expressions and band mappings when a compatible built-in does not cover their use case. Formula ID Index Required EO common-name bands bsi Bare Soil Index swir16, red, nir, blue ebbi Enhanced Built-Up and Bareness Index swir16, nir, lwir11 evi2 Two-band Enhanced Vegetation Index nir, red ibi Index-based Built-up Index swir16, nir, red, green nbr Normalized Burn Ratio nir, swir22 ndbi Normalized Difference Built-up Index swir16, nir ndmi Normalized Difference Moisture Index nir, swir16 ndre Normalized Difference Red Edge Index nir, rededge ndsi Normalized Difference Snow Index green, swir16 ndvi Normalized Difference Vegetation Index nir, red ndwi Normalized Difference Water Index green, nir Build repeatable analysis, not one-off processing GeoStats separates reusable analysis settings from the inputs and destinations that can change between runs. A saved computation can define the raster time range, formulas, statistics, quality mask, and observation strategy. Teams can then run that definition with new geometries or publish results to a different destination. Three observation strategies support different questions: Item processes every matching STAC item independently, preserving a row for each feature-item pair. Mosaic resolves overlapping observations by an explicit priority, such as latest or least cloudy, and produces one row for each feature and period. All pools every valid pixel observation across matching items and produces one statistical summary for each feature and period. Outputs retain timing, coverage, status, and source provenance appropriate to the selected strategy. That makes it easier to audit how a value was produced and to distinguish a true condition from a gap in usable imagery. Publish results for downstream decisions GeoStats can publish analysis-ready results as GeoParquet, GeoJSON, or Delta and register them as STAC items in the GeoCatalog. Applications can discover the result when asynchronous processing completes, then connect it to reporting, forecasting, risk, or operational workflows. These open formats can be used with downstream analytics platforms, including Microsoft Fabric, as part of broader data engineering, analytics, and reporting workflows. Explore the GeoStats preview with us We are inviting customers and partners to use GeoStats with real imagery, operational boundaries, and business questions. This is an opportunity to test the capability, tell us where it creates value, and help shape what comes next. We would especially like to hear from teams that: Repeatedly summarize raster data over fields, assets, administrative areas, or other business boundaries. Maintain custom pipelines for zonal statistics, raster indices, temporal aggregation, or image chips. Need analysis-ready geospatial results for forecasting, risk, reporting, or operational workflows. Work with Open Planetary Computer datasets or their own raster collections in a GeoCatalog. Want to connect geospatial analysis with Azure data, analytics, and AI services. If you are interested in trying GeoStats, complete the Planetary Computer Pro preview feature request form. Select GeoStats and tell us about your organization, GeoCatalog, and intended use case so that we can follow up about access to the feature. Learn more Read the GeoStats overview. Run a built-in GeoStats formula. Explore Microsoft Planetary Computer Pro.