sql server
205 TopicsLessons Learned #560: SQL Is Slow — What Can Query Store and SSMS Copilot Uncover?
In our recently delivered session, “SQL Is Slow — What Can Query Store and SSMS Copilot Uncover?”, we demonstrated step by step how to investigate a performance problem by combining Query Store with Copilot’s capabilities in SSMS. The demonstration starts with a PHP program executing queries while we grow a table from a few hundred to millions of rows. As different execution plans appear and performance changes, we follow the evidence in Query Store to uncover what is happening and decide what to investigate next. One clue stood out. The query took about 12 milliseconds per execution in one interval and almost 2.5 seconds in another interval under the same Plan ID. Other plans appeared during the complete lab. Understanding both the differences between plans and the changes within a plan became part of the investigation. Along the way, we demonstrated how a guided conversation with Copilot can become an Agent investigation, and how the investigation itself can be captured in a reusable skill. The useful result was a method that keeps asking for evidence before accepting an explanation. The session brings the two tools together: Query Store supplies the recorded history, and Copilot helps us examine it and decide what to investigate next. The same troubleshooting story lets the audience follow Ask mode, Agent mode and the reusable skill without losing the connection to the underlying SQL evidence. A growing table and several execution plans For our sessions, we use a PHP program that generates 16 different simulations of performance and connectivity problems, allowing us to demonstrate how to investigate these scenarios through practical demos. We also have code developed in .NET and Java. In this demonstration, we add records to dbo.Notes in stages, reaching approximately 200, 32,000, 65,000, 2 million, and 4 million rows, while the PHP program executes dbo.GiveNotes with different @N values. This lets us observe how performance and execution plans evolve as the data volume grows. Several execution plans accumulated during the complete demonstration. We compared all of them, then inspected the runtime intervals within each Plan ID. The reference run revealed this change within the history of one plan: Average per execution Healthy interval Degraded interval Approximate increase CPU 7.69 ms 1,443.19 ms 188 times Duration 12.39 ms 2,473.68 ms 200 times Logical reads 68.39 12,233.10 179 times The duration increase was approximately 200 times. This comparison covers two intervals for one Plan ID, not the whole sequence of table sizes. It does not assign a particular plan or timing to each row-count stage. These are lab observations; identifiers and timings vary between runs. The reads were particularly revealing. Each execution was touching far more pages. A later plan change could not, by itself, explain degradation that had already started while the earlier plan remained in use. The next step was to investigate what had increased the work per execution. Build the timeline before choosing the explanation We first compared workload contributors using total CPU, elapsed duration, logical reads and execution count. Total consumption identified where the workload impact was concentrated; averages per execution helped distinguish expensive executions from a high volume of individually inexpensive calls. Next, we collected every plan for the selected query and compared runtime intervals chronologically. We discovered the identifiers from the database instead of supplying fixed Query IDs or Plan IDs. We asked both when another plan appeared and whether the cost had already increased before that change. A plan summary alone can hide this story. One average across a plan’s entire history blends its healthy and degraded periods. The interval history shows when the work changed and whether that happened before another plan appeared. Aggregation mattered. When combining runtime statistics, we weighted each average by its execution count. A simple average of interval averages would give a lightly used interval the same influence as a heavily used one. We also kept units explicit and separated execution types where needed. Weighted average = SUM(average value * execution count) / SUM(execution count) The increase in logical reads directed the investigation toward the amount of data processed and the access path. Waits could help explain elapsed time, but waits alone would not explain that increase in reads. dbo.GiveNotes filtered dbo.Notes on ID < @N and grouped by Name. The clustered primary key was on id2, a different column from the predicate. As rows were added, a reused plan could process more data; changing @N could also change how many rows qualified. A new Plan ID was a separate event to investigate, not an explanation to assume. Different @N values can qualify different numbers of rows, and table growth can increase the work even with an unchanged plan. We inspected distribution, statistics and access paths to test that explanation. Query Store interval averages alone do not tell us the parameter used by every execution, and parameter-sensitive behavior does not automatically prove parameter sniffing. One investigation through three Copilot experiences In Ask mode, we guided the conversation one question at a time. We first requested the Query Store overview, then asked which contributor to investigate and how its plans behaved over time. The staged prompts delayed statistics, index and parameter analysis until the runtime evidence justified those questions. Where required, we ran generated diagnostic T-SQL and brought the results back into the conversation. In Agent mode, we supplied the investigation goal and allowed Copilot to choose and execute diagnostic steps using the available SQL tools. We reviewed the proposed actions and kept the investigation read-only. The agent could use each result to decide what to inspect next. Finally, we captured the sequence in an Agent Skill. We wanted the next investigation to preserve the critical question: did the query become more expensive while the same plan was still being reused? Agent Skills provide task-specific instructions that Copilot can discover and use in Agent mode. We also demonstrated the reusable method through GitHub Copilot CLI. Database execution still requires a configured SQL tool or MCP server; without that capability, the workflow must generate diagnostics for the engineer to run. What we put into the reusable skill The SQL Performance Investigator pack captures the diagnostic sequence alongside the calculation rules and starting prompts. The agent is instructed to: Identify the main workload contributor and retain its Query ID. Collect all associated plans and their runtime history. Check whether degradation began while the same plan remained in use. Investigate relevant selectivity, statistics and index evidence. Separate confirmed observations from hypotheses and propose validation. A skill makes the method reusable; it does not guarantee the diagnosis is correct. Missing history, incorrect aggregation or a plausible but unsupported inference still need an engineer’s attention. We kept discovery read-only, with SQL permissions enforcing the access boundary. A proposed index still needs evidence of improvement In the demonstration, we evaluated an index with ID as its leading key and Name as an included column: CREATE NONCLUSTERED INDEX NOTES_IX1 ON dbo.Notes (ID) INCLUDE (Name); The key matches the range predicate, while the included column makes Name available for the aggregation. Whether this improves the workload depends on selectivity, data volume and the competing plans. Its storage and write costs also matter. We treated this as a remediation candidate. Validation requires a comparable workload, including parameter distribution and concurrency, followed by a Query Store comparison of reads, CPU, duration and variability. We did not equate an index recommendation with a demonstrated improvement. Statistics also need careful interpretation. An index histogram describes its leading key; adding Name as an INCLUDE column does not create a histogram on Name. An existing auto-created statistic should not be dropped merely because its column appears in a covering index. The lesson we took from the demonstration The complete story contained a growing table and multiple plans. Within that history, one plan became much more expensive before a later plan could explain the change. Comparing plans and examining changes within each plan gave us complementary evidence. Copilot helped us follow it, and the skill preserved the investigation sequence for another database. We enjoyed presenting this session. For DBAs, developers and support engineers, the session offers a practical way to watch a performance investigation unfold, from the PHP workload and Query Store history to the prompts and reusable skill. We look forward to continuing this demonstration and discussion with SQL user groups and the wider technical community. If you have encountered a query that became slower while the same plan remained in use, which evidence helped you explain the change? We would be interested to hear how you approached it. References and prerequisites For the SSMS Agent and Skills experience described here, Microsoft documents SSMS 22.7 or later with the AI Assistance workload and GitHub Copilot access. Query Store must be enabled with relevant history available. Specify the target server and database in the Agent prompt rather than relying on the active editor context. Check the current documentation before reproducing the session. GitHub Copilot Agent mode in SSMS Agent Skills in SSMS Monitoring performance by using Query Store Query Store runtime statistics Try the investigation with our prompts These prompts offer a practical starting point for the method demonstrated in our session. The Ask prompt is the opening prompt from our session workflow. The Agent prompts are adapted from our accompanying pack to make the target server, database and investigation window explicit. Replace the angle-bracket placeholders before submitting them. Start with Ask mode We began with a request for evidence, deliberately postponing diagnosis. Run the generated diagnostic query against the intended lab database and use its results for the next questions. I want to start a SQL performance troubleshooting investigation using Query Store. Generate a single read-only T-SQL query that I can execute in the current database to identify the main performance contributors. The query must use Query Store and return, for each query: * Query ID * Query text * Object or stored procedure name, when available * Number of execution plans * Number of executions * Total CPU time * Average CPU time per execution * Total duration * Average duration per execution * Total logical reads * Average logical reads per execution Aggregate Query Store runtime statistics correctly across runtime intervals and execution plans. Use weighted calculations based on count_executions. Do not calculate averages by simply averaging Query Store average values. Return CPU and duration values in milliseconds. Rank the results by total CPU consumption, but include all the metrics above so that we can determine later which resource is having the highest impact. Do not perform root-cause analysis yet. Do not include execution plan analysis, parameter sensitivity, statistics analysis, index analysis, or remediation recommendations. Only generate the read-only diagnostic T-SQL query that I should execute. We then asked which resource deserved investigation, which query contributed most, how all its plans performed over time, and whether the same Plan ID had become more expensive. Only after those answers did we investigate selectivity, statistics and indexes. The complete session workflow contains the staged follow-up prompts. Convert the conversation into an Agent investigation We moved the recurring calculation rules and diagnostic sequence into sql-performance-investigator. The starting prompt could then state the goal, scope and execution boundaries. The skill supplies the detailed method; the available SQL tools supply execution capability. The agent retains the discovered query and plan identifiers within the investigation. It should not ask the engineer to copy them between steps or assume the identifiers from a previous lab run. Run the method in SSMS Agent mode Make the skill available to SSMS, select Agent mode and verify the SQL tools are enabled. Specify the target explicitly because Agent mode does not inherit the active query editor context. Investigate the SQL performance problem on server <server>, database <database>, using Query Store for <UTC start> to <UTC end>. Use the sql-performance-investigator skill. Use the available sql-tools to execute read-only diagnostics and continue through the investigation, requesting approval where the host requires it. Automatically discover the dominant performance metric, target query, Query ID, all Plan IDs, runtime history, and any same-plan degradation. Retain the discovered identifiers internally. Investigate the evidence needed to explain the change, including selectivity, data distribution, statistics and existing indexes when relevant. Do not assume a plan change caused the degradation or label it parameter sniffing without evidence. Keep confirmed evidence, inference, hypotheses and missing evidence separate. Use execution-weighted averages and explicit units. If the requested history or permissions are unavailable, report the limitation. Do not create/drop indexes, update/drop statistics, force plans, clear caches, modify Query Store, or change data/schema. Finish with a supported diagnosis or remaining uncertainty, a proposed remediation if justified, and a Query Store before/after validation plan. Do not execute remediation. Use the same method in GitHub Copilot Our pack places the skill at .github/skills/sql-performance-investigator/SKILL.md and the Custom Agent at .github/agents/sql-performance-investigator.agent.md. The skill references workflow.md and query-store-rules.md for the detailed method. In GitHub Copilot CLI, select the SQL Performance Investigator custom agent and use this adapted starting prompt: Use the SQL Performance Investigator custom agent and the sql-performance-investigator skill. Investigate SQL performance on <server>, database <database>, for <UTC start> to <UTC end>, using Query Store from evidence to diagnosis. If a SQL execution tool/MCP is available, run only read-only diagnostics and continue through the investigation. Discover Query IDs and Plan IDs automatically and retain them internally. Follow the host approval requirements. If no SQL execution capability is available, generate one self-contained read-only diagnostic batch for me to run, then continue when I provide the result. Do not claim that SQL was executed. Do not apply remediation. Propose an index/statistics action only after the evidence supports it. Finish with a before/after Query Store validation plan. The reusable asset is the investigation procedure behind these prompts. Query Store supplies the evidence, Copilot helps carry out the investigation, and the engineer reviews whether the explanation and proposed change are supported by the results.Managed Instance link – connecting SQL Server to Azure reimagined
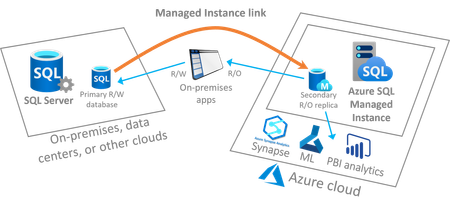
Link feature for Managed Instance is a new feature reimagining the connection between SQL Server hosted anywhere and the fully managed PaaS service Azure SQL Managed Instance, providing unprecedented hybrid flexibility and database mobility. With an approach that uses near real-time data replication to Azure, you can offload workloads to read-only secondaries on Azure to take advantage of a fully managed database platform, performance, and scale. The link can be operated for as long as you need it – months and years at a time, empowering you to get all the modern benefits of Azure today without migrating to the cloud. On your modernization journey, when and if you are ready to migrate to the cloud, the link de-risks your migration experience allowing you to validate your workloads in Azure prior to migrating with a seamless and instant experience, and at your own pace. This article provides deeper insights into this new feature.26KViews4likes9CommentsDatabase Hub in Fabric: Now in Public Preview -Turn Database Signals into Guided Action
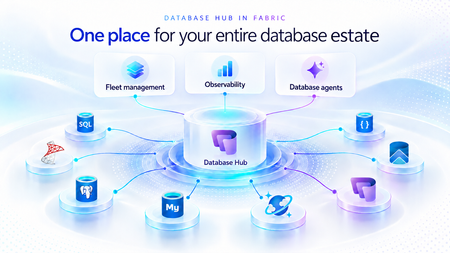
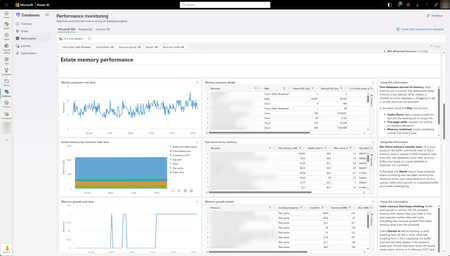
As applications grow, so does the database estate behind them. What starts with a handful of databases can become hundreds or thousands of resources spread across services, subscriptions, and environments. For the teams responsible for keeping them healthy, the challenge is no longer just collecting signals. It is knowing what needs attention, why it matters, and what to do next. Now in public preview, Database Hub in Microsoft Fabric brings inventory, health, performance, security, and optimization insights into one connected experience. It helps administrators and developers see the bigger picture, identify affected resources, and move from estate-wide visibility to focused investigation, without losing the context that brought them there. The preview brings together supported resources across Azure SQL Database, SQL Server enabled by Azure Arc, Azure Database for PostgreSQL, Azure Cosmos DB, and SQL database in Fabric. Available capabilities and signals vary by service and preview configuration. Database Hub Overview brings together estate-wide findings and cross-engine performance trends to help you prioritize what needs attention. Start with what needs your attention When you manage a large database estate, another dashboard is only useful if it helps you decide where to spend your time. The Overview page provides that starting point, bringing together findings across security, performance, and optimization. It distinguishes Issues, which require timely attention, from Suggestions, which highlight opportunities to improve your estate over time. You might begin with a security configuration that needs review or a performance signal that warrants investigation. Selecting a finding opens Estate with the relevant filters already applied, so you can see the affected resources rather than search for them again. The result is a more direct path from “something needs attention” to “these are the resources I should investigate.” Overview highlights issues across Security, Performance, and Optimization, with affected-resource counts and direct links to investigate further. Bring your estate into one view, and make it relevant to you The Estate experience brings supported resources into a unified inventory, scoped to your existing permissions. Search and filters help you narrow that inventory to the service, subscription, or resource group you manage. This is especially useful when your responsibilities span database engines. You can begin with a broader view, then focus on Azure SQL databases, Arc-enabled SQL Server resources, or Azure Database for PostgreSQL flexible servers without rebuilding the resource list in separate portals. Each resource brings its associated Issues and Suggestions into context. Open a finding to review the affected resource, supporting information, and recommended next step. The inventory also respects the resource model of each service. For example, the PostgreSQL view represents flexible server instances, rather than every database hosted within them. A unified view does not mean moving your databases. Your Azure resources remain in their existing subscriptions, and on-premises SQL Server instances remain on-premises, connected through Azure Arc. Database Hub brings operational context together; it does not require relocating or mirroring your application data into Fabric. Estate brings resource inventory, Issues, and Suggestions into one view, with quick actions to continue investigation in the Azure portal, VS Code, or SSMS. Understand security posture and performance in context Database Hub helps you identify configurations worth reviewing and resources that need a closer look. For security, supported signals can include Microsoft Entra authentication, customer-managed keys, and auditing coverage, depending on the database service. These findings provide a starting point for investigation, not a blanket judgment that every flagged resource is insecure or noncompliant. For example, a suggestion to review customer-managed keys should be evaluated against your organization’s requirements. A resource using service-managed keys is still encrypted at rest. For performance, built-in dashboards bring supported utilization and activity signals into view, including CPU, memory, storage, I/O, and connections. Review trends across your estate, then narrow the scope and time range to investigate individual resources. Metric availability varies by engine and monitoring configuration; missing data should not be interpreted as good health. For supported SQL monitoring scenarios, you can also create a custom monitoring dashboard from a template and tailor its charts and layout to the resources your team follows regularly. Together, these experiences help answer two practical questions: Where is pressure building, and where is there an opportunity to improve? Performance summaries highlight recent capacity signals and trends across Microsoft SQL, PostgreSQL, and Cosmos DB. The Security dashboard summarizes Microsoft Entra authentication, audit logging, and customer-managed key coverage, helping you identify configurations that warrant review across your estate. The Performance monitoring dashboard combines memory-pressure trends, resource-level details, and interpretation guidance to help focus your investigation. Move from a finding to an informed next step Estate-wide visibility is the beginning of an investigation, not a replacement for database expertise. When a finding needs deeper analysis, Database Hub helps you review the evidence and continue in the appropriate native experience, such as the Azure portal or SQL Server Management Studio (SSMS). Engine-specific diagnostics and configuration changes remain in the tools designed for that work. Consider a performance issue that occurred before an administrator could inspect it. In supported agent-assisted scenarios, captured incident evidence can help establish what happened, when it happened, and which queries or sessions were involved. That context gives the administrator a more informed starting point for investigation. The operator remains in control: review the evidence, evaluate the recommendation, and apply authorized changes through the appropriate service tools. The preview investigation workflow does not automatically remediate issues, and existing permissions and approval requirements continue to apply. Bring database expertise into agent-assisted workflows We are also making database operational intelligence available through agent skills: reusable capabilities that agents can call to support observability, monitoring, diagnostics, optimization, and other database operations. Database Hub provides estate context; skills provide a way to bring database expertise into an agent-assisted investigation. This creates a foundation for helping teams move from identifying an affected resource to understanding its signals and evaluating the next step. We’re building toward making this expertise available in the AI companions and development tools teams already use, with recommendations grounded in evidence, the specific database, and your organization’s operational controls. If we take a step back, our broader vision brings together a free, extensible Database Hub experience, agentic observability, and OneLake integration, all within Microsoft Fabric. It’s a foundation for connecting database operations with analytics and AI and helping teams turn signals into informed action. Get started with Database Hub Start with the Database Hub documentation to review preview availability, supported services, and setup requirements. Ask your Fabric administrator to enable the preview where required, confirm that you have the appropriate resource permissions, and complete any service-specific monitoring prerequisites. Then open Microsoft Fabric, select Databases in the left navigation, and begin with Overview. Choose a finding, explore the affected resources in Estate, and follow the evidence into your next investigation. For more details on supported services and getting set up, the Database Hub documentation is also available on Microsoft Learn. Learn more What is Database Hub in Fabric? Enable performance monitoring for Microsoft SQL Performance Monitoring for Azure SQL in Database Hub761Views5likes1CommentMI link support for multiple databases in an Always On availability group for SQL Server (Preview)
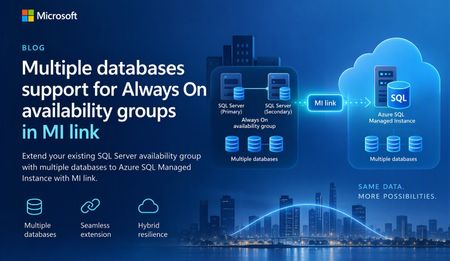
A simpler way to extend availability groups to Azure We are pleased to announce the preview of multi-database mode for Managed Instance link. The new mode lets you replicate multiple databases from an existing Always On availability group through a single link between SQL Server and Azure SQL Managed Instance. Managed Instance link uses distributed availability group technology to provide near-real-time replication between SQL Server and Azure SQL Managed Instance. It supports hybrid architectures, online migration, disaster recovery, and read-only workload offload. The link can be configured and managed through SQL Server Management Studio (SSMS), PowerShell, Azure CLI, and Azure APIs. Previously, each link supported one database. Customers with multi-database availability groups therefore had to split databases into separate availability groups and create a link for each database. Multi-database mode removes that limitation for supported SQL Server versions and editions, while the existing single-database mode remains available for earlier versions and other supported configurations. What you can do with multi-database link mode Migrate multiple databases to Azure SQL Managed Instance with minimal cutover downtime. Offload read-only workloads, including reporting and analytics, to the secondary replica. Use Azure SQL Managed Instance as a disaster recovery target for supported SQL Server versions. Start replication in either direction when the SQL Server version and Azure SQL Managed Instance update policy support that direction. Reverse primary and secondary roles through a planned failover. Build hybrid and multicloud topologies that place database groups where they are most useful. One link for an existing multi-database availability group If you already use an Always On availability group, multi-database link mode lets you extend the complete database group to Azure SQL Managed Instance without creating a separate availability group for every database. All databases in the link move together as one managed group. Databases on the primary are read-write, while their copies on the secondary are read-only. Use of your existing Always On AG listener endpoint is supported with multi-database mode MI link, allowing the link to remain operational after a local AG failover. Image 1: A multi-database Always On availability group replicated to Azure SQL Managed Instance through one Managed Instance link. The diagram illustrates the availability group relationship rather than a specific Azure SQL Managed Instance service-tier replica count. Managed Instance link is supported across all Azure SQL Managed Instance service tiers. Run multiple links in different directions A single SQL Server instance can participate in multiple links. Each link can carry a different availability group, and supported links can replicate in different directions at the same time. In the following example, AG1 (containing DB1, DB2, and DB3) replicates from SQL Server to Azure SQL Managed Instance through MI link 1. AG2 (containing DB4, DB5, and DB6) replicates from Azure SQL Managed Instance to SQL Server through MI link 2. Both links can operate at the same time between the two instances. Image 2: Two multi-database availability groups using separate links with opposite replication directions. Important: Database names must be unique in this configuration. A database cannot be renamed on the secondary while it is participating in replication to resolve a naming conflict. Replicate one availability group to multiple managed instances Multi-database mode also supports fan-out topologies. You can replicate multiple availability groups to one managed instance, or replicate the same availability group to different managed instances. For example, separate links can target managed instances in different Azure regions. Image 3: One multi-database availability group replicated through separate links to two Azure SQL managed instances. Preview requirements Requirement Details SQL Server SQL Server 2022 with CU27 or SQL Server 2025 with CU9 and above. Edition Enterprise or Developer edition. Standard edition supports basic availability groups with one database and is not supported for multi-database mode. Azure SQL Managed Instance Use a compatible update policy (2022 or 2025) matching your SQL Server version. SSMS SSMS 22.10.2 or later for the multi-database link capability. Automation Az module 16.3.0 or later and Az.Sql 7.1.0 or later, or the corresponding Azure APIs. Get started To evaluate multi-database mode during preview: Confirm that the SQL Server version, edition, servicing level, and Azure SQL Managed Instance update policy meet the preview requirements. Upgrade to SSMS 22.10.2 or later, or use a supported automation interface. Enable multi-database mode before creating a multi-database link. Create the link from the existing Always On availability group and validate synchronization for every database. Review the Azure documentation for multi-database Managed Instance link configuration, limitations, monitoring, failover, and cleanup guidance. Share your feedback We would love to hear about your experience with multi-database mode. Please share questions, feedback, and feature suggestions through the Managed Instance link feedback form.370Views0likes0CommentsSQLCon is Back: 5 Reasons to Attend the European Microsoft Fabric + SQL Community Conference
5 Reasons to Attend the European Microsoft Fabric + SQL Community Conference This year the SQL community joins Fabric in Europe for the first time at the Microsoft Fabric + SQL Community Conference happening September 28th - October 1st in Barcelona, Spain. Hear the latest announcements and roadmap directly from Microsoft leaders. With a full week of deep technical sessions and workshops covering the topics you care about most across and see how we’re helping solve your most pressing data challenges, from strengthening data sovereignty to powering agentic AI and unlocking trusted, actionable intelligence. And while there’s no shortage of topics, here are a couple of things we’re the most excited about heading to Barcelona: Unify your data (conference) experience With one registration, this event doubles your opportunity to sharpen your skillset with 130+ expert led sessions, workshops, and keynotes coming together in one high- impact week. Mix and match sessions to best meet your learning goals while you move seamlessly across tracks, visit the shared expo, and connect with peers in the community hub, all under one roof. The ultimate SQL experience, like only Microsoft can deliver With more than 25 dedicated SQL sessions, whether you’re a DBA or, a developer building AI apps, you can create your custom agenda with the topics you care about most. Pre-day programming is for the builders; bring your laptop and start your week with any of our full- day SQL workshops for the demos, practical guidance, and repeatable patterns you can start using immediately. Tuesday kicks off the official event with our opening keynote, three corenotes, and general sessions focused on SQL Server 2025, Azure SQL, and SQL in Fabric. Learn the latest in performance, tuning and tools like SSMS and VS Code delivered directly from SQL experts, MVPs, and community leaders. Ready to start building your agenda? Try our new session planner to curate your schedule based on your interests. The backdrop: Barcelona This year’s conference takes place in the historic, vibrant city of Barcelona, set along the Mediterranean Sea, the ideal setting for the first European SQLCon. When you’re ready for a break, you’re only a 15-minute ride away from the city center, perfect for exploring Gaudí’s iconic architecture or enjoying some local bites. Don’t miss the wrap- up celebration taking place in Barcelona’s exclusive Sutton Club. Community Connection SQLCon is more than just sessions; we’re bringing together more than 4,000 of the most dedicated Microsoft community members together for a week of endless connection opportunities. The Community Hub will bring some of our most popular experiences to life, from in-person meetups and user group connections to hands-on learning and certification opportunities all designed to help you grow your skills and expand your network. Launching Soon: SQLCon TV Enjoyed catching all the behind-the-scenes action on FabCon TV? In Barcelona we’ll bring SQLCon TV to the stage, with the content, demos, and interviews every SQL fan will want to see. Save your spot today. The earlier you register, the more opportunities you have to take advantage of early pricing specials. See you in Barcelona!419Views0likes2Comments
Public Preview: Performance monitoring for Azure SQL in Database Hub
We're excited to announce the public preview of performance monitoring for Azure SQL in Database Hub in Fabric. Performance monitoring brings the health and performance of your SQL estate into Database Hub. You see every supported database in one place and quickly spot the ones that need attention. It works across: Azure SQL Database Azure SQL Managed Instance (coming soon) SQL Server on Azure Virtual Machines SQL Server enabled by Azure Arc Microsoft collects performance-related telemetry, runs the pipeline, and stores the data for you. There's nothing you need to deploy and nothing to operate. Turn it on, and your SQL resources show up on the Performance page in Database Hub, which is free. This post is a deep dive on the performance part of Database Hub. For the full tour, including the Overview, Estate, and Security pages, read Database Hub in Fabric: Now in Public Preview. Get started in three steps Open Database Hub in Fabric. During the preview, a Fabric administrator needs to turn on the Database Hub tenant setting. See the prerequisites. Turn on performance monitoring for your SQL resources. See Enable performance monitoring for Microsoft SQL. Go to the Performance page to see which databases need your attention. See your entire database estate in Database Hub Performance monitoring powers the Performance page in Database Hub. Database Hub is built for when you need to look across all your databases, not just one at a time. It brings your database estate across Azure, on-premises, and other clouds into one place, including: Azure SQL and SQL Server enabled by Azure Arc Azure Database for PostgreSQL Azure Cosmos DB The Performance page comes with prebuilt dashboards, so you can see performance at a glance without building anything yourself. The dashboards are designed to quickly answer two questions: Are my databases healthy? Which ones need my attention? From there, you can drill into resource usage, waits, and session activity to understand what's driving a change in performance. With Database Hub, you can: Get estate-wide visibility into health and performance across database types Investigate the root cause of performance issues across many databases Use AI-assisted analysis to find and explain issues faster To learn more, see What is Database Hub in Fabric? Why we built this Monitoring SQL performance at scale often meant building and running your own monitoring stack. Before you could effectively answer, "Which of my databases need attention right now?" you typically had to: Deploy and configure a collection resource, such as a watcher or an agent Build a telemetry pipeline to move the data Provision a data store, and then pay for it, secure it, and keep it running Build dashboards on top of all of it Repeat for every new server, database, or region That's a lot of work before you see your first chart. And every step is another thing that can break, drift, or quietly stop collecting data. Customers are also turning to AI to make sense of their database estate. They want an AI agent that can spot a performance problem, explain what's causing it, and recommend a fix. But an AI agent is only as good as the data it can reach. It operates best with one consistent source of performance data across every database, not a patchwork of tools and data stores. We heard this feedback loud and clear from customers. You told us you love having at-scale dashboards and ownership of your performance data. You also told us that setting up a telemetry stack was time-consuming, scale limits got in the way, and running the data store added operational burden and cost overhead. One customer put it simply: they wanted to spend less time managing their telemetry infrastructure and more time managing and improving their databases. Performance monitoring keeps the parts you valued and removes the infrastructure you had to manage. That's why it feeds Database Hub directly. You get one place to see your whole estate, and your AI agents get one consistent source of performance data. No infrastructure to manage (or pay for) With performance monitoring, there's no monitoring infrastructure for you to deploy, size, or run. It's all managed by Microsoft, with no scale limits on how many targets you can monitor. Telemetry is collected close to the database engine and sent to a Microsoft-managed telemetry pipeline and data store. Access to that data is governed by Azure role-based access control (RBAC), so people only see telemetry for the resources they already have access to. Consistent telemetry across your SQL estate Performance monitoring collects the same core set of performance data across every supported SQL deployment, whether it runs in Azure, on-premises, or in another cloud. That means one mental model and one set of dashboards in Database Hub, instead of a different tool for every flavor of SQL. The preview collects performance-related telemetry, including: CPU and memory utilization Wait statistics Active sessions Storage I/O and database storage utilization Performance counters Client connections Database properties Availability group, replica, and database replica health Go beyond Database Hub with KQL Database Hub covers the most common performance questions. When you need a view that Database Hub doesn't show, you can query the same telemetry directly with Kusto Query Language (KQL). The telemetry is available through a Microsoft-managed, RBAC-governed endpoint, so you don't need to create or pay for your own Azure Data Explorer cluster. Use it to: Build your own Real-Time Dashboards and reports Connect tools you already use, such as Grafana or Power BI Give an AI agent access to investigate performance across your estate To get started, see Query performance monitoring telemetry. It includes the schema, connection steps, and ready-to-run starter queries. Turn on performance monitoring How you turn on performance monitoring depends on the resource type. For all of the steps in one place, see Enable performance monitoring for Microsoft SQL. Resource type How monitoring is enabled in preview Step-by-step guidance Azure SQL Database Add an extended property to each database you want to monitor. You can also select Enable Performance Monitoring in Database Hub. Azure SQL Database Azure SQL Managed Instance (coming soon) Coming soon Coming soon SQL Server on Azure VMs Turn on a feature flag in the SQL IaaS Agent extension. SQL Server on Azure VMs SQL Server enabled by Azure Arc On by default once the server is connected to Azure Arc. SQL Server enabled by Azure Arc To view performance monitoring data, you need: The Reader role, or a role with higher privileges, on each subscription that contains the resources you want to view. The Microsoft.AzureArcData resource provider registered on each subscription. For steps, see Register the Azure resource provider. Availability Performance monitoring is available in public preview in select Azure regions. For the current list of supported regions, see Regional availability and data handling. Learn more Database Hub in Fabric: Now in Public Preview What is Database Hub in Fabric? Enable performance monitoring for Microsoft SQL Query performance monitoring telemetry Supplemental Terms of Use for Microsoft Azure Previews1.8KViews3likes5CommentsStream data in near real time from SQL to Azure Event Hubs - Public preview
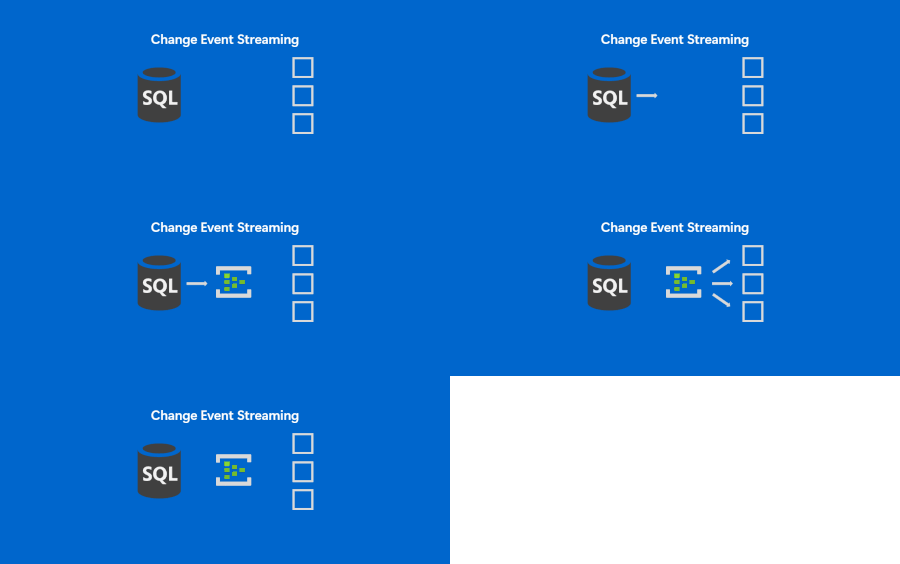
If near-real time integration is something you are looking to implement and you were looking for a simpler way to get the data out of SQL, keep reading. SQL is making it easier to integrate and Change Event Streaming is a feature continuing this trend. Modern applications and analytics platforms increasingly rely on event-driven architectures and real-time data pipelines. As the businesses speed up, real time decisioning is becoming especially important. Traditionally, capturing changes from a relational database requires complex ETL jobs, periodic polling, or third-party tools. These approaches often consume significant cycles of the data source, introduce operational overhead, and pose challenges with scalability, especially if you need one data source to feed into multiple destinations. In this context, we are happy to release Change Event Streaming ("CES") feature into Public Preview for Azure SQL Database. This feature enables you to stream row-level changes - inserts, updates, and deletes - from your database directly to Azure Event Hubs and Fabric Eventstreams in near real time. Change Event Streaming addresses the above challenges by: Reducing latency: Changes are streamed (pushed by SQL) as they happen. This is in contrast with traditional CDC (change data capture) or CT (change tracking) based approaches, where an external component needs to poll SQL at regular intervals. Traditional approaches allow you to increase polling frequency, but it gets difficult to find a sweet spot between minimal latency and minimal overhead due to too frequent polls. Simplifying architecture: No need for Change Data Capture (CDC), Change Tracking, custom polling or external connectors - SQL streams directly to configured destination. This means simpler security profile (fewer authentication points), fewer failure points, easier monitoring, lower skill bar to deploy and run the service. No need to worry about cleanup jobs, etc. SQL keeps track of which changes are successfully received by the destination, handles the retry logic and releases log truncation point. Finally, with CES you have fewer components to procure and get approved for production use. Decoupling: The integration is done on the database level. This eliminates the problem of dual writes - the changes are streamed at transaction boundaries, once your source of truth (the database) has saved the changes. You do not need to modify your app workloads to get the data streamed - you tap right onto the data layer - this is useful if your apps are dated and do not possess real-time integration capabilities. In case of some 3rd party apps, you may not even have an option to do anything other than database level integration, and CES makes it simpler. Also, the publishing database does not concern itself with the final destination for the data - Stream the data once to the common message bus, and you can consume it by multiple downstream systems, irrespective of their number or capacity - the (number of) consumers does not affect publishing load on the SQL side. Serving consumers is handled by the message bus, Azure Event Hubs, which is purpose built for high throughput data transfers. Key Scenarios for CES Event-driven microservices: They need to exchange data, typically thru a common message bus. With CES, you can have automated data publishing from each of the microservices. This allows you to trigger business processes immediately when data changes. Real-time analytics: Stream operational data into platforms like Fabric Real Time Intelligence or Azure Stream Analytics for quick insights. Breaking down the monoliths: Typical monolithic systems with complex schemas, sitting on top of a single database can be broken down one piece at a time: create a new component (typically a microservice), set up the streaming from the relevant tables on the monolith database and tap into the stream by the new components. You can then test run the components, validate the results against the original monolith, and cutover when you build the confidence that the new component is stable. Cache and search index updates: Keep distributed caches and search indexes in sync without custom triggers. Data lake ingestion: Capture changes continuously into storage for incremental processing. Data availability: This is not a scenario per se, but the amount of data you can tap into for business process mining or intelligence in general goes up whenever you plug another database into the message bus. E.g. You plug in your eCommerce system to the message bus to integrate with Shipping providers, and consequently, the same data stream is immediately available for any other systems to tap into. How It Works CES uses transaction log-based capture to stream changes with minimal impact on your workload. Events are published in a structured JSON format following the CloudEvents standard, including operation type, primary key, and before/after values. You can configure CES to target Azure Event Hubs via AMQP or Kafka protocols. For details on configuration, message format, and FAQs, see the official documentation: Feature Overview CES: Frequently Asked Questions Get Started Public preview CES is available today in public preview for Azure SQL Database and as a preview feature in SQL Server 2025. [update 20-Mar-2026] Change Event Streaming is now in public preview for Azure SQL Managed instance. Read more here. [update 3-Aug-2026] Change Event Streaming is now also in public preview for Fabric SQL database. Read more here. We encourage you to try the feature out and start building real-time integrations on top of your existing data. We welcome your feedback—please share your experience through Azure Feedback portal or support channels. The comments below on this blog post will also be monitored, if you want to engage with us. Finally, CES team can be reached via email: sqlcesfeedback [at] microsoft [dot] com. Useful resources Free Azure SQL Database. Free Azure SQL Managed Instance.1.7KViews0likes0CommentsAzure Data Studio Retirement
We’re announcing the upcoming retirement of Azure Data Studio (ADS) on February 6, 2025, as we focus on delivering a modern, streamlined SQL development experience. ADS will remain supported until February 28, 2026, giving developers ample time to transition. This decision aligns with our commitment to simplifying SQL development by consolidating efforts on Visual Studio Code (VS Code) with the MSSQL extension, a powerful and versatile tool designed for modern developers. Why Retire Azure Data Studio? Azure Data Studio has been an essential tool for SQL developers, but evolving developer needs and the rise of more versatile platforms like VS Code have made it the right time to transition. Here’s why: Focus on innovation VS Code, widely adopted across the developer community, provides a robust platform for delivering advanced features like cutting-edge schema management and improved query execution. Streamlined tools Consolidating SQL development on VS Code eliminates duplication, reduces engineering maintenance overhead, and accelerates feature delivery, ensuring developers have access to the latest innovations. Why Transition to Visual Studio Code? VS Code is the #1 developer tool, trusted by millions worldwide. It is a modern, versatile platform that meets the evolving demands of SQL and application developers. By transitioning, you gain access to cutting-edge tools, seamless workflows, and an expansive ecosystem designed to enhance productivity and innovation. We’re committed to meeting developers where they are, providing a modern SQL development experience within VS Code. Here’s how: Modern development environment VS Code is a lightweight, extensible, and community-supported code editor trusted by millions of developers. It provides: Regular updates. An active extension marketplace. A seamless cross-platform experience for Windows, macOS, and Linux. Comprehensive SQL features With the MSSQL extension in VS Code, you can: Execute queries faster with filtering, sorting, and export options for JSON, Excel, and CSV. Manage schemas visually with Table Designer, Object Explorer, and support for keys, indexes, and constraints. Connect to SQL Server, Azure SQL (all offerings), and SQL database in Fabric using an improved Connection Dialog. Streamline development with scripting, object modifications, and a unified SQL experience. Optimize performance with an enhanced Query Results Pane and execution plans. Integrate with DevOps and CI/CD pipelines using SQL Database Projects. Stay tuned for upcoming features—we’re continuously building new experiences based on feedback from the community. Make sure to follow the MSSQL repository on GitHub to stay updated and contribute to the project! Streamlined workflow VS Code supports cloud-native development, real-time collaboration, and thousands of extensions to enhance your workflows. Transitioning to Visual Studio Code: What You Need to Know We understand that transitioning tools can raise concerns, but moving from Azure Data Studio (ADS) to Visual Studio Code (VS Code) with the MSSQL extension is designed to be straightforward and hassle-free. Here’s why you can feel confident about this transition: No Loss of Functionality If you use ADS to connect to Azure SQL databases, SQL Server, or SQL database in Fabric, you’ll find that the MSSQL extension supports these scenarios seamlessly. Your database projects, queries, and scripts created in ADS are fully compatible with VS Code and can be opened without additional migration steps. Familiar features, enhanced experience VS Code provides advanced tools like improved query execution, modern schema management, and CI/CD integration. Additionally, alternative tools and extensions are available to replace ADS capabilities like SQL Server Agent and Schema Compare. Cross-Platform and extensible Like ADS, VS Code runs on Windows, macOS, and Linux, ensuring a consistent experience across operating systems. Its extensibility allows you to adapt it to your workflow with thousands of extensions. If you have further questions or need detailed guidance, visit the ADS Retirement page. The page includes step-by-step instructions, recommended alternatives, and additional resources. Continued Support With the Azure Data Studio retirement, we’re committed to supporting you during this transition: Documentation: Find detailed guides, tutorials, and FAQs on the ADS Retirement page. Community Support: Engage with the active Visual Studio Code community for tips and solutions. You can also explore forums like Stack Overflow. GitHub Issues: If you encounter any issues, submit a request or report bugs on the MSSQL extension’s GitHub repository. Microsoft Support: For critical issues, reach out to Microsoft Support directly through your account. Transitioning to VS Code opens the door to a more modern and versatile SQL development experience. We encourage you to explore the new possibilities and start your journey today! Conclusion Azure Data Studio has served the SQL community well,but the Azure Data Studio retirement marks an opportunity to embrace the modern capabilities of Visual Studio Code. Transitioning now ensures you’re equipped with cutting-edge tools and a future-ready platform to enhance your SQL development experience. For a detailed guide on ADS retirement , visit aka.ms/ads-retirement. To get started with the MSSQL extension, check out the official documentation. We’re excited to see what you build with VS Code!36KViews4likes31CommentsLicense-free DR on Azure SQL Managed Instance for SQL Server
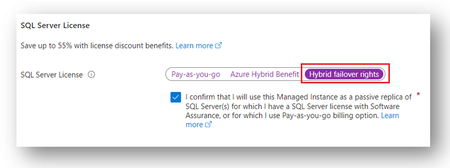
Hybrid failover rights is a new benefit for SQL Server customers using Software Assurance (SA) or Pay-as-you-go billing option, that provides a free license for Azure SQL Managed Instance when it is used as a passive secondary for Disaster Recovery (DR).6.3KViews0likes0CommentsGenerally Available: SQL Migration to SQL Server on Azure Virtual Machines in Azure Architecture
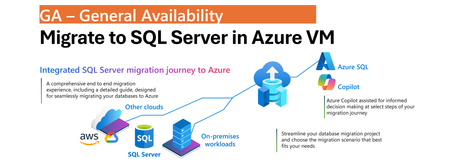
One Migration Experience, More Flexibility Modernizing SQL Server estates is rarely a single-step journey. Organizations often operate across on-premises, hybrid, and cloud environments while balancing application dependencies, operational requirements, and modernization goals. SQL Server migration enabled by Azure Arc simplifies this process by bringing migration activities into a single experience in the Azure portal. With the July 2026 release, we are announcing General Availability of SQL Server on Azure Virtual Machines as a migration target in Azure Arc, allowing customers to have a greater flexibility to choose Azure destination that best aligns with to your needs without introducing additional tools or migration processes. Whether migrating to the fully managed Azure SQL Managed Instance service or to SQL Server running on Azure VMs, the experience remains consistent and familiar. Unified Migration Workflow A key benefit of SQL Server migration enabled by Azure Arc is that the entire migration lifecycle is managed from a single tool in Azure portal. After a SQL Server instance is enabled by Azure Arc, customers can: Assess migration readiness Select a migration target Configure migration settings Monitor migration progress Validate results Perform final cutover All of these activities are performed directly from the Azure portal using a guided workflow designed to simplify migration planning and execution. The prerequisite remains unchanged: source SQL Server instances must be enabled by Azure Arc before migration can begin. The result is a flexible, scalable, and consistent migration experience that supports hybrid realities, reduces operational overhead, and helps customers modernize SQL Server estates at their own pace. Consistent Experience Across Azure SQL Targets Migration to SQL Server on Azure Virtual Machines follows the same operational model already available for Azure SQL Managed Instance migration scenarios. Customers use the same migration dashboard, monitoring experience, and guided workflow regardless of the destination. This consistency reduces learning curves, simplifies operational processes, and enables teams to select the most appropriate Azure SQL platform without changing migration methodology. Online Migration Using Backup and Log Shipping Migration to SQL Server on Azure Virtual Machines uses backup and restore with log shipping to support online migration scenarios while minimizing downtime. The process begins with a full database backup that is restored to the target SQL Server instance running on an Azure Virtual Machine. Transaction log backups that are uploaded continuously by your workflows to Azure Blob Storage are continuously applied to the target database, keeping it closely synchronized with the source environment. Azure Blob Storage serves as the intermediary staging location between source and target systems. To support efficient data movement and restore operations, both the Azure Blob Storage account and the target SQL Server on Azure Virtual Machines must reside in the same Azure region. Within the Azure Arc migration experience, customers select the Azure Blob Storage container that stores the backup files. Azure Arc automatically restores the full backup and continuously applies transaction log backups as they become available. Customers are responsible for configuring and maintaining the continuous upload of transaction log backups to Azure Blob Storage. Customer-Controlled Cutover When the customer is ready to complete migration, upon customer initiated cutover, Azure Arc performs the final synchronization by applying the last uploaded backup and bringing the target database online. This approach gives organizations full control over the migration timeline and cutover window, allowing downtime to be planned according to business requirements while reducing operational complexity. Learn More To learn more about SQL Server migration enabled by Azure Arc, see: Migration Overview For information about migrating to SQL Server in Azure VM, see: Migrate to SQL Server in Azure VM1.1KViews0likes1Comment