siem
616 Topics
Building Microsoft Sentinel Connectors in Minutes with the Sentinel Connector Builder Agent
Overview We previously announced the public preview of the Microsoft Sentinel connector builder agent via VS code extension, that helps developers build Microsoft Sentinel codeless connectors faster with low-code and AI-assisted prompts. This post walks through a hands-on lab using a mock Network Log API to demonstrate how the Sentinel connector builder agent simplifies building Codeless Connector Framework (CCF) pull connectors. Instead of manually creating ingestion infrastructure and configuration files, you’ll use a guided, conversational workflow in VS Code to generate connector artifacts, test them against a live API, and deploy them into Microsoft Sentinel. The lab focuses on the end-to-end experience ranging from API setup to validated connector deployment so you can see how quickly a working integration can be produced. For additional guidance beyond this lab, refer to our MS Learn documentation. The Lab Environment This lab is built around a mock Network Log API hosted as an Azure Function App. The purpose of the lab environment is to give us a live API that we can use to build, validate, and test the Sentinel CCF connector builder agent against end to end. The API exposes 50 synthetic network activity records that look and behave like a real product data source, including web traffic, DNS requests, blocked remote access attempts, malware command-and-control blocks, VPN activity, and other common network events. That makes it a useful stand-in for the type of telemetry many teams want to onboard into Microsoft Sentinel. The API is intentionally shaped like the kind of source a customer might expose for telemetry retrieval. It uses API key authentication through the X-API-Key header, returns paginated results through a nextLink model, and provides a predictable response structure that the builder agent can map into a pull connector configuration. The repo contains everything needed for the walkthrough. There is an ARM template to deploy the Function App, reference documentation for the API, and a sample connector package showing the generated polling config, table schema, DCR, and connector definition. The end goal of the lab is straightforward: use the builder agent to generate a CCF pull connector that ingests this API into the custom NetworkLogAPIGetNetworkLogs_CL table in Sentinel. Prerequisites Before starting, make sure you have the following: Azure subscription -- with Contributor access on a resource group (for deploying the Function App) and Microsoft Sentinel Contributor access on a Sentinel-enabled workspace (for deploying the connector) Microsoft Sentinel workspace -- an existing Log Analytics workspace with Sentinel enabled. See Onboard Microsoft Sentinel to a Log Analytics workspace for more information. Azure CLI -- See How to install the Azure CLI for more information. VS Code with the Microsoft Sentinel for Visual Studio Code extension installed. GitHub Copilot -- with access to premium models. The connector builder agent requires Claude Sonnet 4.5 or 4.6, which uses Copilot premium model credits. Lab Repository -- Once the aforementioned prerequisites are met, you can access the lab repository here: Azure-Sentinel/Tools/CCF-Connector-Builder-Agent-Accelerator at master · Azure/Azure-Sentinel Deploying the Mock API The full CLI commands for this section are available in the repo. For a simpler option, you can use GitHub Copilot to handle the deployment. Enter this prompt: Follow the deployment instructions in Sentinel-CCF-Pull-Connector-Builder-Agent-Accelerator/agent-instructions.md. Let’s deploy the Network Log API and build a CCF pull connector. At a high level, the setup is four steps: clone the repo, create a resource group, ensure you have a Sentinel-enabled workspace, and deploy the Function App using the included ARM template. The template takes two parameters: an ApiKey of your choice (the secret the CCF connector will use to authenticate) and your Log Analytics workspace resource ID for Application Insights. Deployment takes about two to three minutes and outputs the FunctionAppName and endpoint URLs you will need later. Once deployed, verify the API is live: curl -s -H "X-API-Key: <your-api-key>" \ "https://<functionappname>.azurewebsites.net/api/GetNetworkLogs?page=1&pageSize=3" </functionappname></your-api-key> You should see a response like this: The API also exposes an /api/RefreshData endpoint that regenerates the 50 sample records with fresh timestamps. This is useful later in the walkthrough when you want to produce new events and trigger an immediate ingestion cycle without waiting for the next polling interval: curl -s -X POST -H "X-API-Key: <your-api-key>" \ "https://<functionappname>.azurewebsites.net/api/RefreshData" </functionappname></your-api-key> Building the Connector with the Sentinel Connector Builder Agent With the Microsoft Sentinel extension installed and GitHub Copilot running in agent mode, open a Copilot chat and enter a single prompt pointing at the API documentation file: That is the entire invocation. The agent takes it from there. It works through a structured seven-step sequence: preparation, polling config, table schema, DCR, connector definition, package validation, and summary. The agent produces four files in a sentinel-connectors/NetworkLogAPI_CCF/ output folder: NetworkLogAPI_PollingConfig.json – This is the API poller configuration. The agent reads the documentation and correctly identifies the GET /api/GetNetworkLogs endpoint, configures API Key authentication via the X-API-Key header, sets up NextPageUrl pagination using $.metadata.nextLink with a $.metadata.hasNextPage stop condition, and wires up the since query parameter for incremental delta pulls using the timestamp field. The RefreshData endpoint is correctly excluded, which the agent recognizes as a maintenance operation, not a security data stream. NetworkLogAPI_Table.json – This is the custom Log Analytics table schema for NetworkLogAPIGetNetworkLogs_CL . All 20 fields from the API response are mapped to the correct column types, with timestamp promoted to TimeGenerated as the standard Sentinel time column. NetworkLogAPI_DCR.json – This is the Data Collection Rule. This defines the stream declaration, the workspace destination, and the KQL transform that maps the raw snake_case API fields ( sourceIp , destinationIp , threatIndicator , etc.) to their PascalCase table columns. NetworkLogAPI_ConnectorDefinition.json – This is the connector UI configuration. This drives what the connector page looks like in Microsoft Sentinel: the title, description, prerequisite instructions, the BaseUrl and ApiKey input fields, sample KQL queries, and the connectivity status logic. The only point where the agent paused for input was to propose a connector description and ask for confirmation before writing it to the file. Everything else such as endpoint selection, auth type, pagination pattern, schema mapping, KQL transform, cross-file consistency was selected autonomously. To put that in perspective: without the agent, a developer building this connector from scratch would need to manually author four JSON files, understand the CCF schema for polling configs, DCRs, and connector definitions, write the KQL transform by hand, and validate that every cross-file reference lines up correctly. The agent compresses that work, typically hours of reading documentation, trial-and-error, and portal debugging, into a single prompt. Testing the Connector Before deploying anything to a Sentinel workspace, the Microsoft Sentinel connector builder agent lets you validate the generated polling config against the live API directly from your editor. Right-click the sentinel-connectors/NetworkLogAPI_CCF folder, select Microsoft Sentinel → Test Connector (Preview), and a Configuration Variables panel opens asking for the two template variables from the polling config: BaseUrl and apiKey . For other API patterns, there may be additional and different inputs. For example, apiKey input could be swapped with clientID and secret if the API supports OAUTH. Enter the Function App base URL and your API key, and the test runner connects immediately. The panel shows a live polling session. Poll #1 returns HTTP 200 with 50 events, and a countdown timer shows when the next poll will fire. Switching to the Events tab displays the ingested records in a tabular view with columns for timestamp , severity , action , bytesIn , bytesOut , category , and the rest of the mapped fields fresh from the API. Additionally, there are tabs for Headers, Payload, and Response, which can be useful for verifying that your pollerconfig.json configuration provides the expected request to your api with a working response. Data Extracted: The Test Connector feature can be used to visualize the response data in a table format to verify that data will land in a Sentinel table based on your configuration. Request from Poller: The Test Connector feature can be used to validate the request and response headers that will go out to the API based on the generated poller configuration. Request Response: The Test Connector feature shows you the live response from the API with respect to the request going to the API based on the poller configuration. This is a meaningful pre-flight check. It confirms that auth is working, the $.data events path resolves correctly, pagination is functional, and the polling interval fires as configured all before a single file is deployed to Azure. The most common connector configuration issues (wrong base URL, incorrect header name, mismatched JSON path) surface here in seconds rather than after a failed deployment and a 20-minute wait for Sentinel to attempt its first ingestion cycle. It is also the fastest way to troubleshoot if something goes wrong after deployment, far quicker than pushing changes to Azure and waiting for the connector to poll again. Deploying and Enabling the Connector With the connector tested and passing, deployment is the same right-click menu: right-click the sentinel-connectors/NetworkLogAPI_CCF folder, select Microsoft Sentinel → Deploy Connector (Preview). If you are not already signed in to Azure, the extension will prompt you to authenticate. The agent will also provide a clickbox in the chat window to invoke a connector deployment. Right Click Deploy Connector: UI Prompt Based Deploy Method: Once signed in, a workspace picker lists all available Log Analytics workspaces across your subscriptions. Select the one with Sentinel enabled and click Deploy. The extension deploys all four files to the workspace in the correct order: table schema first, then DCR, polling config, and connector definition. Once deployed, navigate to your Sentinel workspace via https://security.microsoft.com, go to Data Connectors, and find the Network Log API connector. The connector page shows the description, prerequisite notes, and the two credential fields generated by the agent: API Base URL and API Key. Enter your Function App base URL and API key and click Connect. The status updates to show the connector is connected and the deployment succeeded. Note: Data will appear in the workspace within 5 to 30 minutes depending on the polling interval. Run this query in Log Analytics to confirm ingestion. Note that the agent derives the table name from the vendor name and endpoint, so yours may differ slightly from the example below. Check the agent's summary output or the NetworkLogAPI_Table.json file for the exact name: NetworkLogAPIGetNetworkLogs_CL | sort by TimeGenerated desc | take 10 If you want to generate a fresh batch of events immediately rather than waiting for the next polling cycle, use the RefreshData endpoint to reset the sample records with new timestamps: curl -s -X POST -H "X-API-Key: " \ "https://.azurewebsites.net/api/RefreshData" Next Steps If you want to go further: Try it with your own API. The lab repo includes documentation on adapting the polling config, schema, and KQL transform to a real data source. Review the CCF connector schema documentation to understand the full range of supported configurations: pagination patterns, auth types, incremental pull strategies, and delta filter expressions. Explore the Microsoft Sentinel content hub to see how published connectors are structured and what the certification requirements look like for production submissions. Conclusion Following these steps, you saw how a working Sentinel connector can be generated, tested, and deployed in minutes rather than requiring days of manual configuration and infrastructure setup. If you are an ISV building a Sentinel integration and want hands-on support, Microsoft’s App Assure program is available to help. We partner with ISVs on connector development, validation, and deployment and provide guidance through implementation, testing, and readiness for production. You can get started by reaching out through our intake form. See our other Sentinel connector feature’s hands-on labs Building a CCF Nested API Pull Connector: A Technical Lab Walkthrough660Views0likes0CommentsHunting AI Agent Configuration Drift with Microsoft Sentinel
Four KQL patterns for detecting instruction changes, new MCP servers, ownership changes, and organization-wide sharing I recently authored and contributed four new Microsoft Sentinel hunting queries for detecting security-relevant configuration drift in AI agents. They have been reviewed, approved, and merged into Microsoft's public Azure-Sentinel repository. I built the queries around four changes that can materially affect an agent's behavior, access, or exposure: instructions being modified, MCP servers being connected, owners being added, and sharing being expanded to the entire organization. Each modification may be legitimate, but each deserves enough context for a security team to verify that it was expected and authorized. For a security operations team, the difficult question is often not what does this agent look like now? It is what changed since the last known state? Microsoft Sentinel's AgentsInfo table provides inventory-style snapshots of AI agents and their associated configuration. That makes it useful for more than posture reporting. By comparing a recent snapshot with an earlier baseline, we can hunt for configuration drift that deserves investigation. This post walks through four practical hunting scenarios: Instructions changed on a previously published agent A newly observed MCP server on an existing agent An owner added to an MCP-enabled agent Sharing expanded from a restricted scope to the entire organization The complete hunting queries are available in Microsoft's public https://github.com/Azure/Azure-Sentinel/tree/master/Hunting%20Queries/AI%20Agents. The focus here is the detection design behind them, the KQL patterns they share, and the investigation questions they help answer. What I contributed I wrote the four standalone hunting queries discussed in this article and submitted them to Azure/Azure-Sentinel in https://github.com/Azure/Azure-Sentinel/pull/14702: AI Agents - Instructions changed on previously published agent AI Agents - Newly observed MCP server on existing agent AI Agents - Owner added to MCP-enabled agent AI Agents - Sharing expanded to organization-wide The contribution went through several rounds of technical review. Across six commits, I aligned the queries with the unified AgentsInfo schema, added schema-tolerant IdentityInfo enrichment, improved entity mappings, bounded the identity lookback, expanded all owner values, and kept the ATT&CK mappings limited to scenarios where a precise technique could be defended. Repository collaborator v-atulyadav approved the final revision, and the four queries were merged into master on July 20, 2026. This article explains the detection logic and engineering decisions behind that contribution rather than simply reproducing the final YAML files. Why current-state queries are not enough A current-state query can answer questions such as: Which agents are published? Which agents have MCP servers configured? Which agents are shared with the organization? Who owns a particular agent? Those are important posture questions, but they do not tell us whether the state is new. An agent with an MCP server might have been reviewed and approved months ago. The same MCP server appearing for the first time today is a different security signal. Configuration-drift hunting adds the missing time dimension. Instead of treating a risky-looking property as an event, it compares two states of the same agent and reports only meaningful transitions. The common detection pattern I used the same basic time model across all four hunts: let lookback = 14d; let recent = 2d; The latest snapshot observed during the last two days becomes the current state. The latest snapshot from the preceding portion of the 14-day lookback becomes the baseline. Conceptually, the comparison looks like this: let CurrentState = AgentsInfo | where Timestamp > ago(recent) | summarize arg_max(Timestamp, *) by AgentId | where LifecycleStatus != "Deleted"; let BaselineState = AgentsInfo | where Timestamp between (ago(lookback) .. ago(recent)) | where LifecycleStatus != "Deleted" | summarize arg_max(Timestamp, *) by AgentId; CurrentState | join kind=inner BaselineState on AgentId Several details matter here: arg_max(Timestamp, *) by AgentId selects the latest available state for each agent in the relevant time range. The inner join restricts results to agents that exist in both periods. A newly created agent is therefore not automatically treated as configuration drift on an existing agent. Deleted lifecycle snapshots are excluded so that a deletion record does not become the effective baseline or current configuration. The two-day current window is operationally significant. To retain coverage, these hunts should run within two days of a change. The 14-day and two-day values are practical defaults, not universal constants. Environments with different ingestion cadence or retention requirements can adjust them, but the current and baseline windows must remain non-overlapping. Scenario 1: Instructions changed on a published agent An agent's instructions define its default behavior, persona, and operating boundaries. Changing them can be part of normal development, but it can also weaken restrictions, redirect the agent's behavior, or modify how it uses connected capabilities. The first hunt compares the current and previous instruction values only when the agent was published in both snapshots: CurrentState | join kind=inner BaselineState on AgentId | where CurrentInstructions != PreviousInstructions | extend PreviousInstructionsHash = hash_sha256(PreviousInstructions), CurrentInstructionsHash = hash_sha256(CurrentInstructions), InstructionsLengthDelta = strlen(CurrentInstructions) - strlen(PreviousInstructions) I deliberately chose to expose hashes and a length delta rather than returning both instruction bodies in plaintext. This confirms that a change occurred without unnecessarily spreading potentially sensitive prompts through query results, exports, or screenshots. Useful investigation questions include: Was the change associated with an approved development or release process? Did the agent remain published while the instructions changed? Were guardrails, declared tools, permissions, or sharing settings modified around the same time? Do audit records identify an expected actor and change path? The query maps well to an integrity-focused investigation. Its MITRE ATT&CK mapping is T1565.001 (Stored Data Manipulation), but the result is still a hunting lead rather than proof of malicious manipulation. https://github.com/Azure/Azure-Sentinel/blob/master/Hunting%20Queries/AI%20Agents/AgentsInfoInstructionsChangedOnPublishedAgent.yaml Scenario 2: A newly observed MCP server Model Context Protocol servers can extend an agent with external tools, data sources, or actions. From a defender's perspective, the important transition is not simply that an MCP server exists. It is that a server name appears in the current configuration but was absent from the baseline. The query expands the dynamic McpServers array and builds a set of server names for each agent: let CurrentMcp = CurrentRaw | mv-expand Mcp = McpServers | extend McpName = tostring(Mcp.name) | where isnotempty(McpName) | summarize CurrentMcpServers = make_set(McpName) by AgentI It performs the same normalization for the baseline, then calculates the difference: | extend AddedMcpServers = set_difference(CurrentMcpServers, BaselineMcpServers) | where array_length(AddedMcpServers) > 0 Using set_difference() avoids raising a result merely because the order of array elements changed. The hunt reports only MCP server names present in the current set and absent from the previous set. An analyst should validate more than the displayed name: Is the MCP integration part of the approved inventory? What endpoint, authentication method, and permissions are associated with it? Which tools or data can the server expose to the agent? Was the integration introduced through an expected deployment path? Did ownership, instructions, or sharing change in the same period? I did not assign an ATT&CK technique to this query. Adding an MCP server does not, by itself, prove command execution, persistence, or a specific attacker behavior. Avoiding an overly broad mapping keeps the signal honest. https://github.com/Azure/Azure-Sentinel/blob/master/Hunting%20Queries/AI%20Agents/AgentsInfoNewlyObservedMcpServer.yaml Scenario 3: An owner added to an MCP-enabled agent Ownership is a control-plane relationship. A newly added owner may be able to modify an agent's configuration, instructions, integrations, or publication state. The risk becomes more interesting when the agent already has MCP servers configured. The hunt first limits the current state to MCP-enabled agents: | where array_length(coalesce(McpServers, dynamic([]))) > 0 | project AgentId, Timestamp, Name, Platform, CreatedDateTime, CurrentOwners = coalesce(Owners, dynamic([])), McpServers It then compares the owner arrays as sets: | extend AddedOwners = set_difference(CurrentOwners, PreviousOwners) | where array_length(AddedOwners) > 0 | mv-expand AddedOwnerId = AddedOwners to typeof(string) Expanding AddedOwners produces one row per newly observed owner. This is more useful than returning one opaque dynamic array because every added identity can be enriched, mapped, and investigated independently. I kept the raw object identifier in the result even when identity enrichment fails: | extend AddedOwnerUpn = AccountUpn, UnresolvedAddedOwnerId = iff(isempty(AccountUpn), AddedOwnerId, "") That fallback matters. A missing UPN should not hide the underlying ownership change. Investigation should establish: Is the added owner an expected person, service identity, or administrative group? Does the identity's role and business function justify control of this agent? Was the owner added before other configuration changes? Does the identity appear in related sign-in, audit, or privileged-access activity? Should ownership be removed while the change is reviewed? This query maps to T1098 (Account Manipulation) under Persistence and Privilege Escalation. As with the instruction-change hunt, the mapping frames an investigation hypothesis; it does not label every ownership change as malicious. https://github.com/Azure/Azure-Sentinel/blob/master/Hunting%20Queries/AI%20Agents/AgentsInfoOwnerAddedToMcpAgent.yaml Scenario 4: Sharing expanded to the entire organization An agent can move from a limited audience to organization-wide availability without changing its underlying tools or instructions. That transition can materially increase exposure, especially when the agent has MCP integrations or declared tools. The hunt treats "*" in SharedWith as the organization-wide state. The current snapshot must contain it, while the baseline must not: // Current state | where set_has_element(coalesce(SharedWith, dynamic([])), "*") // Baseline state | where not(set_has_element(coalesce(SharedWith, dynamic([])), "*")) The result also counts MCP servers and declared tools: | extend McpServerCount = array_length(coalesce(McpServers, dynamic([]))), DeclaredToolCount = array_length(coalesce(DeclaredTools, dynamic([]))) | extend HasElevatedCapabilities = McpServerCount > 0 or DeclaredToolCount > 0 | sort by HasElevatedCapabilities desc, Timestamp desc I use HasElevatedCapabilities as a prioritization field, not a verdict. It brings agents with connected capabilities to the top of the result set so analysts can review the potentially larger blast radius first. Questions for triage include: Was organization-wide publication explicitly approved? Is the agent intended for every user, or was a group-based scope expected? What data sources, tools, and MCP servers can organization-wide users reach through it? Do the instructions contain assumptions that were safe only for a restricted audience? Were access reviews or user-acceptance tests completed before the expansion? No ATT&CK mapping is assigned because a broader sharing scope is a security-relevant exposure change, but not a sufficiently precise adversary technique on its own. https://github.com/Azure/Azure-Sentinel/blob/master/Hunting%20Queries/AI%20Agents/AgentsInfoSharingExpandedToOrgWide.yaml Resolving owners without making the hunt schema-fragile The Owners field contains identifiers. Human-readable identity context makes results easier to triage, and entity mappings make those identities more useful in Sentinel investigations. I built a small, materialized IdentityInfo lookup that is shared by the four hunts: let IdentityIdtoUPN = materialize( IdentityInfo | extend ResolvedAccountUpn = tostring( column_ifexists("AccountUpn", column_ifexists("AccountUPN", ""))), IdentityTimestamp = todatetime( column_ifexists("Timestamp", column_ifexists("TimeGenerated", datetime(null)))) | where IdentityTimestamp >= ago(lookback) | where isnotempty(AccountObjectId) and isnotempty(ResolvedAccountUpn) | summarize arg_max(IdentityTimestamp, ResolvedAccountUpn) by AccountObjectId | project AccountObjectId = tostring(AccountObjectId), AccountUpn = ResolvedAccountUpn); There are three design choices worth noting: column_ifexists() accommodates observed IdentityInfo naming variants without maintaining separate query versions. The lookup is bounded by the same lookback period instead of scanning unbounded identity history. arg_max() keeps the latest usable identity record for each object ID. After enrichment, the queries map the account using the UPN components and the Entra object ID: entityMappings: - entityType: Account fieldMappings: - identifier: Name columnName: OwnerAccountName - identifier: UPNSuffix columnName: OwnerAccountUPNSuffix - identifier: AadUserId columnName: OwnerId The strong AadUserId identifier remains valuable even when display information changes. Microsoft Sentinel can use mapped entities in bookmarks and investigation experiences, so mapping the changed owner is more than cosmetic enrichment. Turning a result into an investigation These queries intentionally stop at the configuration transition. AgentsInfo tells us that two snapshots differ; it does not necessarily tell us who performed the change, through which interface, or whether the action was authorized. A practical investigation workflow is: Confirm that the two snapshots represent the expected agent and time period. Review the exact changed property and the agent's current capabilities. Identify the owner or newly added owner through IdentityInfo and Entra ID context. Correlate the transition with the relevant audit source for actor attribution. Check for related changes to permissions, tools, data sources, publication state, and sharing. Validate the change against an approved request, release, or ownership process. Restrict, unpublish, or revert the agent if the exposure cannot be justified. Expected changes can still be useful findings. Repeated legitimate results may reveal that a deployment process lacks a stable change window, that ownership is managed through noisy automation, or that the hunt's timing needs to be aligned with release activity. Tuning the hunts for your environment Before operational use, consider the following adjustments: Run cadence: Execute within the two-day current window. A daily cadence provides overlap without blending current and baseline periods. Lookback: Increase the 14-day lookback only if snapshot history and query cost support it. A longer lookback does not compensate for missing the current window. Known change windows: Add watchlists or environment-specific suppression logic for well-controlled automated deployments, while retaining enough context to audit the change. Agent scope: Filter by platform, business unit, agent naming convention, or owner if different teams require separate triage queues. Risk prioritization: Raise agents with sensitive declared data sources, powerful tools, privileged owners, or broad availability to the top of the result set. Audit correlation: Keep attribution logic separate unless the audit source and join keys are stable in your environment. This makes the configuration-drift hunt reusable while allowing each organization to attach its own control-plane evidence. Test with representative snapshots before treating any hunt as an operational control. In particular, validate array shapes for Owners, McpServers, and SharedWith, confirm the identity fields present in your workspace, and exercise both changed and unchanged states. Using the queries The four YAML definitions have been merged into the Hunting Queries/AI Agents folder of Microsoft's Azure-Sentinel repository. Each file contains the complete KQL, description, entity mappings, and ATT&CK mappings where a precise technique applies. https://github.com/Azure/Azure-Sentinel/blob/master/Hunting%20Queries/AI%20Agents/AgentsInfoInstructionsChangedOnPublishedAgent.yaml https://github.com/Azure/Azure-Sentinel/blob/master/Hunting%20Queries/AI%20Agents/AgentsInfoNewlyObservedMcpServer.yaml https://github.com/Azure/Azure-Sentinel/blob/master/Hunting%20Queries/AI%20Agents/AgentsInfoOwnerAddedToMcpAgent.yaml https://github.com/Azure/Azure-Sentinel/blob/master/Hunting%20Queries/AI%20Agents/AgentsInfoSharingExpandedToOrgWide.yaml The broader pattern is reusable beyond these four scenarios: select a stable current snapshot, select a non-overlapping baseline, normalize dynamic properties into comparable sets, calculate the transition, and enrich only after the drift has been identified. That keeps the core detection explainable and gives the analyst the before-and-after context needed for a defensible investigation. References https://learn.microsoft.com/en-us/azure/azure-monitor/reference/tables/agentsinfo https://learn.microsoft.com/en-us/azure/azure-monitor/reference/queries/agentsinfo https://learn.microsoft.com/en-us/azure/azure-monitor/reference/tables/identityinfo https://learn.microsoft.com/en-us/azure/sentinel/entities-reference https://github.com/Azure/Azure-Sentinel/pull/14702 I authored the four hunting queries discussed in this article and contributed them to Microsoft's Azure-Sentinel repository as https://github.com/Azure/Azure-Sentinel/pull/14702. The complete implementations and review history are publicly available through the links above.383Views1like2CommentsSentinel - Defender XDR KQL Queries Library
Hello all, I’ve been building something over the past few weeks that I think the security community might find useful. https://goxdr.fyi is a searchable KQL query library for Microsoft Sentinel and Defender XDR. The name comes from a nickname my colleagues gave me (GoX) combined with XDR. I also picked up https://goxdr.fyi as a short and easy to remember domain for it. You can check it out here: https://goxdr.fyi The idea came from my own day to day work as someone working in IAM and SOC operations. I constantly find myself writing and refining KQL queries for threat hunting, detection engineering and incident investigation. Over time I realized I had a growing collection of queries that I kept going back to and I thought why not make these available to others? It currently has 117 queries covering identity security, BEC/AiTM detection, NTLM and LDAP attack hunting, OAuth governance, AI/Copilot security, Sentinel alert trending, SOC performance metrics and more. Some of these queries are ones I wrote from scratch based on real scenarios I encountered in production environments. Others are community queries I tested and validated in my own setup. Only the ones I found genuinely useful and that actually worked against real data made it in. Each query comes with a description explaining what it detects and why it matters, along with severity levels, platform tags (Sentinel, XDR or both) and a copy button so you can paste it directly into Advanced Hunting or use it as the basis for an Analytics Rule. The site is open source, hosted on GitHub Pages and licensed under CC BY 4.0. No sign-up, no paywall, no tracking. The source is available. I’ll keep adding queries as new scenarios come up. If there’s enough interest I’m also considering adding Cortex XQL queries for Palo Alto environments. Suggestions, feedback or ideas for new detections are always welcome. Feel free to reach out. Thanks100Views0likes0Comments
Looking for a simple deployment guide
MS Learn is a great starting point, but it just doesn't seem to cover the steps needed to get up and running safely. I have concerns about adding or setting something that suddenly creates a vulnerability or exposure. Where is the installation guide that installs and configures the solution then tells you, "You are now protected". Do I really want to set my own policies? Why aren't the default set of rules good enough, safe enough. I can't have a solution that is so complicated I need to hire a team to manage it 24 hours a day. I am okay investigating an alert and helping a user solve a pop-up question. Why is every major corporation around the world required to re-invent the same or similar policies the company next door is creating to make this tool work? I want to onboard all of our Intune devices and monitor anything that CAN'T be stopped by default security measures. Just the fact that Sentinel appears to be changing as an embedded tool within Defender gives me hope that this will be getting closer to a more manageable tool. But that still seems a way off. I am ready to do the reading and research to get this set up but I am hoping for a guide that is specific enough to achieve a final result. Thank for understanding my challenges here.151Views1like2CommentsWhat’s new in Microsoft Sentinel: June 2026
Welcome back to What's new in Microsoft Sentinel. In June, Sentinel SIEM’s Advanced Security Information Model (ASIM) broadens its normalization, so one analytic rule can reach more sources with less per-source work and, additionally, two new ASIM schemas can now bring asset inventory and AI agent telemetry into common form. In Microsoft Sentinel data lake, the Agent Identities Asset Connector adds the identity context behind your AI agents, helping you see who owns an agent and what permissions it holds. In Sentinel MCP, graph tools help security teams investigate threats and optimize security coverage by visualizing relationships across identities, devices, alerts, and signals in a unified graph experience. Read on for the details, and explore the resources at the end to go deeper. Sentinel innovations: Sentinel SIEM Sentinel data lake Sentinel MCP Microsoft Security Store Sentinel SIEM Advanced Security Information Model (ASIM) parsers and schemas [Generally available] The Advanced Security Information Model (ASIM) in Sentinel normalizes logs into common schemas, so one analytic rule can cover many sources without managing each native schema. ASIM coverage has expanded across more Azure services, broader AWS CloudTrail activity, and a range of third-party firewall, identity, and proxy products, so your detections reach more of your environment with less per-source work. Two schemas also join ASIM: Asset Entities normalizes asset inventory so you can correlate files and assets across investigations, and AI Agent Events normalizes telemetry from AI-driven workflows and autonomous agents. Browse the ASIM parsers on GitHub to explore, file issues, or contribute. Learn more in our blog. Sentinel transition to Defender blog series By March 31, 2027, all Microsoft Sentinel customers transition to Defender. This six-part series guides you through moving your Sentinel experience from the Azure portal to Defender, where SIEM, XDR, threat intelligence, AI, and automation come together in one experience. Your analytics rules, playbooks, workbooks, log analytics workspace, and access assignments all carry forward while the operational layer becomes more connected and intelligent. Starting early matters because you realize the benefits sooner, including a unified incident queue, cross-product correlation, Security Copilot, Sentinel data lake, and SOC optimization. Across the six-part blog series you get 1) the strategic shift, 2) the anatomy of incident and data changes, 3) detection and automation, 4) the governance shift across roles and access, 5) a readiness playbook with the adoption helper and cost guidance, and 6) a look at the AI-first SOC. Each part stands alone, so you can read in order or jump to what matters most to you. Sentinel data lake Agent Identities Asset Connector [Public preview] The Agent Identities Asset Connector brings identity context for AI agents into Sentinel. Activity connectors like Agent 365 and Microsoft 365 Copilot already show you what AI agents do, but activity alone cannot tell you who owns an agent, what permissions it holds, or how it is governed. This connector fills that gap with four asset tables covering agent owners, agent identities, agent blueprints, and the service principals tied to those blueprints. Together they form a connected agent identity graph you can trace from owner to identity to blueprint to permissions to the resources an agent touches. Joining this asset data with activity data in Sentinel data lake lets you detect anomalous behavior relative to permissions, spot over-permissioned or misconfigured agents, and follow full execution chains for end-to-end traceability. To get started, install the Agent 365 and Microsoft 365 Copilot solutions in Content Hub and enable the asset and activity connectors. Learn more. Sentinel MCP Sentinel MCP graph tools [Public preview] Microsoft Security Graph MCP tools, recently introduced in the Microsoft Sentinel MCP Server data exploration collection helps security teams investigate threats by exploring relationships between identities and device assets, and threat and activity signals ingested by data connectors and surfaced by analytic rules. Starting from an alert, analysts can follow the exposure path across connected entities — tracing lateral movement, understanding blast radius, and identifying configuration gaps — all from a single, interactive workspace. The tool provides a clear graph view that highlights dependencies and makes it easier to understand how content interacts across your environment. This helps security teams assess coverage, optimize content deployment, and identify areas that may need tuning or additional data sources. Executing graph queries via the MCP tools will trigger the graph meter. Learn more. Microsoft Security Store Partner testimonials from Adaquest and Glueckkanja For partners like Adaquest and Glueckkanja, the Microsoft Security Store helps not only put their years of knowledge, understanding, and best practices into a scalable, packaged solution, it gives them the ability to democratize that expertise and take it to market globally. Security Store operationalizes their expertise as always-on defenses — discoverable, deployable, and driving real outcomes inside the tools that security teams rely on every day. See how the Security Store is helping security teams act on threats faster with the right solutions and to be ready when it matters most: Watch: Adaquest unlocks faster response times for customers (testimonial) Watch: Glueckkanja builds agents with purpose (testimonial) Additional resources Blogs and documentation: The Advanced Security Information Model (ASIM) Process Event normalization schema reference How BlueVoyant's ASIM-First Strategy Simplifies Threat Detection in Microsoft Sentinel Migrate Sentinel to Defender – Why It Is a Security Architecture Decision, Not Just a Portal Change Connect Microsoft Sentinel to the Microsoft Defender portal Agent 365 connector: Monitor, hunt, and investigate AI agent activity in Microsoft Sentinel Get started with Microsoft Sentinel MCP server Upcoming webinars and events: July 15–16: Microsoft Virtual Training Day: Predict and Defend Against Cybersecurity Threats July 22: Microsoft Security Immersion Event: Shadow Hunter July 23-24: Microsoft Virtual Training Day: Introduction to Microsoft Security July 28: Tech Brief: Modernize security operations with a unified platform July 29: Security Immersion Event: Into the Breach Stay connected Check back each month for the latest innovations, updates, and events to ensure you’re getting the most out of Microsoft Sentinel. We’ll see you in the next edition!878Views2likes0CommentsReminder: Next Tuesday 6/23 at 9AM PST we will be hosting an 'Ask Microsoft Anything' session on Tech Community for the Sentinel SIEM Migration Experience!
Join us for a live demo and AMA on the Microsoft Sentinel SIEM migration experience. We’ll show how the experience helps teams move from legacy SIEMs like Splunk and QRadar into Microsoft Sentinel with a more guided, lower-friction path. We’ll cover what it does today, how it works, and the questions customers ask most, then open it up for live Q&A. Link here: Ask Microsoft Anything: The Microsoft Sentinel SIEM Migration Experience Hope to see you there!52Views0likes0CommentsCampaign-Centric Hunting with Microsoft Defender XDR and Microsoft Sentinel
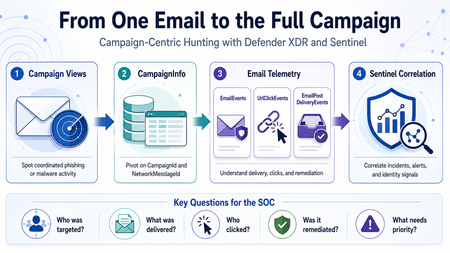
Phishing investigations usually start with one suspicious email. A user reports a message. An alert is generated. An analyst opens the email details, checks the sender, reviews the URL, and tries to understand whether the message is malicious. That is a normal starting point. However, in a real SOC investigation, one email is rarely the full story. Attackers usually operate in campaigns. They reuse sender infrastructure, similar subjects, URLs, payloads, templates, and delivery techniques. A single email may be only one part of a wider phishing or malware campaign targeting multiple users. This is why campaign-centric hunting is important. I wrote this article from the perspective of a SOC analyst who often needs to move quickly from a single suspicious email to the full campaign impact. The goal is simple: use Microsoft Defender XDR and Microsoft Sentinel together to understand who was targeted, what was delivered, who clicked, and what should be prioritized first. Why Campaign-Centric Hunting When investigating a phishing or malware email, analysts usually need to answer practical questions: How many users received messages from the same campaign? Were the messages blocked, junked, delivered, or remediated? Did any user click the URL? Did anyone click through a Safe Links warning? Were any priority or high-risk users affected? Was the email removed after delivery? Are there related Defender XDR or Sentinel incidents? If we only investigate one message, we may miss the bigger picture. Campaign-centric hunting helps the SOC move from this question: Is this email malicious? To this question: What is the full impact of this campaign? That shift is important because the response priority should be based on campaign impact, not only on a single alert. What Campaign Views Provides Campaign Views in Microsoft Defender for Office 365 help analysts investigate coordinated email attacks such as phishing and malware campaigns. From Campaign Views, analysts can review campaign-level information such as: Campaign name Campaign type Campaign subtype Targeted users Inboxed messages Clicked users Visited links Sender domains Sender IPs Payload URLs Delivery actions Campaign timeline Campaign flow This is useful during triage because it quickly shows whether an email is part of a wider attack. For example, one reported phishing message may look small at first. But if Campaign Views shows that the same campaign targeted 50 users, delivered messages to 15 inboxes, and had 2 users click the URL, the investigation becomes much more urgent. Where CampaignInfo Fits The CampaignInfo table gives analysts a KQL-based way to query campaign-related data. Some useful fields are: Field Purpose CampaignId Unique identifier for the campaign CampaignName Name of the campaign CampaignType Campaign category, such as Phish or Malware CampaignSubtype Additional context, such as brand being phished or malware family NetworkMessageId Unique identifier for the email message RecipientEmailAddress Recipient affected by the campaign Timestamp Time when the event was recorded For correlation, the most important field is usually: NetworkMessageId This field can help connect campaign data with other Defender XDR email tables, including: EmailEvents UrlClickEvents EmailPostDeliveryEvents EmailAttachmentInfo EmailUrlInfo This makes CampaignInfo a useful pivot table for campaign-level hunting. Important note: CampaignInfo is currently documented as Preview. Before using these queries in production analytics rules, validate the table availability, schema, and results in your own tenant. Practical Scenario An analyst receives a phishing alert in Microsoft Defender XDR. The alert is related to a user who received a suspicious email with a credential-harvesting URL. The analyst opens Campaign Views and sees that the message belongs to a wider phishing campaign. At that point, the investigation should not stop with the original user. The analyst should now ask: Who else received this campaign? How many messages were delivered? Which users clicked? Did any users click through the Safe Links warning? Were the messages removed after delivery? Are there related incidents in Microsoft Sentinel? The investigation flow could look like this: Start from Campaign Views in Microsoft Defender XDR. Identify the campaign details. Use CampaignInfo to list affected users and messages. Join with EmailEvents to validate delivery status. Join with UrlClickEvents to identify user interaction. Join with EmailPostDeliveryEvents to confirm remediation. Review related Microsoft XDR incidents in Microsoft Sentinel. Prioritize response based on campaign impact. Query 1: List Recent Campaigns The first query gives a simple overview of recent campaigns. CampaignInfo | where Timestamp > ago(14d) | summarize FirstSeen = min(Timestamp), LastSeen = max(Timestamp), AffectedUsers = dcount(RecipientEmailAddress), Messages = dcount(NetworkMessageId) by CampaignId, CampaignName, CampaignType, CampaignSubtype | order by LastSeen desc This helps analysts quickly identify campaigns that affected the organization during the selected period. Useful questions to ask from this output: Which campaigns are most recent? Which campaigns affected the most users? Are the campaigns phishing, malware, or spam? Is there a specific brand or malware family in the subtype? Are similar campaigns appearing repeatedly? Query 2: Understand Delivery Impact After identifying campaigns, the next step is to understand delivery impact. A campaign that was fully blocked is different from a campaign that reached user inboxes. let Campaigns = CampaignInfo | where Timestamp > ago(14d) | project CampaignId, CampaignName, CampaignType, CampaignSubtype, NetworkMessageId, RecipientEmailAddress; Campaigns | join kind=leftouter ( EmailEvents | where Timestamp > ago(14d) | project NetworkMessageId, RecipientEmailAddress, Subject, SenderFromAddress, SenderFromDomain, SenderIPv4, DeliveryAction, DeliveryLocation, ThreatTypes, DetectionMethods, Timestamp ) on NetworkMessageId, RecipientEmailAddress | summarize Messages = dcount(NetworkMessageId), AffectedUsers = dcount(RecipientEmailAddress), Subjects = make_set(Subject, 5), SenderDomains = make_set(SenderFromDomain, 10), SenderIPs = make_set(SenderIPv4, 10) by CampaignId, CampaignName, CampaignType, CampaignSubtype, DeliveryAction, DeliveryLocation | order by AffectedUsers desc, Messages desc This query helps separate campaigns that were blocked from campaigns that actually reached users. From a SOC perspective, delivered messages deserve closer attention, especially if they reached the inbox. Query 3: Identify Users Who Clicked Campaign URLs Delivery is important, but clicks usually increase the priority of the incident. This query joins campaign data with UrlClickEvents. let Campaigns = CampaignInfo | where Timestamp > ago(14d) | project CampaignId, CampaignName, CampaignType, CampaignSubtype, NetworkMessageId, RecipientEmailAddress; Campaigns | join kind=inner ( UrlClickEvents | where Timestamp > ago(14d) | project NetworkMessageId, AccountUpn, Url, ActionType, IsClickedThrough, ThreatTypes, DetectionMethods, IPAddress, Workload, ClickTime = Timestamp ) on NetworkMessageId | summarize FirstClick = min(ClickTime), LastClick = max(ClickTime), ClickEvents = count(), ClickedUsers = dcount(AccountUpn), ClickThroughUsers = dcountif(AccountUpn, IsClickedThrough == true), ClickedUrls = make_set(Url, 10), SourceIPs = make_set(IPAddress, 10) by CampaignId, CampaignName, CampaignType, CampaignSubtype | order by ClickThroughUsers desc, ClickedUsers desc, LastClick desc This query helps identify campaigns where users interacted with the payload. If a user clicked a phishing URL, the next step should usually include identity-focused investigation, such as reviewing sign-in activity, MFA status, session activity, and possible risky sign-ins. Query 4: Focus on Click-Through Events Safe Links may block access to a malicious site. In some cases, however, a user may continue through a warning page. Those cases should be reviewed carefully. let Campaigns = CampaignInfo | where Timestamp > ago(30d) | project CampaignId, CampaignName, CampaignType, CampaignSubtype, NetworkMessageId, RecipientEmailAddress; Campaigns | join kind=inner ( UrlClickEvents | where Timestamp > ago(30d) | where IsClickedThrough == true | project NetworkMessageId, AccountUpn, Url, ActionType, ThreatTypes, IPAddress, ClickTime = Timestamp ) on NetworkMessageId | project ClickTime, CampaignId, CampaignName, CampaignType, CampaignSubtype, AccountUpn, RecipientEmailAddress, Url, ActionType, ThreatTypes, IPAddress | order by ClickTime desc This is one of the most useful views during incident response. A click-through event does not automatically mean compromise, but it is a strong reason to investigate the user account further. Query 5: Confirm Post-Delivery Remediation A malicious message may be delivered first and removed later by ZAP, AIR, or manual remediation. This query joins CampaignInfo with EmailPostDeliveryEvents. let Campaigns = CampaignInfo | where Timestamp > ago(30d) | project CampaignId, CampaignName, CampaignType, CampaignSubtype, NetworkMessageId, RecipientEmailAddress; Campaigns | join kind=leftouter ( EmailPostDeliveryEvents | where Timestamp > ago(30d) | project NetworkMessageId, RecipientEmailAddress, RemediationTime = Timestamp, Action, ActionType, ActionTrigger, ActionResult, DeliveryLocation, SourceLocation ) on NetworkMessageId, RecipientEmailAddress | summarize RemediatedMessages = dcountif(NetworkMessageId, isnotempty(ActionType)), RemediationTypes = make_set(ActionType, 10), RemediationResults = make_set(ActionResult, 10), LastRemediation = max(RemediationTime) by CampaignId, CampaignName, CampaignType, CampaignSubtype | order by LastRemediation desc This helps answer a very important question: Were the delivered malicious messages actually removed? This is useful for both SOC triage and reporting because it shows not only detection, but also response. Query 6: Campaign Blast Radius Summary The following query combines campaign, delivery, click, and remediation data into one campaign-level view. let TimeRange = 30d; let Campaigns = CampaignInfo | where Timestamp > ago(TimeRange) | project CampaignId, CampaignName, CampaignType, CampaignSubtype, NetworkMessageId, RecipientEmailAddress; let Delivery = EmailEvents | where Timestamp > ago(TimeRange) | summarize DeliveryActions = make_set(DeliveryAction, 10), DeliveryLocations = make_set(DeliveryLocation, 10), DeliveredMessages = dcountif(NetworkMessageId, DeliveryAction =~ "Delivered"), JunkedMessages = dcountif(NetworkMessageId, DeliveryAction =~ "Junked"), BlockedMessages = dcountif(NetworkMessageId, DeliveryAction =~ "Blocked"), Subjects = make_set(Subject, 5), SenderDomains = make_set(SenderFromDomain, 10) by NetworkMessageId, RecipientEmailAddress; let Clicks = UrlClickEvents | where Timestamp > ago(TimeRange) | summarize ClickEvents = count(), ClickThroughEvents = countif(IsClickedThrough == true), FirstClick = min(Timestamp), LastClick = max(Timestamp), ClickedUrls = make_set(Url, 10) by NetworkMessageId; let Remediation = EmailPostDeliveryEvents | where Timestamp > ago(TimeRange) | summarize RemediationActions = make_set(ActionType, 10), LastRemediation = max(Timestamp) by NetworkMessageId, RecipientEmailAddress; Campaigns | join kind=leftouter Delivery on NetworkMessageId, RecipientEmailAddress | join kind=leftouter Clicks on NetworkMessageId | join kind=leftouter Remediation on NetworkMessageId, RecipientEmailAddress | summarize AffectedUsers = dcount(RecipientEmailAddress), Messages = dcount(NetworkMessageId), DeliveredMessages = sum(DeliveredMessages), JunkedMessages = sum(JunkedMessages), BlockedMessages = sum(BlockedMessages), TotalClickEvents = sum(ClickEvents), ClickThroughEvents = sum(ClickThroughEvents), Subjects = make_set(Subjects, 10), SenderDomains = make_set(SenderDomains, 10), ClickedUrls = make_set(ClickedUrls, 10), RemediationActions = make_set(RemediationActions, 10), LastClick = max(LastClick), LastRemediation = max(LastRemediation) by CampaignId, CampaignName, CampaignType, CampaignSubtype | extend SuggestedPriority = case( ClickThroughEvents > 0, "High", TotalClickEvents > 0, "Medium", DeliveredMessages > 0, "Medium", "Low" ) | order by SuggestedPriority asc, AffectedUsers desc, Messages desc This type of query can be useful during hunting sessions, incident review, and campaign reporting. The goal is not only to collect more data. The goal is to help the analyst decide what needs attention first. Correlating Campaign Activity with Microsoft Sentinel When Microsoft Defender XDR is connected to Microsoft Sentinel, incidents and alerts can be synchronized into the Sentinel incident queue. This allows the SOC to correlate campaign-related email activity with other security signals, such as: Suspicious sign-ins Identity alerts Endpoint alerts Cloud app activity OAuth consent activity Data exfiltration attempts Related Microsoft XDR incidents For example, if a user clicked a phishing URL, the SOC can then review whether the same user had suspicious sign-in activity shortly after the click. The following query is a simple starting point for reviewing Microsoft XDR incidents in Microsoft Sentinel. SecurityIncident | where TimeGenerated > ago(30d) | where ProviderName == "Microsoft XDR" | where Title has_any ("phish", "phishing", "email", "malware", "campaign") | summarize Incidents = count(), HighSeverity = countif(Severity == "High"), MediumSeverity = countif(Severity == "Medium"), Closed = countif(Status == "Closed"), Active = countif(Status == "Active") by bin(TimeGenerated, 1d) | order by TimeGenerated desc This query does not replace campaign hunting. It simply helps analysts understand how email-related activity is represented in the Sentinel incident queue. Suggested SOC Workflow A practical campaign-centric workflow could look like this: Step 1: Start from Campaign Views Review campaigns with delivered messages, clicked users, visited links, or high user impact. Step 2: Pivot to KQL Use CampaignInfo to list campaign-related messages and affected recipients. Step 3: Validate Delivery Join with EmailEvents to confirm whether messages were blocked, junked, delivered, or replaced. Step 4: Review User Interaction Join with UrlClickEvents to identify users who clicked URLs or clicked through Safe Links warnings. Step 5: Confirm Remediation Join with EmailPostDeliveryEvents to confirm whether delivered messages were removed after delivery. Step 6: Correlate in Sentinel Review related Microsoft XDR incidents and correlate with identity, endpoint, and cloud activity. Step 7: Decide Response Depending on the impact, the SOC may decide to: Escalate the incident Notify affected users Review user sign-ins Revoke user sessions Reset passwords Block sender domains or URLs Submit false negatives Create a watchlist for related indicators Tune analytics rules or response processes Suggested Priority Logic Not every campaign needs the same level of response. A simple triage model could be: Condition Suggested priority Campaign blocked before delivery Low Campaign delivered to junk Low to Medium Campaign delivered to inbox Medium Campaign delivered to multiple inboxes Medium to High User clicked URL High User clicked through warning High Priority account clicked High Click followed by suspicious sign-in Critical This model should be adapted to each organization’s risk profile and response process. Limitations and Things to Validate Before using this approach in production, validate the following: Defender for Office 365 Plan 2 availability Campaign Views permissions CampaignInfo table availability Defender XDR connector configuration Advanced hunting event streaming Field names in your environment Retention period Data latency Join behavior using NetworkMessageId Whether click events can be joined to email metadata in all cases One important limitation is that some URL click events may not join cleanly with email metadata. For example, clicks from Drafts or Sent Items may not have the same message metadata available for correlation. Also, because CampaignInfo is currently documented as Preview, I would avoid depending on it alone for critical production automation without testing and validation.213Views0likes0CommentsPending Approval/Provisioning for Microsoft Defender XDR Lab/Trial Environment
Hello Microsoft Community Team, On June 26, 2026, our organization applied for a Microsoft 365 Developer Environment / Free Trial to support evaluation of the Microsoft Defender XDR Lab environment. To date, the environment has not been provisioned, and we have not received any status updates or confirmation. Impact: Current Status: We are currently utilizing our production environment to test project capabilities, which poses risks and limitations. Future Intent: Our organization plans to transition to a full, paid Business/Enterprise purchase immediately upon proving the platform’s benefits. Urgency: This delay is stalling our evaluation phase. We urgently need this environment onboarded and activated so we can proceed with deployment tests and subsequent procurement. Request: Please review the status of our registration and expedite the onboarding/provisioning of this developer environment. Thank you for your prompt assistance.125Views0likes1CommentDetecting AI agents and non-human identities in Microsoft Sentinel: the classic-agent blind spot
Build 2026 made the direction official. The industry is moving from the app era into the agent era, and Microsoft spent a real share of the keynote on securing agents across their lifecycle, from discovering what is exploitable to governing what is running in production. On the identity side the centerpiece is Microsoft Entra Agent ID, now generally available, which gives AI agents first-class identities and extends Conditional Access, Identity Protection, and full audit logging to them. That is good news for agents you build the new way. It is not the whole picture, and the gap is where most SOCs will get hurt first. Modern agents are covered. Classic agents are not. Entra Agent ID draws a hard line between two kinds of agent. Modern agents are created through the Agent ID platform, each backed by an agent identity blueprint. They carry a proper Agent ID, a full audit trail, and the complete set of governance capabilities, including Identity Protection for Agents, which establishes a baseline for an agent's normal activity and flags anomalies automatically. Classic agents are everything that came before, or that gets built outside the platform: AI agents implemented as ordinary service principals or app registrations, for example Copilot Studio agents created before Agent ID was enabled, or any home-grown automation calling Graph with client credentials. In the Entra agent registry they appear with "Has Agent ID: No," and that flag matters, because the Agent ID protections apply to identities that actually hold an Agent ID. Classic agents sit outside Identity Protection for Agents and Conditional Access for Agents. Here is the uncomfortable part. The non-human identities you already run, the service principals behind your pipelines, your integrations, your scripts, your pre-platform Copilot Studio bots, are almost all classic agents. They tend to outnumber your human accounts, they have no MFA in any meaningful sense, and a credential added to one does not show up in the Azure portal. The new platform protections do not reach them. Until you migrate them, the only place you get detection coverage on that population is your SIEM. So this is the job Sentinel does that Agent ID does not: detect risky behavior on the classic, service-principal-backed agents that the platform cannot yet protect. The telemetry you have, and the one switch people forget Three tables carry most of the signal. AADServicePrincipalSignInLogs records service principal authentications, the client-credentials sign-ins your agents and automation use. No user, no MFA, just an app proving it holds a secret or certificate. AADManagedIdentitySignInLogs does the same for managed identities. AuditLogs records directory changes, including the one that matters most for persistence: a new credential added to an application or service principal. One practical warning before any of this works. Service principal and managed identity sign-in logs are not streamed by default. You have to enable those categories explicitly in the Entra diagnostic settings feeding your workspace. Plenty of teams write the detection, never check, and never notice the table is empty. Verify that first. Detection 1: a new credential on a service principal or app Adding a secret or certificate to an existing service principal is one of the cleanest persistence techniques in a Microsoft cloud. The attacker compromises a privileged user or app, drops a fresh credential on a service principal that already holds useful Graph permissions, and now has access that survives password resets and session revocation. It maps to MITRE T1098.001, Account Manipulation: Additional Cloud Credentials. For a classic agent it is especially nasty, because there is no Identity Protection baseline watching it. // Detection 1: new secret or certificate added to an application or service principal // MITRE T1098.001 - Account Manipulation: Additional Cloud Credentials AuditLogs | where OperationName has_any ("Add service principal", "Certificates and secrets management") | where Result =~ "success" | extend Initiator = coalesce( tostring(InitiatedBy.user.userPrincipalName), tostring(InitiatedBy.app.displayName)) | extend InitiatorIp = tostring(InitiatedBy.user.ipAddress) | mv-apply Target = TargetResources on ( where Target.type =~ "Application" | extend TargetName = tostring(Target.displayName), TargetId = tostring(Target.id), KeyChanges = Target.modifiedProperties ) | mv-apply Prop = KeyChanges on ( where tostring(Prop.displayName) =~ "KeyDescription" | extend NewKeys = parse_json(tostring(Prop.newValue)), OldKeys = parse_json(tostring(Prop.oldValue)) ) | extend AddedKeys = set_difference(NewKeys, OldKeys) | where array_length(AddedKeys) > 0 | project TimeGenerated, Initiator, InitiatorIp, TargetName, TargetId, AddedKeys | order by TimeGenerated desc The operation filter catches the three shapes this event takes in the log: "Add service principal," "Add service principal credentials," and "Update application - Certificates and secrets management." The modifiedProperties parsing isolates the KeyDescription change, and set_difference confirms a key was actually added rather than removed, so rotating out an old credential does not, on its own, fire the rule. False positives come from legitimate rotation and from automation that provisions app credentials (CI/CD, infrastructure as code). The initiator is the discriminant. A credential added by your deployment pipeline's service account at the usual time is routine. The same change initiated by an interactive admin out of hours, or by an account that never normally touches app credentials, is what you want to surface. Allow-list the expected initiators, not the targets. Detection 2: a classic agent signing in from a first-seen IP A service principal that has only ever authenticated from your Azure regions and suddenly signs in from somewhere new is a strong signal that its credential has been lifted and is being used elsewhere. Service principals have stable, boring network behavior, which makes a first-seen IP a far cleaner indicator for them than it is for roaming human users. This is the behavioral baseline Identity Protection gives you for free on modern agents, rebuilt in KQL for the classic ones it ignores. MITRE T1078.004, Valid Accounts: Cloud Accounts. // Detection 2: classic-agent service principal signing in from a previously unseen IP // MITRE T1078.004 - Valid Accounts: Cloud Accounts let baseline = 14d; let detection = 1d; let KnownIPs = AADServicePrincipalSignInLogs | where TimeGenerated between (ago(baseline + detection) .. ago(detection)) | where tostring(ResultType) == "0" | summarize KnownIPSet = make_set(IPAddress) by AppId; AADServicePrincipalSignInLogs | where TimeGenerated > ago(detection) | where tostring(ResultType) == "0" | lookup kind=leftouter KnownIPs on AppId | where set_has_element(KnownIPSet, IPAddress) == false | summarize FirstSeen = min(TimeGenerated), Resources = make_set(ResourceDisplayName, 10) by ServicePrincipalName, AppId, IPAddress | order by FirstSeen desc The query builds a per-application baseline of source IPs over the previous two weeks, then flags any successful sign-in today from an address outside that set. Two tuning notes. Brand-new service principals have no baseline, so they surface on first use. That is usually worth seeing once, but you can exclude AppIds younger than the baseline window if it gets noisy. And if your agents egress through shifting cloud IP ranges, widen the comparison from an exact IP to the autonomous system number or a known-range allow-list, otherwise you will chase your own infrastructure. This complements Agent ID, it does not replace it! The endgame is not to run these rules forever. It is to shrink the population they apply to. Inventory your tenant for agents marked "Has Agent ID: No," prioritize the ones holding sensitive Graph permissions, and migrate them onto the Agent ID platform, where Identity Protection and Conditional Access take over the baselining you are doing here by hand. Microsoft has signaled a migration path from classic to modern agents. Treat these two detections as the coverage you need in the meantime, and as a permanent safety net for anything that never makes the move. If you do one thing this week: enable the service principal sign-in log category, deploy detection 1, and pull a list of every service principal that had a credential added in the last 90 days. That list alone tends to be more interesting than people expect. Cheers, Marcel488Views0likes0CommentsThe Worm in the Supply Chain: How Defender for Endpoint and Sentinel for SAP BTP Caught Shai-Hulud
On 29 April 2026, malicious versions of multiple SAP ecosystem npm packages were briefly published, creating a supply-chain exposure for SAP Cloud Application Programming (CAP) development environments and CI/CD pipelines. For a brief window that morning, affected developers have executed a credential-stealing payload on a workstation or, in higher-impact cases, within a CI/CD pipeline. SAP developers don't usually think of themselves as a juicy npm target. CAP, BTP, Fiori - that's enterprise turf, not crypto-stealer type territory – Until it is. Join me for the ride. See our latest click-video for an even more dynamic experience of SAP compromises. Affected packages and scope Four official npm packages from the SAP development ecosystem were published in malicious versions that day. Security researchers are calling the campaign "Mini Shai-Hulud" - the little cousin of the worm family that has been chewing its way through open-source registries for months. So, the "mini" part is a generous description in my opinion. Shai-Hulud has wriggled directly into the SAP supply chain, and that detail alone deserves a pause... SAP CAP is now interesting enough to have become a target. Four packages, all wearing legitimate SAP branding, all quietly swapped for evil twins: @cap-js/sqlite v2.2.2 @cap-js/postgres v2.2.2 @cap-js/db-service v2.10.1 mbt v1.2.48 These packages are not peripheral dependencies. The @cap-js/* modules are part of the SAP CAP Model used across custom development on SAP BTP, while mbt is the Cloud MTA Build Tool commonly embedded in CI/CD workflows that package and deploy Multi-Target Applications to BTP and on-premises environments. At roughly 930,000 weekly downloads, the combined exposure created meaningful downstream attack surface. The good news: SAP spotted the compromise fast, yanked the bad versions, and shipped clean replacements. The official guidance lives in SAP Security Note 3747787 - which carries the list of indicators of compromise, file hashes, and mitigation steps. Enough theory and evidence talk! Now, SHOW ME the detection! When the worm stirs beneath the sand, weak defenses vanish first. Observed telemetry in Microsoft Security products See below excerpt of Microsoft Defender for Endpoint from a compromised developer machine. The worm was neutralized immediately. Check the detection time (same day of release): Windows Defender AV detected malware ToString: DefenderDetection: File: /Users/User***/Projects/dara-api-manager-ui/node_modules/mbt/File***.js, Sha256: *** [Trojan:JS/SPchnStlr.BB], BlockingStatus: Prevented, BlockingStatusPriority: 900 DetectionTime: 2026-04-29 11:52:11Z DetectorName: Microsoft.Cyber.ObservationDetectors.DefenderConcreteDetector Observations (2): DefenderObservation Description: Defender detected and quarantined 'Trojan:JS/SPchnStlr.BB' in file 'File***.js' ThreatCategory = Trojan, ThreatFamily = SPchnStlr, How the Threat Actors Operationalized the Stolen Data The compromise allowed harvesting GitHub tokens, AWS/Azure/GCP secrets, npm credentials, Kubernetes config, SSH keys, .npmrc and .git-credentials files, and CI/CD environment variables. The hackers created a public GitHub repository on the victim’s own account, tagged with the description “A Mini Shai-Hulud has Appeared“ to exfiltrate their reaping. Within hours, more than a thousand such repositories were visible in public GitHub search. For additional views on the topic check out the blogs of our Sentinel for SAP partners: Onapsis, Pathlock, and SecurityBridge. Containment and Impact Reduction If you were not as lucky as the developer using Defender for Endpoint and VS Code, you need end to end monitoring of your landscape in and around SAP. Once the worm is loose with cloud tokens it may appear in various unexpected places. Microsoft Sentinel Solution for SAP covers your ERP crown jewels, your SAP BTP landscape and allows informed correlation with the rest of your IT estate. Microsoft’s correlation engine: ensures traceability automatic attack disruption and just-in-time hardening of potential attack paths. Developers using the cloud-based IDE SAP Business Application Studio are out of reach by Defender for Endpoint but profit from threat monitoring through Sentinel for SAP BTP integrating SAP BTP’s malware scanner the same way. See this in action in this click-video and in below screenshot. SOC analysts get actionable insights and tailored guidance from Security Copilot once SAP BTP signals are added to the Microsoft incident graph - no matter where the threat involving SAP originates from. Getting Started with Sentinel Solution for SAP Rollout of Sentinel for SAP BTP can happen immediately. Learn more from our deployment guide. Check out the security content reference for more info out-of-the-box detections. Sentinel for SAP which covers your ERP solutions and more, requires configuration of SAP Integration Suite as intermediary step. Learn more from our deployment guide. Check out the security content reference for more info out-of-the-box detections Final Words This incident illustrates how far the SAP BTP attack surface now extends and why patching alone is insufficient once malicious code reaches developer tooling and build infrastructure. Effective defense also requires telemetry, correlation, and response coverage across SAP and non-SAP environments. See you out there folks! #Kudos to Mahesh Mandva and Cameron Gardiner on riding shai-holud with me. Feel free to reach out to talk more about SAP Cyber Security. Cheers, Martin Useful Links SAP Note 3747787 with mitigation guide Mini Shai-Hulud: Multi-Ecosystem Developer Supply Chain Attack – Lab Space Click-Demo for SAP Cyber Security with Microsoft Sentinel for SAP Security Content | Microsoft Learn Sentinel for SAP BTP Security Content | Microsoft Learn540Views0likes0Comments