robotics
10 TopicsFirmware Analysis now Generally Available
Back in June, we announced the public preview of firmware analysis, a new capability available through Azure Arc to help organizations gain visibility into the security of their Internet of Things (IoT), Operational Technology (OT), and network devices. Today, we are excited to announce that firmware analysis is generally available (GA) for all Azure customers. In modern industrial environments, firmware security is a foundational requirement. IoT sensors and smart devices collect the data fueling AI-driven insights; if those devices aren’t secure, your data and operational continuity are at risk. During the preview, we heard from many customers who used firmware analysis to shine a light into their device software and address hidden vulnerabilities before attackers or downtime could strike. With general availability, firmware analysis is ready to help organizations fortify the “blind spots” in their infrastructure – from factory-floor sensors to branch office routers – by analyzing the software that runs on those devices. What Firmware Analysis Does for You Firmware analysis examines the low-level software (firmware) that powers IoT, OT and network devices, with no agent required on the device. You can upload a firmware image (for example, an extracted embedded Linux image), and the cloud service performs an automated security inspection. Key features include: Software inventory & vulnerability scanning: The service builds a Software Bill of Materials (SBOM) of components within the firmware and checks each component against known CVEs (Common Vulnerabilities and Exposures). This quickly surfaces any known vulnerabilities in your device’s software stack so you can prioritize patching those issues. Security configuration and hardening check: Firmware analysis evaluates how the firmware binaries are built, looking for security hardening measures (e.g. stack protections, ASLR) or dangerous configurations. If certain best practices are missing, the firmware might be easier to exploit – the tool flags this to inform the device manufacturer or your security team. Credential and secrets discovery: The analysis finds any hard-coded credentials (user accounts/password hashes) present in the firmware, as well as embedded cryptographic material like SSL/TLS certificates or keys. These could pose serious risks – for instance, default passwords that attackers could exploit (recall the Mirai botnet using factory-default creds) are identified so you can mitigate them. Any discovered certificates or keys can indicate potentially insecure design if left in production firmware. Comprehensive report: All security findings – from the Software Bill of Materials (SBOM), list of vulnerabilities to hardening recommendations and exposed secrets – are provided in a detailed report for each firmware image analyzed. This gives device makers and operators actionable intelligence to improve their device security posture. In short, firmware analysis provides deep insights into the contents and security quality of device firmware. It turns opaque firmware into transparent data, helping you answer, “What’s really inside my device software?” so you can address weaknesses proactively. What’s New and Licensing We’ve been hard at work making firmware analysis even better as we move to GA. Based on preview feedback, we’ve addressed bugs, implemented usability suggestions and improved the firmware analysis SDKs, CLI and PowerShell extensions. A new Azure resource called “firmware workspace” now stores analyzed firmware images. Firmware analysis workspaces are currently available as a Free Firmware Analysis Workspace SKU with capacity limits. Getting Started If you have IoT, OT and network devices in your environment, use firmware analysis to test just how secure your devices are. Getting started is easy: access firmware analysis by searching “firmware analysis” in the Azure portal, or access using this link. Onboard your subscription and then upload firmware images for analysis. For a step-by-step tutorial, visit our official documentation. The service currently supports embedded Linux-based images up to 1GB in size. We want to thank all the preview participants who tested firmware analysis and provided feedback. You helped us refine the service for GA and we’re thrilled to make this powerful tool broadly available to help secure IoT, OT and network devices around the world. We can’t wait to see how you put it to work. As always, we value your feedback, so please let us know what you think.10KViews4likes0Comments
ROS 2 on Windows
Super cool to see the progress on ros2 since I ran it last ... what milestones in the next couple months are there on Windows / Azure that we can look out for? Also is the setup up to date (and does it work for vs17 as well)? I setup the environment a year ago but don't know if there any changes I should be aware ofSolved7.4KViews1like2Comments
ROS on Windows and ROS with Azure
Welcome to the Robotics community. We’d like to leverage this conversation space to discuss the Robot Operating System (ROS) on Windows as well as share feedback and learnings. Come join our discussion. Microsoft is working with Open Robotics and the ROS Industrial Consortium to bring the Robot Operating System to Windows. Microsoft has joined the ROS Industrial Consortium who's mission is to extend the capabilities of ROS to manufacturing and improve the productivity and return on investment of industrial robots. Microsoft will host and maintain the Windows builds for ROS1, and shortly ROS2. We are providing documentation, development and deployment solutions for Windows. To get started using ROS on Windows and ROS with Azure, please visit the Getting Started guide at http://aka.ms/ros.5.1KViews4likes0CommentsRemote Computer Science with Pi-Top smart rover , .NET interactive Microsoft Bot & Microsoft Teams
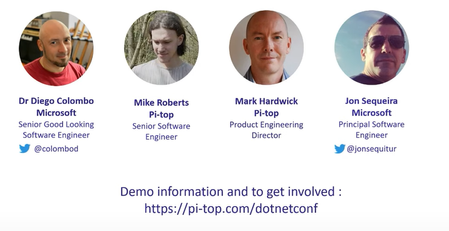
Come see how we're using .NET Interactive, pi-top's smart rover, and Microsoft Teams to showcase the remote computer science class of the future. A Covid-19 resistant remote first approach that allows collaboration, coding, testing debugging and rich interactions involving data, video and Azure cloud services.2.6KViews2likes0Comments
RPA Predictions for 2019
Hi team, We run a series on Intelligent Automation events, with our upcoming one in May at the Beanfield Center in Toronto – Intelligent Automation Canada. RPA has a very important part to play as organizations are increasingly searching how to improve and modify their applications on a continuous basis. Please see our report on RPA Predictions for 2019: http://bit.ly/2Ft0aMb If interested in attending the event with speakers from Bank of America, Cargill, Loblaw, and more, here’s the full event guide: http://bit.ly/2UQJHa51.3KViews0likes0CommentsAzure IoT Operations 2603 is now available: Powering the next era of Physical AI
Industrial AI is entering a new phase. For years, AI innovation has largely lived in dashboards, analytics, and digital decision support. Today, that intelligence is moving into the real world, onto factory floors, oil fields, and production lines, where AI systems don’t just analyze data, but sense, reason, and act in physical environments. This shift is increasingly described as Physical AI: intelligence that operates reliably where safety, latency, and real‑world constraints matter most. With the Azure IoT Operations 2603 (v1.3.38) release, Microsoft is delivering one of its most significant updates to date, strengthening the platform foundation required to build, deploy, and operate Physical AI systems at industrial scale. Why Physical AI needs a new kind of platform Physical AI systems are fundamentally different from digital‑only AI. They require: Real‑time, low‑latency decision‑making at the edge Tight integration across devices, assets, and OT systems End‑to‑end observability, health, and lifecycle management Secure cloud‑to‑edge control planes with governance built in Industry leaders and researchers increasingly agree that success in Physical AI depends less on isolated models, and more on software platforms that orchestrate data, assets, actions, and AI workloads across the physical world. Azure IoT Operations was built for exactly this challenge. What’s new in Azure IoT Operations 2603 The 2603 release delivers major advancements across data pipelines, connectivity, reliability, and operational control, enabling customers to move faster from experimentation to production‑grade Physical AI. Cloud‑to‑edge management actions Cloud‑to‑edge management actions enable teams to securely execute control and configuration operations on on‑premises assets, such as invoking methods, writing values, or adjusting settings, using Azure Resource Manager and Event Grid–based MQTT messaging. This capability extends the Azure control plane beyond the cloud, allowing intent, policy, and actions to be delivered reliably to physical systems while remaining decoupled from protocol and device specifics. For Physical AI, this closes the loop between perception and action: insights and decisions derived from models can be translated into governed, auditable changes in the physical world, even when assets operate in distributed or intermittently connected environments. Built‑in RBAC, managed identity, and activity logs ensure every action is authorized, traceable, and compliant, preserving safety, accountability, and human oversight as intelligence increasingly moves from observation to autonomous execution at the edge. No‑code dataflow graphs Azure IoT Operations makes it easier to build real‑time data pipelines at the edge without writing custom code. No‑code data flow graphs let teams design visual processing pipelines using built‑in transforms, with improved reliability, validation, and observability. Visual Editor – Build multi-stage data processing systems in the Operations Experience canvas. Drag and connect sources, transforms, and destinations visually. Configure map rules, filter conditions, and window durations inline. Deploy directly from the browser or define in Bicep/YAML for GitOps. Composable Transforms, Any Order – Chain map, filter, branch, concatenate, and window transforms in any sequence. Branch splits messages down parallel paths based on conditions. Concatenate merges them back. Route messages to different MQTT topics based on content. No fixed pipeline shape. Expressions, Enrichment, and Aggregation – Unit conversions, math, string operations, regex, conditionals, and last-known-value lookups, all built into the expression language. Enrich messages with external data from a state store. Aggregate high-frequency sensor data over tumbling time windows to compute averages, min/max, and counts. Open and Extensible – Connect to MQTT, Kafka, and OpenTelemetry (OTel) endpoints with built-in security through Azure Key Vault and managed identities. Need logic beyond what no-code covers? Drop a custom Wasm module (even embed and run ONNX AI ML models) into the middle of any graph alongside built-in transforms. You're never locked into declarative configuration. Together, these capabilities allow teams to move from raw telemetry to actionable signals directly at the edge without custom code or fragile glue logic. Expanded, production‑ready connectivity The MQTT connector enables customers to onboard MQTT devices as assets and route data to downstream workloads using familiar MQTT topics, with the flexibility to support unified namespace (UNS) patterns when desired. By leveraging MQTT’s lightweight publish/subscribe model, teams can simplify connectivity and share data across consumers without tight coupling between producers and applications. This is especially important for Physical AI, where intelligent systems must continuously sense state changes in the physical world and react quickly based on a consistent, authoritative operational context rather than fragmented data pipelines. Alongside MQTT, Azure IoT Operations continues to deliver broad, industrial‑grade connectivity across OPC UA, ONVIF, Media, REST/HTTP, and other connectors, with improved asset discovery, payload transformation, and lifecycle stability, providing the dependable connectivity layer Physical AI systems rely on to understand and respond to real‑world conditions. Unified health and observability Physical AI systems must be trustworthy. Azure IoT Operations 2603 introduces unified health status reporting across brokers, dataflows, assets, connectors, and endpoints, using consistent states and surfaced through both Kubernetes and Azure Resource Manager. This enables operators to see—not guess—when systems are ready to act in the physical world. Optional OPC UA connector deployment Azure IoT Operations 2603 introduces optional OPC UA connector deployment, reinforcing a design goal to keep deployments as streamlined as possible for scenarios that don’t require OPC UA from day one. The OPC UA connector is a discrete, native component of Azure IoT Operations that can be included during initial instance creation or added later as needs evolve, allowing teams to avoid unnecessary footprint and complexity in MQTT‑only or non‑OPC deployments. This reflects the broader architectural principle behind Azure IoT Operations: a platform built for composability and decomposability, where capabilities are assembled based on scenario requirements rather than assumed defaults, supporting faster onboarding, lower resource consumption, and cleaner production rollouts without limiting future expansion. Broker reliability and platform hardening The 2603 release significantly improves broker reliability through graceful upgrades, idempotent replication, persistence correctness, and backpressure isolation—capabilities essential for always‑on Physical AI systems operating in production environments. Physical AI in action: What customers are achieving today Azure IoT Operations is already powering real‑world Physical AI across industries, helping customers move beyond pilots to repeatable, scalable execution. Procter & Gamble Consumer goods leader P&G continually looks for ways to drive manufacturing efficiency and improve overall equipment effectiveness—a KPI encompassing availability, performance, and quality that’s tracked in P&G facilities around the world. P&G deployed Azure IoT Operations, enabled by Azure Arc, to capture real-time data from equipment at the edge, analyze it in the cloud, and deploy predictive models that enhance manufacturing efficiency and reduce unplanned downtime. Using Azure IoT Operations and Azure Arc, P&G is extrapolating insights and correlating them across plants to improve efficiency, reduce loss, and continue to drive global manufacturing technology forward. More info. Husqvarna Husqvarna Group faced increasing pressure to modernize its fragmented global infrastructure, gain real-time operational insights, and improve efficiency across its supply chain to stay competitive in a rapidly evolving digital and manufacturing landscape. Husqvarna Group implemented a suite of Microsoft Azure solutions—including Azure Arc, Azure IoT Operations, and Azure OpenAI—to unify cloud and on-premises systems, enable real-time data insights, and drive innovation across global manufacturing operations. With Azure, Husqvarna Group achieved 98% faster data deployment and 50% lower infrastructure imaging costs, while improving productivity, reducing downtime, and enabling real-time insights across a growing network of smart, connected factories. More info. Chevron With its Facilities and Operations of the Future initiative, Chevron is reimagining the monitoring of its physical operations to support remote and autonomous operations through enhanced capabilities and real-time access to data. Chevron adopted Microsoft Azure IoT Operations, enabled by Azure Arc, to manage and analyze data locally at remote facilities at the edge, while still maintaining a centralized, cloud-based management plane. Real-time insights enhance worker safety while lowering operational costs, empowering staff to focus on complex, higher-value tasks rather than routine inspections. More info. A platform purpose‑built for Physical AI Across manufacturing, energy, and infrastructure, the message is clear: the next wave of AI value will be created where digital intelligence meets the physical world. Azure IoT Operations 2603 strengthens Microsoft’s commitment to that future—providing the secure, observable, cloud‑connected edge platform required to build Physical AI systems that are not only intelligent, but dependable. Get started To explore the full Azure IoT Operations 2603 release, review the public documentation and release notes, and start building Physical AI solutions that operate and scale confidently in the real world.1.1KViews3likes0CommentsAzure IoT Operations 2510 Now Generally Available
Introduction We’re thrilled to announce the general availability of Azure IoT Operations 2510, the latest evolution of the adaptive cloud approach for AI in industrial and large scale commercial IoT. With this release, organizations can unlock new levels of scalability, security, and interoperability, empowering teams to seamlessly connect, manage, and analyze data from edge to cloud. What is Azure IoT Operations? Azure IoT Operations is more than an edge-to-cloud data plane, it’s the foundation for AI in physical environments, enabling intelligent systems to perceive, reason, and act in the real world. Built on Arc-enabled Kubernetes clusters, Azure IoT Operations unifies operational and business data across distributed environments, eliminating silos and delivering repeatability and scalability. By extending familiar Azure management concepts to physical sites, AIO creates an AI-ready infrastructure that supports autonomous, adaptive operations at scale. This approach bridges information technology (IT), operational technology (OT), and data domains, empowering customers to discover, collect, process, and send data using open standards while laying the groundwork for self-optimizing environments where AI agents and human supervisors collaborate seamlessly. We've put together a quick demo video showcasing the key features of this 2510 release. Watch below to discover how Azure IoT Operations' modular and scalable data services empowers IT, OT and developers. What’s New in Azure IoT Operations 2510? Management actions: Powerful management actions put you in control of processes and asset configurations, making operations simpler and smarter. Web Assembly (Wasm) data graphs: Wasm-powered data graphs for advanced edge processing, delivering fast, modular analytics and business logic right where your data lives. New connectors: Expanded connector options now include OPC UA, ONVIF, Media, REST/HTTP, and Server-Sent Events (SSE), opening the door to richer integrations across diverse industrial and IT systems. OpenTelemetry (OTel) endpoints: Data flows now support sending data directly to OpenTelemetry collectors, integrating device and system telemetry into your existing observability infrastructure. Improved observability: Real-time health status for assets gives you unmatched visibility and confidence in your IoT ecosystem. Reusable Connector templates: Streamline connector configuration and deployment across clusters. Device support in Azure Device Registry: Azure Device Registry (ADR) now treats devices as first‑class resources within ADR namespaces, enabling logical isolation and role‑based access control at scale. Automatic device and asset discovery and onboarding: Akri‑powered discovery continuously detects devices and industrial assets on the network, then automatically provisions and onboards them (including creating the right connector instances) so telemetry starts flowing with minimal manual setup. MQTT Data Persistence: Data can now be persisted to disk, ensuring durability across broker restarts. X.509 Auth in MQTT broker: The broker now supports X.509 authentication backed by Azure's Device Registry. Flexible RBAC: Built-in roles and custom role definitions to simplify and secure access management for AIO resources. Customers and partners Chevron, through its Facilities and Operations of the Future initiative, deployed Azure IoT Operations with Azure Arc to manage edge-to-cloud workloads across remote oil and gas sites. With a single management plane, the strategy unifies control over thousands of distributed sensors, cameras, robots, and drones. Real-time monitoring and AI enabled anomaly detection not only to enhance operational efficiency but also significantly improve worker safety by reducing routine inspections and enabling remote issue mitigation. This reuse of a global, AI-ready architecture positions Chevron to deliver more reliable, cleaner energy. [microsoft.com] Husqvarna implemented Azure IoT Operations across its global manufacturing network as part of a comprehensive strategy. This adaptive cloud approach integrates cloud, on-premises, and edge systems, preserves legacy investments, and enables real-time edge analytics. The result: data operationalization is 98% faster, imaging costs were slashed by half, productivity was improved, and downtime was reduced. Additionally, AI-driven capabilities like the Factory Companion powered by Azure AI empower technicians with instant, data-informed troubleshooting, shifting maintenance from reactive to predictive across sites. [microsoft.com] Together, these success stories show how Azure IoT Operations, combined with capabilities like Azure Arc, can empower industrial leaders to advance from siloed operations to unified, intelligent systems that boost efficiency, safety, and innovation. Additionally, this year we are celebrating how our partners are integrating, co-innovating, and scaling real customer outcomes. You can learn more about our partner successes at https://aka.ms/Ignite25/DigitalOperationsBlog. Learn more at our launch event Join us at Microsoft Ignite to dive deeper into the latest innovations in Azure IoT Operations 2510. Our sessions will showcase real-world demos plus expert insights on how new capabilities accelerate industrial transformation. Don’t miss the chance to connect with product engineers, explore solution blueprints, and see how Azure IoT Operations lays the foundation for building and scaling physical AI. Get Started Ready to experience the new capabilities in Azure IoT Operations 2510? Explore the latest documentation and quickstart guides at https://aka.ms/AzureIoTOperations Connect with the Azure IoT Tech Community to share feedback and learn from peers.800Views0likes0CommentsAzure IoT Operations 2610 is now available: Scaling the foundation for Physical AI
AI is moving out of dashboards and onto factory floors, oil fields, and production lines, where it can sense, reason, and act in the physical world. Most industrial organizations are only beginning to make that shift, and they need a platform that lets them start with confidence and keep going as their ambitions grow. Azure IoT Operations 2610 is built for exactly that. For the first time, Azure IoT Operations ships on two channels at once. The generally available (GA) release delivers production-ready capabilities that help organizations understand their operations across many more sites, at lower cost. A new public preview channel gives customers hands-on access to the capabilities that are coming next, including governed access to operations for AI agents and AI inference running directly inside edge data pipelines. Taken together, the two channels show where the platform is today and where it is heading. This release is part of a broader set of Physical AI announcements at Microsoft Ignite. Microsoft's Ignite Physical AI announcement (https://aka.ms/Ignite2026/PhysicalAIBlog) describes how IoT, Industrial AI, and Physical AI connect data, decisions, and action: IoT helps organizations understand their operations, Industrial AI helps them reason, and Physical AI helps them act, together forming a continuous learning loop. Within Microsoft's adaptive cloud approach, Azure IoT Operations is the on-site foundation for that loop. This post goes one level deeper into what 2610 delivers and what it makes possible. Physical AI and where Azure IoT Operations fits Physical AI is AI that works in the physical world. It perceives what is happening across an operation, reasons about what it means, and acts to improve the outcome. Getting there is a journey rather than a single leap, and customers should not feel they have to take on everything at once. Azure IoT Operations is designed to make that journey practical, so organizations can start simply, prove value, and evolve toward far more sophisticated applications of AI and agents at their own pace. The journey begins with easy integration into the physical operation customers already run. Many start with perception: connecting equipment, bringing in data from sensors and cameras, and seeing what is happening in real time. From there, they move into reasoning, with AI models and agents that diagnose issues and recommend improvements. Ultimately, they move into action, where approved decisions reach equipment through partner control systems. Each step builds on the one before it, on the same platform. Azure IoT Operations is also designed from the ground up to protect each customer's proprietary operational data. Customers decide who can access which data and how, and that applies to AI agents as much as to people and applications. They also decide what data leaves the site, if any at all. That control lets customers choose the deployment model that fits their operation: cloud-first deployments that rely on AI in the cloud, hybrid deployments that combine cloud AI with local AI models and agents, and fully local deployments where AI and agents run only on site and data never leaves it. Whichever path and deployment model a customer chooses, the role of Azure IoT Operations comes down to three core functions and two key intersections with the systems around it. Three core functions Understand the operation. Azure IoT Operations keeps trusted operational context close to the process: what each asset is, what its data means, how equipment relates, its current and historical state, observations from cameras and other sensors, and the capabilities and constraints of the process. Standards such as OPC UA and W3C Web of Things are the tools. The outcome is context that people and AI can rely on. Optimize the operation. AI models and agents run at the edge, next to the operational data and the process, where they can perceive, diagnose, recommend, optimize, and coordinate. Microsoft Foundry supplies the models and agent development capabilities. Azure IoT Operations supplies the operational environment in which those agents become useful. Govern action. When an agent proposes an action, Azure IoT Operations turns it into an authorized, bounded, and observable operation. It authenticates the actor, evaluates policy and current conditions, obtains approval where required, invokes an authoritative command path, records the decision, and verifies the result. Two key intersections Where AI meets control: Azure IoT Operations optimizes, partners actuate. Azure IoT Operations decides, predicts, and recommends, sometimes in the form of a control input such as a new setpoint, and issues that intent through governed interfaces. Partner control systems and robots run the deterministic real-time loop and own safety, for people and machines, at all times. As a simple example, Azure IoT Operations can set the thermostat, but the thermostat and the HVAC system get the room to the correct temperature. Partners are already proving this pattern. Azure IoT Operations integrates with Rockwell Automation's FactoryTalk Optix and is part of Schneider Electric's EcoStruxure Automation Expert. In Schneider's green-hydrogen pilot with H2E Power, AI agents validated control logic in simulation before deploying it to hardware; the system ran for more than 6,000 hours autonomously and cut the levelized cost of hydrogen by roughly 10%. Where edge meets cloud: local intelligence at the edge, enterprise intelligence in the cloud. Azure IoT Operations integrates local operational intelligence at each site. Microsoft Fabric integrates enterprise-wide and cross-site intelligence. The two are federated, so when customers choose to share data beyond the site, the context created at the edge flows to the cloud without being rebuilt. These three core functions follow the same path customers take into Physical AI: understanding the operation turns raw data into trusted context, optimizing it is where AI reasons over that context, and governing action is how decisions safely reach the physical world. Clear roles at each intersection are what make AI credible to the people who run plants. Customers get AI that is useful on the floor without trading away the control systems, certifications, and safety practices they already trust. What 2610 delivers Azure IoT Operations already provides the foundation many industrial customers run in production today: governed cloud-to-edge management actions, no-code data flow graphs, broad industrial connectivity, and unified health reporting. Release 2610 builds on that foundation in two directions. The GA release deepens the first core function, understanding the operation, and makes it practical at fleet scale. It also strengthens the intersection where edge meets cloud by landing edge data directly in the lakehouse. The preview release takes the first concrete steps into the second and third core functions: running AI against live operational data at the edge, and giving AI agents governed, auditable access to operations. Core function Generally available in 2610 In preview with 2610 Understand the operation Essentials SKU for large fleets, ODBC-based connector for SQL Server, smarter OPC UA collection, leaner data flow writes to the lakehouse Asset context with Web of Things and the edge registry, type-based OPC UA discovery, live data in the operations experience, Azure Marketplace connectors and the Akri Connector Builder, Microsoft Fabric integration Optimize the operation Service calls from custom WebAssembly modules, AI-assisted data flow authoring in VS Code Inference connector with Foundry Local and Azure Machine Learning, file-backed graph processing Govern action Management actions for HTTP/REST assets MCP server with policy-governed tool access, data-driven management actions, application lifecycle for agents and MCP servers Two release channels: what you can run today, and what is coming next Starting with 2610, every Azure IoT Operations release ships on two channels. GA (stable) is production-ready and fully supported. This is what you run on the factory floor. Preview includes everything in GA plus new capabilities that are ready for hands-on feedback. Use it in test or pilot environments to evaluate what is coming and help shape it before it reaches GA. You choose a channel when you deploy, through the Azure portal deployment wizard or the Azure CLI, and you upgrade within that channel. Switching an existing instance between GA and preview is not supported, so production deployments stay on a predictable, stable path. Connector and transform versions follow the same rule: GA instances see only GA versions, while preview instances see both. For technology leaders, the second channel changes how you can plan. You no longer have to wait for GA to evaluate a major capability or sign up for a one-off private preview. The preview channel is a working view of the roadmap, available every release, that your teams can put in front of real equipment and real operators while production keeps running. Generally available: understanding operations at scale Physical AI is only as good as the operational context beneath it, and that context has to exist at every site, not just at the flagship plant. The GA capabilities in 2610 turn on-site data into actionable intelligence: they make operational context cheaper to establish, broader in what it covers, and easier to hand up to enterprise analytics. Bring Physical AI to more sites: Azure IoT Operations Essentials A new Essentials SKU sits alongside the full-featured offering, now called Standard. Essentials delivers the core of Azure IoT Operations, the edge MQTT broker, Akri connectors, and data flows, on single-node clusters at a lower price point. Many organizations need a reliable edge data layer at hundreds or thousands of small sites, such as stores, substations, wind turbines, or remote equipment, that do not need the full industrial feature set. Essentials makes those fleet-wide rollouts cost-effective. Standard remains the choice for full industrial deployments that need OPC UA connectivity or multi-node clusters. You choose the SKU when you create an instance, and moving to Essentials requires a new deployment. Together with ARM64 support, generally available since release 2607, Essentials lowers both the cost and the hardware bar for line-level and pilot deployments. Data flow graphs that land data directly in your lakehouse Data flow graphs write directly to Azure Data Lake Storage Gen2 in Delta or Parquet, Microsoft Fabric OneLake tables in Delta, and Azure Data Explorer or local storage in Parquet. Teams can branch, window, filter, and run custom WebAssembly transforms at the edge, then write the result straight into analytics-ready tables with no extra messaging hop and no second pipeline to maintain. In 2610, Delta Lake writes use less memory and carry less transaction-log overhead, with checkpoints running in the background. Less, cleaner data goes to the cloud, which lowers storage and ingestion costs. This is where edge meets cloud, in practice: the edge does the local work, and Fabric receives context it can use for cross-site analysis. More of the plant, connected The new ODBC-based connector for SQL Server brings data from the databases behind MES, quality, batch, and historian systems into the same pipelines as OPC UA and MQTT telemetry. Teams configure a SQL Server connection and its assets in the operations experience and define datasets with SQL queries, with no custom extraction code. Management actions now extend to assets connected through the HTTP/REST connector as well, so teams can collect data from and act on REST-connected equipment alongside everything else. That brings governed management actions to more of the plant. Smarter OPC UA data collection OPC UA is a widely used open standard that lets industrial machines share their data, and 2610 makes the Azure IoT Operations connector for it smarter about what it collects and sends. It can now ignore values that barely change, drop readings the equipment itself flags as unreliable, and sample data at a fixed interval. Filtering out noise and bad readings at the source means less data to move and store, lower cloud costs, and cleaner input for analytics and AI. When a machine restarts or the network drops, applications can request a complete snapshot of the machine's current state, or receive one automatically when a key value changes, instead of waiting for values to trickle back in. Optional health signals confirm that the connection is alive and that data has been delivered, and an optional fast failover gets data flowing again sooner when a connection fails. Faster to build, easier to operate Several GA capabilities shorten the path from idea to running pipeline. Developers can describe a data flow in plain language to GitHub Copilot in VS Code, validate it locally, and deploy it. Custom WebAssembly modules in data flow graphs can now call request-response services over MQTT while processing a message, for enrichment, lookups, routing decisions, or asset management actions. The edge state store now supports paged key scans and multi-key reads, so applications can discover and retrieve the context available to them. Live data views in the Azure IoT Operations Data Flow extension for VS Code speed up commissioning and troubleshooting, and an updated navigation layout in the operations experience makes instances and their resources easier to find. Public preview: AI that reasons over operations, with action that stays governed The preview channel is where 2610 reaches furthest toward Physical AI. These capabilities put agentic AI to work on live plant data at the edge, within the governance controls the customer sets, and give agents a governed path into operations. Customers can evaluate them now in test and pilot environments. Connect AI agents to edge operations, with guardrails Azure IoT Operations now includes a Model Context Protocol (MCP) server that gives compatible AI agents and assistants authenticated, authorized access to live MQTT telemetry and state store data at the edge. A single endpoint aggregates supported first-party and third-party MCP tools, so teams can register their own MCP servers behind the same entry point instead of managing separate client connections. Authentication and authorization policies that you control govern access to every registered tool, so each agent gets only the tools its role allows, and publishing MQTT messages requires Admin permissions. New application lifecycle capabilities also let teams deploy and manage agents and MCP servers on the cluster, alongside connectors. This is the third core function, govern action, taking shape. Teams want AI copilots that can answer "why is line 3 down?" or "which assets are unhealthy?" without giving AI broad access to production systems. With a single governed entry point, organizations bring the agent they already use and decide exactly what that agent can see and do. Run predictive AI models in the data pipeline The new Inference connector runs registered machine learning models, using predictive models served by Foundry Local on the cluster or models hosted in Azure Machine Learning, with multiple models running concurrently. Large inputs such as high-resolution images are read from files rather than passed through the message broker, and new graph-level file stores let custom WebAssembly transforms read and write those files on persistent cluster storage. Moving a model from a notebook onto a live production line usually means custom integration code for every model. With the Inference transform, a model becomes another step in the pipeline, and its results can feed downstream transforms or trigger management actions on connected assets, closing the loop from perception through reasoning to action. This is the second core function, optimize the operation, running where the data is. Give data meaning: asset context and the edge registry Raw tag values are not enough for analytics or AI to reason about an operation. A new WoT Enrich transform uses Web of Things mappings to give asset messages a consistent structure and add context such as what a value means and its units, and a new Microsoft Fabric integration formats and batches that telemetry for Eventhouse or Lakehouse. The new edge registry stores JSON Schemas and Web of Things Thing Models and Thing Descriptions on the cluster, where local workloads can reach them, and keeps them in sync with the cloud registry. Type-based OPC UA discovery finds assets and event groups from OPC UA type information, and assets such as Modbus pumps or S7 PLCs can be onboarded through OPC UA servers that implement the OPC UA Web of Things Connectivity API. When context travels with the data from the source, both Fabric reports and AI agents understand what they are looking at, even when cloud connectivity is interrupted. See data as it flows, and connect more sources Live data in the operations experience lets authorized users inspect incoming asset messages and validate data as it moves through transforms, WebAssembly modules, and data flow graphs, which answers the first question in every rollout: is the data arriving, and does it look right? To broaden connectivity, customers on the preview channel can discover and deploy supported third-party connectors from Azure Marketplace through the Azure portal or Azure CLI. For protocols that no connector covers yet, the Akri Connector Builder, a GitHub Copilot agent plugin, turns protocol specifications into connector code, tests, and documentation, and validates the result against a generated protocol simulator and a local Azure IoT Operations environment. Azure IoT Operations in Azure Government Azure IoT Operations is now in public preview in Azure Government (US Gov Virginia), running the 2610 GA feature set. US government agencies and their partners can evaluate edge data collection and processing in a government cloud, deploying through Azure CLI and using the operations experience. The preview channel is not available in Azure Government. Physical AI in action Customers are already putting this foundation to work. Unilever, working with Microsoft, NVIDIA, and Accenture, has built an advanced digital twin that captures the behavior of a whole factory as a connected system. The solution uses Azure IoT Operations to ingest and integrate sensor data, contextualize it at the edge, and feed it to edge and cloud AI services. By identifying bottlenecks, testing interventions, and recommending actions before issues affect production, it helps unlock greater efficiency, faster changeovers, and reduced waste, while giving engineers and factory teams AI-powered insight to make faster, better-informed decisions. What comes next Each Azure IoT Operations release now shows two things: what is ready for production, and what is coming next. Over the coming releases, the platform will keep moving from perceiving and informing, to reasoning and recommending, to orchestrating action through partner control systems. As it does, the human role shifts from approving every step to overseeing the system with the ability to intervene, and the platform's two key intersections, with partner control systems and with the cloud, stay the same throughout. Get started Deploy Azure IoT Operations 2610 with the Azure portal deployment wizard, Azure CLI, or Bicep, and choose the GA or preview channel and the Essentials or Standard SKU at deployment. Upgrade existing instances with Azure CLI, following the release-specific upgrade instructions. To try preview capabilities, deploy a new instance on the preview channel in a test or pilot environment. Review the public documentation (https://aka.ms/aiodocs) and release notes (https://github.com/Azure/azure-iot-operations/releases) for full details. Read Microsoft's Ignite Physical AI announcement (https://aka.ms/Ignite2026/PhysicalAIBlog) for the full picture across Azure IoT Hub, Azure Device Registry, Azure Local, Microsoft Fabric, and our partner ecosystem. Azure IoT Operations 2610 strengthens the foundation that is in production today and shows where Physical AI is heading. Wherever your organization is starting from, we look forward to building the next era of Physical AI with you.66Views1like0CommentsAdvancing Device Firmware Security with Fleet Insights and Continuous Vulnerability Visibility
Firmware underpins IoT, OT, and network-device security, yet remains difficult to inventory, assess, and secure continuously. Earlier this year, we expanded firmware analysis enabled by Azure Arc to connect vulnerabilities to devices through Azure Device Registry, enrich CVE prioritization, analyze complex firmware, and improve software-supply-chain collaboration. At Microsoft Ignite, we're adding capabilities to surface firmware insights in device management, identify potentially risky function calls, refresh vulnerability information, and expand component discovery. These updates turn point-in-time firmware assessments into actionable insights across the device lifecycle. Bringing firmware security insights directly into Azure Device Registry In April, we introduced an integration between firmware analysis and Azure Device Registry (ADR) that maps analyzed firmware to the devices and assets running it, revealing fleet impact rather than an isolated scan result. At Ignite, we’re bringing firmware security insights directly into the Azure Device Registry experience. From an ADR device or asset, customers can view a firmware security summary, see whether vulnerabilities appear in the CISA Known Exploited Vulnerabilities (KEV) Catalog, and open the full firmware analysis report. Firmware is associated with devices and assets by manufacturer, model, and software version. Why it matters: Security teams can move from a vulnerability to affected devices, while operations teams can move from a device to firmware risk. Connecting firmware analysis and ADR reduces manual correlation and helps teams prioritize devices exposed to vulnerabilities known to be exploited in the wild. This makes firmware security part of the device-management lifecycle rather than a separate workflow. Keep firmware vulnerability information current with Latest CVEs A firmware image doesn't become static from a security perspective simply because its bits haven't changed. A firmware image’s security posture can change even when its bits do not. New CVEs or updated vulnerability data can introduce risk after the original analysis, requiring customers to re-upload firmware and compare results manually. With Latest CVEs, now in Preview, firmware analysis provides a refreshed view of vulnerabilities affecting an existing firmware image while preserving the original results for comparison and audit. It includes original and newly identified CVEs, relevant metadata changes, and additions to the CISA Known Exploited Vulnerabilities (KEV) Catalog—the authoritative catalog of vulnerabilities with evidence of exploitation in the wild. Customers can compare Original results captured at upload with the Latest view and filter for newly identified CVEs or severity-impacting metadata changes. Why it matters: Firmware may remain deployed for years, so teams need a fresh risk picture—not only the original assessment. Latest CVEs surfaces newly introduced risk, including when a vulnerability enters CISA KEV, and helps identify affected firmware and devices for priority patching, mitigation, or investigation. Finding potentially unsafe function calls in firmware Vulnerabilities aren't limited to known CVEs. Security issues can also originate in the way firmware itself is implemented. The new Unsafe Function Calls analysis, now in preview, scans supported ELF executables for functions that can create security issues without controls such as input validation, bounds checking, and buffer-size validation. The preview identifies calls to functions including strcpy, strcat, printf, fprintf, sprintf, system, mmap, and popen. It also surfaces network-related function-call information, allowing analysts to consider prioritizing executables containing both unsafe function calls and network-related calls for further review. This helps security and firmware-engineering teams identify binaries for deeper review and investigate risky implementation patterns beyond CVE analysis. A flagged function does not necessarily indicate a vulnerability; exploitability depends on its use, input data, and surrounding protections. The preview supports ELF user-space executables on AMD64/x86-64, ARM64/AArch64, ARM32 and MIPS32. Broader SBOM discovery across firmware An accurate Software Bill of Materials is essential to firmware risk assessment: unidentified components cannot be reliably mapped to disclosed vulnerabilities. Over the past few months we have added 70 new SBOM component detectors to expand discovery of software embedded in firmware images. These detectors expand the range of software components that firmware analysis can identify, improving software inventory visibility and supporting component-level vulnerability analysis. This expansion addresses component-discovery gaps across real-world firmware through ongoing validation of customer firmware and comparison results. Why it matters: Better component discovery improves software-supply-chain visibility and helps identify affected firmware when vulnerabilities are disclosed. Extending firmware security visibility beyond the initial scan Together, these capabilities make firmware security insights broader, more current, and easier to operationalize: Azure Device Registry integration connects firmware security posture—including CISA KEV findings—to the devices and assets customers manage. Latest CVEs helps customers understand how firmware vulnerability posture changes after initial analysis and prioritize affected firmware and devices when a CVE is added to CISA KEV. Unsafe Function Calls analysis adds another layer of static security analysis beyond known vulnerabilities and software inventory. Expanded SBOM detection increases visibility into the software components that make up firmware. Firmware security should continue after the scan by connecting findings to devices, detecting risks beyond CVEs, tracking vulnerabilities over time, and maintaining visibility into fleet software. These investments in firmware analysis, enabled by Azure Arc and Azure Device Registry, make firmware security more visible, actionable, and integrated into edge management and security. As always, we welcome customer feedback as we expand firmware analysis.28Views0likes0Comments