red hat
29 TopicsWhat IT teams need to know about Linux Secure Boot certificates expiring in 2026
If your organization does not use UEFI Secure Boot on Linux systems, this transition does not affect your boot path. You can stop reading now. If you do use Secure Boot, here is what you need to know. The Microsoft Corporation UEFI CA (Certificate Authority) 2011 expires on June 27, 2026 (June 26 local time in some time zones). Expiration alone does not stop anything from booting and does not render a system insecure. Existing 2011-signed shims keep working on systems that still trust the 2011 CA. The real risk is narrower: once an operating system vendor ships a shim signed only by the Microsoft UEFI CA 2023, any system whose firmware does not already trust the 2023 CA will fail to boot. The work for you is to confirm, before that update reaches your systems, that your systems trust the 2023 CA. If you want the history of why a Microsoft certificate sits in the Linux Secure Boot path at all, skip to the end. Terms used in this post You may see three Microsoft Secure Boot certificate authorities discussed in 2026 guidance. This post focuses on the Microsoft UEFI CA 2011, which is the CA used for third-party UEFI boot applications such as the Linux shim. The other expiring Microsoft Secure Boot certificates are the Microsoft Corporation KEK CA 2011, which is used to authorize updates to Secure Boot databases, and the Microsoft Windows Production PCA 2011, which is used for Windows boot components. Windows systems have a separate update path for those certificates; this post covers only the Linux boot chain. The 2023 update also separates two uses that were both covered by the Microsoft UEFI CA 2011. The Microsoft UEFI CA 2023 is for third-party UEFI boot applications, including the Linux shim. The Microsoft Option ROM UEFI CA 2023 is for third-party option ROMs, such as firmware on some add-in cards. This post is about the Linux bootloader path, but physical systems that rely on signed option ROMs may need to check that path too. Microsoft began returning 2023-signed Linux shim binaries to operating system vendors in October 2025, and since then a submitted shim comes back signed by both the 2011 CA and the 2023 CA. Once the 2011 CA expires, Microsoft can only sign with the 2023 CA. In UEFI Secure Boot terminology, db is the allowed signature database, dbx is the forbidden or revoked signature database, and KEK contains keys that can authorize updates to db and dbx . SBAT is a shim ecosystem mechanism for revoking boot components by generation. SBAT is related to Secure Boot revocation, but it is separate from the CA expiration itself. For brevity, the rest of this post uses operating system vendor to include Linux distributions and other vendors that ship and support Linux boot components. Microsoft returns signed shims to that submitting operating system vendor. It does not push shim updates to end users or IT departments. Those reach systems through the normal operating system, package, image, or platform update channels. What is not happening Expiration is not revocation, and it does not cause an immediate boot failure. The 2011 CA expiring does not make existing 2011-signed shims stop booting on June 27, 2026. UEFI Secure Boot validates a signature against the trust database and revocation state, not against the certificate's validity period. The image-validation process in the UEFI specification bases the decision on whether the image's hash or signing certificate is present in the authorized database ( db ) and absent from the forbidden database ( dbx ). It does not check whether the certificate has expired. Firmware bugs are always possible, but expiration by itself should not invalidate an already-signed shim. There is also no current plan to revoke the Microsoft UEFI CA 2011. Expiration means Microsoft can no longer sign new binaries with that certificate. Revocation would mean telling systems not to trust binaries signed with it. Revocation is not the plan. For the same reason, do not remove the 2011 CA from a system's Secure Boot db . Removing it strips that trust path. Removal is not required for this transition, and existing boot components may still depend on the 2011 CA. No operating system vendor has to move to a 2023-signed shim on the expiration date. An operating system vendor may keep shipping a 2011-signed shim (if one is available), ship a 2023-only shim, or ship one carrying both signatures. That decision belongs to the operating system vendor. What can break The failure case is a mismatch between the shim signature and the firmware trust database. The moment to worry about is not the expiration date. It is when a system first receives a 2023-only shim. That leaves a remediation window: the time between the expiration date and the first 2023-only shim reaching a given system. How long it lasts depends on your operating system vendor's packaging decisions, any security fix that forces a new shim release, and how easily you can update firmware or VM Secure Boot state on the affected platforms. The transition comes down to one table: Firmware trust database 2011-only shim 2023-only shim Dual-signed shim 2011 CA only Boots, but depends on continued 2011 trust Does not boot Should boot 2023 CA only Does not boot Boots Should boot Both 2011 and 2023 CAs Boots Boots Boots The table is deliberately simple. Real systems also have dbx revocations, SBAT policy, firmware bugs, operating system vendor packaging choices, and platform-specific update paths. But this is the core compatibility problem. Dual-signed shims help bridge the transition, because the same shim can validate through either CA. However, they are not a guarantee. Some firmware mishandles multiple signatures and evaluates only one of them, revocation and vendor support still apply, and the operating system vendor decides whether to ship and support a dual-signed shim at all. This kind of failure happens early, before the operating system loads. Recovery means restoring a trusted boot path or following your operating system, hardware, or platform vendor's recovery guidance. It is not a package rollback inside a running system. Who should pay closest attention This transition matters most where the operating system, firmware, and update path may not move together. If you run a maintained operating system on maintained hardware or a maintained virtualization platform, the normal vendor update path may handle most of it. Closer attention is worthwhile where that path is missing, delayed, customized, or hard to validate. Older hardware is the first case. Some systems need a firmware update before they can trust the 2023 CA, and support can vary by model even within one hardware vendor's portfolio. Check each model you operate rather than assuming one answer covers the fleet. Long-lived virtual machines are the second. VM firmware is still firmware. A VM's Secure Boot state depends on when it was created, which platform firmware it uses, and which UEFI variables have changed since. Firmware is not just another package update, so a long-lived VM may never have received the relevant firmware or database updates unless the administrator or platform applied them. Your cloud or virtualization provider should be able to say how the 2023 CA is handled for new VMs, existing VMs, and imported or custom images. For Azure Trusted Launch and Confidential VMs specifically, Microsoft has published guidance on identifying and updating affected instances. Older operating system releases need more careful validation. Some lack current Secure Boot tooling, current fwupd daemon behavior, or a supported path for updating UEFI trust databases. A command that works on one release may not be supported on another. Custom fleets are their own category: systems built from custom images, frozen package mirrors, pinned bootloader versions, or local Secure Boot policy changes. The more an environment differs from the vendor's default update path, the more you need to verify the actual firmware trust database and installed shim directly. Smaller operating system vendors and long-tail distributions are worth checking too, especially if they submit shim updates infrequently or have not finished their 2023 signing transition. No single authoritative public list tells you which releases have completed this work. Who is responsible for what There is no single Linux Secure Boot owner who can make every system safe for the transition. The operating system vendor controls which shim and boot components it ships. It also controls whether its update process checks the firmware trust database before installing a 2023-only shim. The Linux community runs a community-driven shim-review process for shim submissions. That process is the primary review gate before an operating system vendor requests a Microsoft signature. It is not a support channel for individual systems or fleets. The hardware vendor, firmware vendor, or virtual machine platform controls which trust anchors are present by default and how firmware updates are delivered. In a physical machine, that may mean a BIOS or firmware update. In a VM, it may mean platform firmware defaults, guest-visible UEFI variables, or a provider-specific remediation process. Microsoft controls the Microsoft UEFI signing service and the Microsoft UEFI CAs. After shim-review approval, Microsoft verifies the submitter's relationship to the operating system vendor, runs some additional checks, signs submitted shims, and returns the signed artifacts to the submitting operating system vendor. Microsoft does not choose when each operating system vendor ships a new shim to its customers. Your organization controls the systems it administers. In practice, that means checking whether Secure Boot is enabled, checking which certificates are trusted, following guidance from the relevant operating system vendor, and following guidance from the hardware vendor or VM provider. This is why the right answer for any specific system depends on its operating system vendor, hardware vendor, and platform. This post explains the model. Only those vendors can tell you what is supported for your systems. What to check The exact commands vary by operating system vendor, package set, and platform. Treat the examples below as illustrations, not guaranteed instructions for every Linux system. IT departments should validate commands against vendor documentation before using them in production automation. At fleet scale, the useful starting point is an inventory rather than a one-time manual check. Useful fields include whether Secure Boot is enabled, which Microsoft UEFI CAs are present in the firmware trust database, which CA signed the installed shim, the operating system release, the hardware model or VM platform, the update channel, and whether the system comes from a custom image or vendor image. Set up representative canary systems before any broad rollout. A canary set should cover the differences that matter in your fleet: hardware model, VM platform, operating system release, image lineage, and update channel. The aim is to avoid discovering a firmware or shim mismatch for the first time during a broad production update, not to build a new certification program. First, check whether Secure Boot is enabled: sudo mokutil --sb-state If Secure Boot is disabled, this certificate transition does not affect that system's current boot path. Next, check which Microsoft UEFI CAs are in the firmware trust database: sudo mokutil --db Look for entries such as: Microsoft Corporation UEFI CA 2011 Microsoft UEFI CA 2023 If both are present, the system is prepared for a future 2023-signed shim. If only the 2011 CA is present, check guidance from the relevant operating system vendor and platform provider before accepting a 2023-only shim update. On physical systems, also check whether the platform relies on signed third-party option ROMs. Those may require the Microsoft Option ROM UEFI CA 2023 in addition to the Microsoft UEFI CA 2023 used for boot applications. This is another reason hardware guidance can vary by model. Administrators can also inspect the signature on the shim currently installed on a system. On Enterprise Linux and related distributions, pesign is often used: sudo dnf install pesign sudo pesign -S -i /boot/efi/EFI/<vendor-or-distribution>/shimx64.efi On Debian, Ubuntu, and related distributions, sbverify from sbsigntools is often used: sudo apt install sbsigntools sudo sbverify --list /boot/efi/EFI/<vendor-or-distribution>/shimx64.efi The path to shim may differ. Some systems use a different EFI path, a different architecture suffix, or a different bootloader arrangement. Vendor documentation is the right source for exact commands. How updates may be delivered Many operating system vendors use the Linux Vendor Firmware Service (LVFS) and fwupd for firmware-related updates, including some UEFI Secure Boot database updates. Not every vendor enables the same tooling, and not every platform supports the same update mechanism. Common examples include: sudo fwupdmgr update sudo fwupdmgr security sudo fwupdmgr get-devices Some systems may require a firmware update from the hardware vendor. Some may support a standalone UEFI database update. Some may not support a safe standalone update at all. Some hardware and firmware vendors block standalone database updates because earlier failures showed that the update could break systems. Updating the Secure Boot allowed signature database ( db ) also depends on authorization from keys in KEK . That is one reason these updates often require cooperation from the firmware, hardware, or VM platform vendor. Administrators should not assume that possession of a certificate file is enough to update a system safely. Do not force a Secure Boot database update just because a command exists. Follow the guidance for the specific hardware, VM platform, or operating system vendor. Forcing an update can force a physical reboot of a machine or destroy the system. After the first inventory pass, keep watching the operating system vendor's security advisories and bootloader package updates. Questions for your vendors The right questions depend on the system, but these are the kinds of answers IT departments should look for from operating system vendors, hardware vendors, and VM providers: Does this operating system release currently ship a 2011-signed, 2023-signed, or dual-signed shim? If the vendor plans to ship a 2023-only shim, will the update process check whether the system trusts the 2023 CA before installing it? How is the Microsoft UEFI CA 2023 delivered for this hardware model, VM platform, or image? Is a standalone Secure Boot database update supported, or must the update arrive through a firmware update? Does support vary by hardware model, firmware version, VM generation, image type, or operating system release? What should administrators monitor for shim, GRUB, SBAT, db , KEK , or dbx updates related to this transition? What is the recommended validation path before broad deployment? What is the supported recovery path if a system receives an incompatible shim or firmware update and fails to boot? What to do now If an IT department administers Linux systems that use Secure Boot, the useful work is straightforward: Use the checks above to inventory Secure Boot state, trusted CAs, and installed shim signatures across representative systems. Identify the parts of the fleet most likely to diverge from default vendor paths, including older hardware, long-lived VMs, older operating system releases, custom images, and pinned bootloader packages. Read operating system, hardware, and VM provider guidance before accepting 2023-only shim updates or applying firmware and Secure Boot database updates. Test representative canary systems before rolling out shim or firmware changes broadly. Monitor operating system vendor advisories for shim and bootloader updates related to the transition. Avoid forcing low-level firmware or UEFI variable updates unless vendor guidance says to do so. How Linux got here UEFI Secure Boot was introduced to let firmware verify boot components before executing them. The firmware contains a trust database. If a bootloader is signed by a trusted certificate and is not blocked by revocation policy, the firmware can execute it. In the PC ecosystem, Microsoft has long operated the signing infrastructure used by Windows and by many third-party UEFI boot components. Linux operating system vendors do not have Microsoft sign the Linux kernel directly. Instead, they use a small first-stage bootloader called shim. The Linux shim is signed by Microsoft so firmware will start it. The shim then validates the next boot component, usually GRUB or another vendor-controlled bootloader, using keys controlled by the operating system vendor, not Microsoft. That structure lets Linux operating system vendors participate in the UEFI Secure Boot ecosystem while keeping control over their own boot chains. The shim code is developed publicly, and shim signing uses the community-run shim-review process before the Microsoft signing step. That split is important. The Linux community reviews shim submissions, and Microsoft operates the signing service that applies a signature firmware will trust. The certificate rotation affects this first handoff. Firmware must trust the CA that signed shim. If a future shim is signed only by the 2023 CA, the firmware needs the 2023 CA in its trust database. A system that keeps booting with a 2011-signed shim is not automatically broken or insecure on the expiration date. A system that moves to a 2023-signed shim needs to trust the 2023 CA; plan for that transition.1.9KViews2likes0CommentsNow Generally Available: Built-in CIS Benchmark Auditing for Linux on Azure
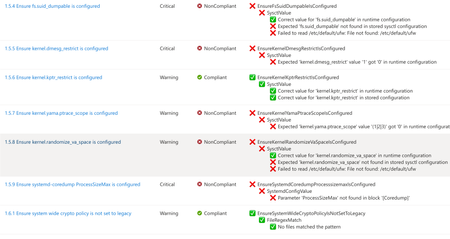
A few months ago, in From Policy to Practice: Built-in CIS Benchmarks on Azure – Flexible, Hybrid-Ready, we introduced a new way to bring Center for Internet Security (CIS) Benchmarks to your Linux estate using Azure Policy with Machine Configuration. It builds on the broader customizable security baseline policies in Machine Configuration capability. Today we're excited to share the next milestone: the audit capability for CIS Benchmarks on Linux is now Generally Available (GA). This release is officially powered by kompli - our native Linux compliance and hardening engine for CIS, STIG, and custom baselines. kompli is the evolution of the engine that drove the preview, now established as the dedicated home for this capability going forward. What "GA" means for you The audit experience is now ready for production use. You can continuously assess your Linux workloads against official, CIS-certified benchmarks - at scale, across Azure and hybrid environments through Azure Arc - and get clear, CIS-style compliance reporting directly in Azure Policy and Azure Resource Graph. If you've read the previous post, the how hasn't changed, so we'll keep this one short: Automated compliance assessment - continuously monitor Linux systems against official CIS benchmarks. Tailored benchmarks - customize evaluations with exceptions and custom parameters, no code changes required. Compliance reporting - detailed, CIS-style reports across your fleet. Hybrid-ready - the same baselines apply to Azure VMs and Arc-enabled servers on-premises or in other clouds. All supported benchmarks are CIS Benchmark Assessment Certified and stay in parity with the content published on the CIS website. Supported distributions and benchmark versions With this release, audit is GA across the following distributions, covering Level 1 + Level 2 Server profiles: Distribution CIS Benchmark Version(s) Profiles Audit Ubuntu 20.04 / 22.04 / 24.04 LTS + Pro v3.0.0 / v2.0.0 + v3.0.0 / v1.0.0 L1 + L2 Server ✓ Red Hat Enterprise Linux 8 / 9 / 10 v3.0.0 + v4.0.0 / v2.0.0 / v1.0.1 L1 + L2 Server ✓ AlmaLinux 8 / 9 v3.0.0 + v4.0.0 / v2.0.0 L1 + L2 Server ✓ Rocky Linux 8 / 9 v2.0.0 + v3.0.0 / v2.0.0 L1 + L2 Server ✓ Oracle Linux 8 / 9 v3.0.0 + v4.0.0 / v2.0.0 L1 + L2 Server ✓ Debian 11 / 12 v2.0.0 / v1.1.0 L1 + L2 Server ✓ SUSE Linux Enterprise 12 / 15 v3.2.1 / v2.0.1 L1 + L2 Server ✓ AKS Optimized Azure Linux 3 v1.0.0 L1 + L2 Server ✓ This GA covers the audit (assessment) capability. Looking ahead, STIG benchmarks are coming next, followed by a granular per-rule auto-remediation capability with dynamic scope assignments. You can run these benchmarks against your own hardened images, against CIS hardened images, and against custom images built on top of vanilla distros — as long as /etc/os-release retains its original content. We're also working with vendors to minimize deviations. Getting started Open Azure Policy in the Azure portal. Under Authoring, select the new Machine Configuration blade. Choose Official Center for Internet Security (CIS) Benchmarks for Linux Workloads, then Modify Settings to pick the distributions you want to assess. Full documentation, including per-distribution rule details, supported parameters, and any known deviations from the official CIS toolset, is available here: Overview: CIS Security Benchmarks for Linux Workloads Per-distribution references: AlmaLinux, Azure Linux, Debian, Oracle Linux, Red Hat Enterprise Linux, Rocky Linux, SUSE Linux Enterprise, and Ubuntu - all linked from the overview page. We're building this with you As part of this GA release, we've also expanded the set of exposed rule parameters compared to the preview - giving you more out-of-the-box customization across rules and distributions. That said, our customer-driven approach still stands: we keep the experience clean by enabling parameters based on real demand, so if there's a rule, benchmark version, or distribution you'd like parameters enabled for - or any feedback on rules, evaluations, or distro coverage - let us know: Open a GitHub issue in the kompli repository Open an Azure support case Try it out, tell us what you think, and help shape what we build next.422Views1like0CommentsIntroducing kars - an Agent Reference Stack for Kubernetes
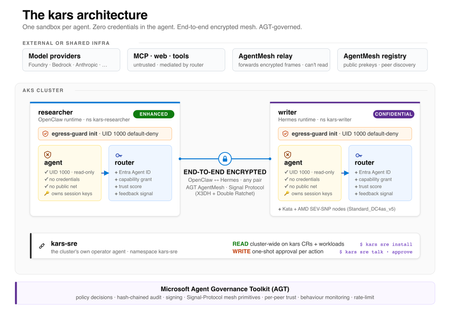
kars is an open-source, Kubernetes-native runtime for AI agents on Azure. It treats every agent as untrusted code - per-pod kernel isolation, zero credentials in the agent process, and an end-to-end encrypted inter-agent mesh - and governs agents on any framework with one set of Kubernetes policies via the Microsoft Agent Governance Toolkit. kars dev runs a governed agent on your laptop in minutes.2.4KViews1like2CommentsApplying Site Reliability Engineering to Autonomous AI Agents
If you practice SRE, you already have a mental model for running reliable production systems. You define SLOs. You track error budgets. You use circuit breakers to stop cascading failures. You run chaos experiments to find weaknesses before customers do. You treat every operational decision as a tradeoff between reliability and velocity. That mental model transfers directly to AI agents. It just needs four new ideas. In the Agent Governance Toolkit: Architecture Deep Dive, Policy Engines, Trust, and SRE for AI Agents, we covered Agent SRE briefly as one of AGT's nine packages: SLOs, error budgets, circuit breakers, chaos engineering, and progressive delivery, adapted from the patterns your SRE team already applies to microservices. Several teams asked for the full story. This is it. Agent SRE is one of the more novel parts of the toolkit. The policy engine, zero-trust identity, and execution sandboxing have clear analogs in existing security practice. Agent SRE explores newer ground. Established patterns for defining SLOs for AI agent behavior, building chaos experiments for LLM provider failures, or applying error budgets to agent autonomy are still emerging across the industry. We built these capabilities because running agents in production without them is the equivalent of running a fleet of microservices without circuit breakers, health checks, or an on-call runbook. This post is for SRE teams, platform engineers, and anyone responsible for running AI agents in production. You do not need to be an AI specialist. If you know what a burn rate is, you are ready for this. The Problem: Agents Fail in Ways Your Existing SRE Tooling Cannot See When a service fails, your observability stack tells you: latency went up, error rate crossed the SLO threshold, the circuit breaker opened. You page the on-call engineer. They look at traces and find the slow database query. When an AI agent fails, your observability stack is silent. The agent returned HTTP 200. Latency was normal. Error rate was zero. But the agent quietly approved a transaction it was not authorized to approve, hallucinated a database path and wrote to the wrong table, or got stuck in a reasoning loop that consumed $800 of LLM API budget before anyone noticed. These are not infrastructure failures. They are behavioral failures. And they are invisible to monitoring tools built for stateless, deterministic services, because those tools only watch for crashes and timeouts. They do not watch for wrong behavior. This gap is the problem Agent SRE was designed to solve. The solution borrows everything from the SRE playbook and adds one concept that extends it: the Safety SLI. The Safety SLI: A New Reliability Dimension Traditional SLIs measure system behavior from the user's perspective: latency, availability, error rate, throughput. They answer: did the service respond correctly? For AI agents, correctness is not enough. An agent that responds correctly but acts outside its authorized scope has not succeeded. It has failed in a way that none of your existing SLIs can detect. The Safety SLI answers a different question: did the agent act within policy? from agent_sre import SLO, ErrorBudget from agent_sre.slo.indicators import PolicyCompliance # Define a safety SLO: 99% of agent actions must comply with policy safety_slo = SLO( name="safety-compliance", indicators=[ PolicyCompliance( target=0.99, window="7d", ), ], error_budget=ErrorBudget( total=0.01, # 1% budget (1 - 0.99 target) window_seconds=2592000, # 30-day window burn_rate_alert=2.0, # warn at 2x sustainable rate burn_rate_critical=5.0, # page at 5x sustainable rate ), ) When an agent's policy compliance rate drops below 99%, the error budget starts burning. The ErrorBudget tracks consumption automatically and exposes burn rate alerts through its firing_alerts() method. When the budget is exhausted, the configured exhaustion_action determines the system response: from agent_sre.slo.objectives import ExhaustionAction # Configure what happens when error budget is exhausted safety_slo = SLO( name="safety-compliance", indicators=[PolicyCompliance(target=0.99, window="7d")], error_budget=ErrorBudget( total=0.01, window_seconds=2592000, burn_rate_alert=2.0, # fires at 2x sustainable burn rate burn_rate_critical=5.0, # fires at 5x sustainable burn rate exhaustion_action=ExhaustionAction.CIRCUIT_BREAK, # suspend agent when budget is gone ), ) # In your monitoring loop, check for firing alerts alerts = safety_slo.error_budget.firing_alerts() for alert in alerts: print(f"Alert firing: {alert.name} (severity: {alert.severity})") # Check budget status print(f"Budget remaining: {safety_slo.error_budget.remaining_percent:.1f}%") print(f"Current burn rate: {safety_slo.error_budget.burn_rate():.2f}x") print(f"Exhausted: {safety_slo.error_budget.is_exhausted}") This is the governance dial from the other direction. The error budget is not just a metric: it is the mechanism that drives agent autonomy decisions. An agent with a clean 30-day safety record earns autonomy. An agent whose budget is burning at 5x the sustainable rate triggers a critical alert, and when the budget is exhausted, the exhaustion_action fires: ALERT, THROTTLE, FREEZE_DEPLOYMENTS, or CIRCUIT_BREAK. The graduated response mirrors what SRE teams already do with service SLOs, applied to agent behavior. There are multiple SLI dimensions built into Agent SRE. Safety SLIs and Performance SLIs track different aspects of the same agent: SLI Type What It Measures Target Pattern When Budget Burns Safety SLI PolicyCompliance -- fraction of actions within authorized scope >= 99% Restrict capabilities, increase human oversight Performance SLI TaskSuccessRate, ResponseLatency, CostPerTask Configurable per workload Alert, throttle, or circuit-break LLM provider Additional built-in indicators include ToolCallAccuracy, DelegationChainDepth, HallucinationRate, and CalibrationDeltaSLI. Both SLOs feed into the same error budget dashboard. An agent can have excellent performance but a degrading safety record, or perfect safety compliance and terrible cost efficiency. You need both dimensions to understand whether an agent is production-ready. Circuit Breakers: Governing Agent Failure Modes That Don't Exist in Microservices Circuit breakers for services protect against one failure mode: a backend that is slow or unreachable. The pattern is CLOSED -> OPEN -> HALF_OPEN. You know it well. Agent SRE implements the same state machine for failure modes that are specific to autonomous reasoning systems and do not exist in traditional microservice architectures: from agent_sre.cascade.circuit_breaker import CircuitBreakerConfig, CircuitBreaker from agent_sre.chaos.engine import FaultType config = CircuitBreakerConfig( failure_threshold=5, # Open after 5 failures in the window recovery_timeout_seconds=60, # Stay OPEN for 60s before HALF_OPEN half_open_max_calls=3, # Allow 3 probes in HALF_OPEN ) breaker = CircuitBreaker(agent_id="analyst-agent-001", config=config) # Failure modes tracked by the circuit breaker: tracked_faults = [ FaultType.POLICY_BYPASS, # Agent exceeds authorized scope FaultType.ERROR_INJECTION, # Upstream model API fails FaultType.TIMEOUT_INJECTION, # Tool calls exceed time budget FaultType.TRUST_PERTURBATION, # Agent trust score falls below threshold FaultType.DEADLOCK_INJECTION, # Agent stuck in iterative reasoning ] Each failure mode has different circuit-breaking semantics: Failure Mode What Triggers It Circuit-Break Behavior Policy bypass Action denied by policy engine Count toward threshold; log with full context LLM provider error HTTP 5xx from model API Immediately open; route to fallback model if configured Tool timeout Tool call exceeds timeout_ms Count toward threshold; cancel in-flight call Trust score degradation Agent trust score drops below configured floor Open; escalate to Ring 3 (untrusted) until score recovers Reasoning loop / deadlock Token or iteration count exceeds budget Open; trigger human review before resuming The reasoning loop breaker deserves attention. A microservice cannot get stuck reasoning. An AI agent absolutely can, and when it does, the failure is not an error code: it is an agent that keeps calling tools, consuming tokens, and generating audit events indefinitely. The circuit breaker detects this pattern from the iteration count and token budget and terminates the loop: # Reasoning loop detection configuration loop_detection_config = { "max_iterations": 15, # Hard stop after 15 reasoning steps "max_tokens_per_session": 50000, # Hard stop on token consumption "repetition_threshold": 0.85, # Stop if >85% of recent actions repeat prior ones "on_detection": "circuit_break_and_escalate", } The state machine behaves identically to what you know from Hystrix or Resilience4j. What changes is the definition of "failure." CLOSED (serving) | | failure_threshold crossed for any tracked fault v OPEN (rejecting -- agent action denied, fallback or human-in-loop fires) | | recovery_timeout expires v HALF_OPEN (probe -- limited requests allowed through) | |-- success_threshold met --> CLOSED |-- any failure --> OPEN (reset timeout) Chaos Engineering for Agents: Fault Injection for Autonomous Systems The only way to know if your agent system is resilient is to break it intentionally. Traditional chaos engineering targets infrastructure: kill a pod, inject network latency, saturate a disk. Agent chaos engineering targets the failure modes specific to autonomous reasoning systems. Agent SRE ships fault injection templates that cover the failure modes teams consistently underestimate until they hit production: from agent_sre.chaos.engine import ChaosExperiment, Fault, FaultType # Experiment 1: LLM provider degrades -- model returns valid responses but with # increased latency and occasional malformed outputs experiment = ChaosExperiment( name="llm-degradation-resilience", target_agent="analyst-agent-001", description="Test agent behavior under degraded LLM provider", faults=[ Fault.latency_injection(target="llm-provider", delay_ms=8000), Fault.error_injection(target="llm-provider", rate=0.05), ], duration_seconds=300, ) # Experiment 2: Trust score manipulation -- simulates an agent receiving # messages from a peer with a spoofed trust score trust_experiment = ChaosExperiment( name="trust-manipulation-resilience", target_agent="orchestrator-001", faults=[ Fault( fault_type=FaultType.TRUST_PERTURBATION, target="did:mesh:orchestrator-001", params={"spoofed_score": 950}, ), ], duration_seconds=120, ) # Experiment 3: Tool timeout cascade -- multiple tools time out simultaneously, # testing whether the agent abandons gracefully or enters a reasoning loop cascade_experiment = ChaosExperiment( name="tool-timeout-cascade", target_agent="analyst-agent-001", faults=[ Fault.timeout_injection(target="database.read", delay_ms=30000), Fault.timeout_injection(target="api.call", delay_ms=30000), ], duration_seconds=180, ) # Run the experiment experiment.start() # ... inject faults during agent execution ... resilience = experiment.calculate_resilience( baseline_success_rate=0.95, experiment_success_rate=0.87, recovery_time_ms=48000, ) experiment.complete(resilience=resilience) print(f"Resilience score: {resilience.overall}/100 -- {'PASSED' if resilience.passed else 'FAILED'}") Additional fault types built into the chaos engine cover: prompt injection attempts, privilege escalation, data exfiltration attempts, identity spoofing, deadlock injection, and contradictory instruction scenarios. Each maps to a FaultType enum value and can be composed into multi-fault experiments. Important: The chaos engine records that a fault was injected and triggers the governance response pipeline. Actual infrastructure-level fault injection (network partition, process kill) should be implemented using your existing chaos tooling (Chaos Mesh, Gremlin, Azure Chaos Studio, or similar). Agent SRE governs the agent's behavioral response to faults; it does not own infrastructure manipulation. These two layers are designed to compose. Each chaos experiment produces a structured resilience score via calculate_resilience(), which compares baseline and experiment success rates. A score of 90+ with passed=True means the agent maintained at least 90% of its baseline performance under fault conditions. Teams use this to set minimum resilience thresholds for production readiness. Replay Debugging: Reproduce Behavioral Failures Exactly Infrastructure incidents are reproducible because infrastructure is deterministic. AI agent incidents are hard to reproduce because agent behavior depends on model state, context window content, and the sequence of tool call results, none of which are preserved by default after a session ends. Agent SRE's replay engine records every agent session as a replayable artifact: the full trace at each step, every tool call with its inputs and outputs, every policy evaluation with its decision, and every trust score at the time of each inter-agent message. from agent_sre.replay.capture import TraceStore from agent_sre.replay.engine import ReplayEngine, ReplayMode # Traces are captured automatically when SRE tracing is active store = TraceStore( backend="azure_blob", retention_days=30, ) # When an incident occurs, replay the session exactly engine = ReplayEngine(store=store) # Full replay: re-run the session against the same recorded inputs # Uses recorded tool outputs -- no live tool calls -- so replay is deterministic result = await engine.replay( trace_id="trace_2026_05_a7f3b2", mode=ReplayMode.FULL, ) for step in result.steps: print(f"Step {step.index}: {step.action} -> {step.decision}") # Divergence analysis: replay with a policy change applied # Shows exactly which actions would have been blocked under the new policy diff_result = await engine.diff( trace_id="trace_2026_05_a7f3b2", policy_override="policies/stricter-v2.yaml", ) for diff in diff_result.diffs: if diff.description: print(f"Step {diff.span_name}: was {diff.original}, " f"would be {diff.replayed} under new policy") The divergence analysis is the feature teams use most. When a policy change is proposed, you replay recent production traces against the new policy to see how many actions would have been blocked, which sessions would have failed, and what the error budget impact would have been. Policy changes stop being guesswork. Progressive Delivery: Safely Rolling Out New Agent Capabilities When you ship a new service version, you do not send it to all traffic at once. You use canary deployments, feature flags, or traffic splitting. You watch the SLOs. If they degrade, you roll back. Agent SRE brings the same discipline to agent capability rollout. When you expand an agent's authorized scope, giving it write access it did not have, connecting it to a new tool, or raising its trust floor, you do not expand to the full fleet immediately. You expand progressively, with automated SLO gates controlling each stage. from agent_sre.delivery.rollout import ( AnalysisCriterion, CanaryRollout, RollbackCondition, RolloutStep, ) rollout = CanaryRollout( name="database-write-capability", steps=[ RolloutStep( name="canary", weight=0.05, # 5% of agents get the new capability duration_seconds=86400, # 24 hours analysis=[ AnalysisCriterion(metric="safety_sli", threshold=0.995), AnalysisCriterion(metric="performance_sli", threshold=0.90), AnalysisCriterion( metric="error_budget_consumed", threshold=0.10, comparator="lte", # canary can burn at most 10% ), ], ), RolloutStep( name="early-adopters", weight=0.25, # 25% traffic duration_seconds=172800, # 48 hours analysis=[ AnalysisCriterion(metric="safety_sli", threshold=0.990), AnalysisCriterion(metric="performance_sli", threshold=0.88), ], ), RolloutStep( name="general-availability", weight=1.0, # 100% traffic duration_seconds=604800, # 1 week of full observation analysis=[ AnalysisCriterion(metric="safety_sli", threshold=0.990), AnalysisCriterion(metric="performance_sli", threshold=0.85), ], ), ], rollback_conditions=[ RollbackCondition(metric="safety_sli", threshold=0.95, comparator="lte"), ], ) # Start the rollout -- SLO gates evaluate at each step rollout.start() # Advance to next step when analysis criteria pass if rollout.advance(): print(f"Advanced to step: {rollout.current_step.name}") print(f"Progress: {rollout.progress_percent:.0f}%") The SLO gate at each step is the same mechanism as a CI/CD quality gate, but measured on live production behavior rather than test results. An agent capability that degrades the safety SLI during canary does not promote to the next step. If a RollbackCondition fires, the rollout rolls back automatically. This is the mechanism that makes it operationally safe to expand agent autonomy: every expansion is measurable, every measurement gates the next expansion, and rollback is automatic. Health Checks and Backpressure Traditional health checks answer: is the service alive? For agents, alive is not enough. A healthy agent is one that is alive, operating within policy, consuming resources within budget, and maintaining a trust score above the Ring threshold it was assigned. # Agent health check covering multiple dimensions health = await agent_health_check( agent_id="analyst-agent-001", dimensions=[ "liveness", # Is the agent process running? "policy_compliance", # Is safety SLI above threshold? "trust_score", # Is trust score above Ring floor? "resource_budget", # Is token/API spend within limits? "tool_availability", # Are the tools the agent needs reachable? ], ) # health.status: "healthy" | "degraded" | "unhealthy" # health.dimensions: per-dimension pass/fail with values # health.recommended_action: "none" | "restrict" | "suspend" | "terminate" When health checks report degradation, backpressure controls engage before the circuit breaker opens. Backpressure is the earlier, softer response: accept fewer concurrent tasks, reject low-priority work, drain in-flight tasks gracefully before the situation escalates. # Backpressure configuration backpressure_config = { "backpressure_threshold": 0.80, # Engage when resource utilization > 80% "max_concurrent": 5, # Hard cap on simultaneous agent tasks "priority_shedding": True, # Drop low-priority tasks first "drain_timeout_seconds": 30, # Allow in-flight tasks to complete } The ordering matters: backpressure first, then circuit breaker, then suspension. Each stage is recoverable. Each stage preserves more agent state than the next. The SRE principle of graduated response applies to agents exactly as it applies to services. Observability: Governance Metrics Flow Into Your Existing Stack Agent SRE does not ask you to adopt a new observability platform. Governance metrics are exported through the same adapters your infrastructure monitoring already uses, including OpenTelemetry, Prometheus, Datadog, and others. from agent_sre.tracing.exporters import configure_exporters configure_exporters( backends=[ {"type": "prometheus", "endpoint": "http://prometheus:9090"}, {"type": "opentelemetry", "endpoint": "http://otel-collector:4317"}, ], include_metrics=[ "slo.safety_sli", # Per-agent safety compliance rate "slo.error_budget_remaining", # Error budget in percentage "slo.burn_rate", # Current burn rate vs sustainable "circuit_breaker.state", # CLOSED / OPEN / HALF_OPEN "circuit_breaker.failure_count", "trust_score.current", # Agent trust score (0-1000) "trust_score.ring", # Current execution ring "chaos.experiments_run", # Chaos experiment telemetry "health.status", # Aggregate health status "backpressure.load", # Current load vs threshold ], ) Key governance metrics available in your existing dashboards: Metric What It Tells You Alert Condition slo.safety_sli Fraction of agent actions within policy < 0.99 slo.burn_rate Rate at which error budget is consumed > 2.0 (warn), > 5.0 (page) slo.error_budget_remaining Budget left for the SLO window < 20% circuit_breaker.state Current breaker state per agent OPEN or HALF_OPEN trust_score.ring Execution ring (privilege level) Ring 3 (untrusted) health.status Aggregate health across all dimensions degraded or unhealthy If you are already running Grafana dashboards for your services, a governance dashboard for your agent fleet is a new data source and a new set of panels, not a new monitoring stack. The SRE Mental Model for Agents: Four New Concepts Everything in Agent SRE is built on the SRE mental model you already have, extended with four concepts that adapt traditional reliability thinking for autonomous systems: Traditional SRE Agent SRE Equivalent What Changes Latency SLI Safety SLI Correctness of *action*, not speed of *response* Error budget Autonomy budget Burns on policy violations, not just errors Circuit breaker Behavioral circuit breaker Opens on wrong *behavior*, not just failure codes Canary deployment Capability rollout Rolls out *scope*, not just code The governance insight is that error budgets work in both directions for agents. A service's error budget only decreases. An agent's autonomy is also a budget: it grows when the safety SLI is strong and shrinks when it degrades. The error budget mechanism becomes the operational mechanism for expanding and contracting agent autonomy in response to evidence, which is exactly what regulated industries and risk-averse enterprise teams need before they will trust an autonomous agent with consequential actions. Getting Started with Agent SRE pip install agent-sre A minimal Agent SRE integration requires three things: a safety SLO definition, a circuit breaker, and a health check. The progressive delivery and chaos engineering features layer on top when you are ready for them. from agent_sre import SLO, ErrorBudget from agent_sre.slo.indicators import TaskSuccessRate from agent_sre.cascade.circuit_breaker import CircuitBreakerConfig, CircuitBreaker # Step 1: Define your safety SLO slo = SLO( name="production-safety", indicators=[TaskSuccessRate(target=0.99, window="24h")], error_budget=ErrorBudget(total=0.01, burn_rate_alert=2.0, burn_rate_critical=5.0), ) # Step 2: Configure a circuit breaker breaker_config = CircuitBreakerConfig( failure_threshold=5, recovery_timeout_seconds=60, half_open_max_calls=3, ) breaker = CircuitBreaker(agent_id="my-agent", config=breaker_config) # Step 3: Wire into your existing agent loop async def governed_agent_loop(agent, task): # Check health first if not await agent_is_healthy(agent.id): return {"error": "agent suspended", "reason": "health check failed"} # Run within circuit breaker protection async with breaker: result = await agent.run(task) slo.record_event(good=result.policy_compliant) return result The quickstart in the repository walks through a complete setup with safety SLOs, circuit breakers, and a Prometheus dashboard export in under 50 lines. Why This Matters Most AI observability tools today focus on what you might call model quality: hallucination rate, latency, token cost, task completion. These are useful metrics. They are not SRE metrics. They do not answer whether the agent acted within its authorized scope, whether its behavioral error budget is burning at a dangerous rate, or whether it would survive the LLM provider going down. Agent SRE answers those questions using the operational vocabulary that SRE teams already understand: SLOs, error budgets, circuit breakers, chaos experiments, and health checks. The goal is not to replace your observability stack. It is to make agent governance visible inside it. The reliability of an autonomous agent is not a property of the model. It is a property of the governance infrastructure around it. Agent SRE is that infrastructure. Resources GitHub: github.com/microsoft/agent-governance-toolkit Install: pip install agent-sre Tutorials: 40+ tutorials including dedicated Agent SRE walkthroughs for SLO setup, chaos experiments, and progressive delivery Architecture reference: ARCHITECTURE.md OWASP compliance mapping: OWASP-COMPLIANCE.md -- Agent SRE addresses ASI-08 (Cascading Failures) directly through circuit breakers and SLO-based fault detection Part 1 -- Runtime governance: Policy engines, trust, and SRE overview Part 2 -- Shift-left governance: Catching violations before production Part 3 -- Post-hoc accountability: After the agent acts The Agent Governance Toolkit is an open-source project released under the MIT License. All features described in this post are available in the public repository. The `agent-sre` package is currently in public preview; APIs may change before general availability. Questions about Agent SRE in your environment? Open an issue at aka.ms/agent-governance-toolkit or start a discussion in the comments below.892Views1like1Comment
Red Hat Enterprise Linux Software Reservations Now Available
What's New After careful collaboration with Red Hat, we've updated our RHEL pay-as-you-go billing meters and reservation pricing to align with Red Hat's latest pricing model. These updates address previous billing meter issues and ensure an accurate, transparent experience for our customers. Starting today, customers can purchase RHEL software reservations on Azure with updated pricing, allowing organizations to reduce their Linux workload costs with the flexibility and reliability of software reservations. Key Benefits of RHEL Software Reservations Cost savings: Save up to 24% compared to pay-as-you-go pricing by committing to a one-year term Predictable costs: Lock in pricing for your RHEL workloads and optimize your cloud budget Pricing clarity: Updated meters aligned with Red Hat's current pricing model Seamless Azure integration: Manage your RHEL software reservations alongside other Azure resources. RHEL software reservations allow you to pre-purchase RHEL software capacity at a discounted rate, delivering significant savings over standard pay-as-you-go pricing. Get Started Today RHEL software reservations are available now on the Azure portal. To learn more about pricing, terms, and how to purchase them, visit the following pages: Pricing - Linux Virtual Machines | Microsoft Azure Prepay for software plans - Azure Reservations - Azure Virtual Machines | Microsoft Learn Red Hat reservation plan discounts - Azure - Microsoft Cost Management | Microsoft Learn What are Azure Reservations? - Microsoft Cost Management | Microsoft Learn We're committed to providing transparent, reliable billing for all Azure services and appreciate your continued partnership as we deliver the best cloud platform for your open-source workloads. For questions or support, please contact Azure Support or your Microsoft account team.935Views1like0Comments