postgresql perspectives
6 TopicsWhy Microsoft contributes to Postgres: What I tell people
Last week at PGConf.EU in Valencia, I gave a talk about the Postgres work being done at Microsoft (slides here). Getting ready for that talk, I kept noticing how much has changed in the Postgres team at Microsoft in the last 8 years. When I joined Microsoft through the Citus Data acquisition in early 2019, Microsoft contributed to Postgres in only one of the 9 ways it does today: our Azure Database for PostgreSQL managed service. We weren't sponsoring Postgres community conferences. We weren't sharing our expertise via blog posts and conference talks. We didn't have a Postgres open source contributors team. We didn't have a monthly podcast. And POSETTE: An Event for Postgres didn’t exist yet. It's heartwarming to see how far we've come. But sometimes, when I'm meeting people new to open source—especially those with a more proprietary software background—they will ask: “Why does Microsoft contribute to the Postgres open source project?” And when they learn my job is to lead our Postgres community efforts, they'll ask: “How do you know your open source work drives revenue?” Here's what I tell people about why Microsoft contributes to Postgres. Contributing upstream makes Postgres better for everyone, including Azure customers In my PGConf.EU 2026 talk, I used a slide like the one below to show how upstream and downstream fit together. Open source people use the “upstream” and “downstream” terms all the time, but they're not obvious to everyone. Quick definition: the upstream project is the Postgres open source project itself. Downstream services, like Azure Database for PostgreSQL and Azure HorizonDB, are built on top of it. Figure 1: Slide from my talk at PGConf.EU 2026, depicting the upstream Postgres open source project and our downstream managed services on Azure. If you run a Postgres managed service, you depend on Postgres—and we believe that means you have a responsibility to give back. So since 2019, we’ve been building a Postgres open source contributors team, to do our part to keep Postgres healthy for the long haul. And our upstream work benefits everyone who uses Postgres, including our downstream Azure customers. What might not be obvious: the things we learn running a Postgres service on Azure help the Postgres project too. When our engineers find a bug in Postgres while running it on Azure, they fix it upstream, which benefits Postgres users everywhere. Even open source developers need to eat Back in 2023 I wrote a meaty treatise of a blog post (complete with a hand-drawn infographic) about all the Postgres work happening at Microsoft. In that post, I included a section on why Microsoft has been building a team of Postgres contributors whose main focus is the upstream project. My answer to “why” hasn’t changed—I’ve included it in every edition of the annual what’s new blog post since, including the 2026 edition of What’s new with Postgres at Microsoft: In order to thrive, an open source ecosystem needs commercial support as well as volunteer efforts. Even open source developers need to eat! For the Postgres open source ecosystem to flourish, companies like Microsoft need to support the project by funding development in the Postgres core. Which we do. PostgreSQL is a complex piece of software that runs mission-critical workloads across the globe. To provide the best possible experience on Azure, it follows that we need to thoroughly understand how it works. By having PostgreSQL committers and contributors on our team, they can share knowledge internally across different orgs, or directly answer internal questions regarding incidents or extension development. Because today's cloud operates at a scale most on-prem solutions never encountered, unique cloud data center problems, often relating to performance, now require special attention. Our in-house team of deep Postgres experts are focused on tackling these cloud-scale issues upstream, in the Postgres core. Another benefit: our team's Postgres expertise gives Azure customers confidence in our cloud database services, too. Commercial funding of PostgreSQL developers has another benefit: it gives developers the long-term stability to pursue the big things, the groundbreaking changes that are super important to the future. In particular, the Postgres contributor team at Microsoft is focused on some big architectural changes (example: Asynchronous IO) that you wouldn’t be able to do without the funding for a full-time, multi-year effort. Example: one of those groundbreaking Postgres changes I mentioned landed last year: Asynchronous IO shipped in Postgres 18 and continues to evolve in Postgres 19 on forward. If I were writing those 2023 words above fresh today, I’d add one more reason: The Postgres project is about more than code. The project also runs on docs, the build farm, web infrastructure, packaging, translations, mentoring, conferences, trademark protection, the extension ecosystem, meetups, and more. That’s why our Postgres team contributes to the project in all sorts of ways beyond code. Nine ways Microsoft contributes to Postgres When explaining to people why we have a team dedicated to the upstream Postgres project, it helps to see how we contribute to the broader Postgres ecosystem—both our work on the Postgres code and community, and our managed services on Azure. So let’s walk through nine of the ways our team is contributing today. Figure 2: Infographic of 9 of the ways our team at Microsoft is contributing to the Postgres ecosystem. Clockwise, starting with our code contributions: Upstream Contributions to Postgres: Microsoft employs a dedicated team of Postgres committers and contributors working directly on upstream Postgres—plus a team working on open-source extensions such as Citus. While many of us believe commits are not a perfect measure of impact, they are a metric we have and they do give you a feel for scope. In the first release candidate of Postgres 19 (RC1), Microsoft’s team contributed 15% of the author commits (631 out of 4,098) and 17% of patch reviews (1,232 out of 7,240). The Microsoft team’s work spans performance, query planner, Async IO, security, and more. (Postgres 19 release notes) Supporting Postgres Events: Microsoft sponsors, and helps to organize, PostgreSQL community conferences and user groups worldwide. In the last year we sponsored 16 Postgres conferences, including PGConf.EU, PGConf.dev, PGConf India, and Postgres Summit US. Our team also shows up as speakers and program committee members. And several people on our team volunteer their time to co-organize conferences too: Daniel Gustafsson with Nordic PGDay; Melanie Plageman with PGConf.dev; Tomas Vondra with Prague PostgreSQL Developers Day (P2D2); and Cornelia Biacsics with PostgreSQL Conference Germany. Benefactor Sponsor of PGCA & the PostgreSQL project: Earlier this year, Microsoft made a benefactor donation to the PostgreSQL Community Association (PGCA), a non-profit chartered by the PostgreSQL core team in 2011 to protect and defend the Postgres trademarks. Full disclosure: I wear two hats here: I serve on the PGCA Board of Directors, and I work at Microsoft. With my PGCA hat on, I’m so appreciative of Microsoft’s support for the PGCA mission. (PGCA Sponsors) Visual Studio Code Extension for PostgreSQL: Lets you work with Postgres right inside VS Code. Over 785K installs, and it works with any Postgres database, not just Azure. (aka.ms/pgsql-vscode) POSETTE: An Event for Postgres: Free and virtual developer event with expert speakers from the Postgres ecosystem, now in its 6 th year. POSETTE 2027 will happen on 30 and 31 March 2027. (PosetteConf.com/2027) Azure Database for PostgreSQL: Our fully-managed database as a service, supporting the latest releases of Postgres open source. One thing I’m particularly happy to see: we supported Postgres 17 within 3 days of its release, and Postgres 18 on release day. With Postgres 19, we expect to support it on release day for both new servers and Major Version Upgrade. (aka.ms/azure-postgres-docs) Azure HorizonDB: Currently in preview, Azure HorizonDB is a new PostgreSQL-compatible database service built on a shared storage architecture, for applications that need to scale. (aka.ms/azure-horizondb-docs) Microsoft Blog for PostgreSQL: Our blog about Postgres, Azure, and our Postgres community initiatives. (aka.ms/microsoft-blog-postgres) Talking Postgres podcast: A monthly podcast about the people who work on Postgres and why they do what they do. I have the privilege of hosting it, and it’s so much fun. 44 episodes to date. (TalkingPostgres.com) And there’s more! Beyond the nine, our team keeps releasing new open-source tools for the Postgres community. Two recent ones: pghacker-mcp: This open-source MCP server lets you get answers to questions about Postgres’s design history and source code, with citations. Ask why a feature works the way it does, and an agent finds the relevant pgsql-hackers mailing list threads, commits, and code that answer it, and quotes them. (pghacker-mcp.dev) pg_durable: An open-source Postgres extension that lets you write long-running, fault-tolerant SQL functions, with retries and scheduling built in. It’s handy for things like ETL, database maintenance, and AI apps. Our team uses pg_durable in AI pipelines, Oracle to Postgres migrations, and pg_textsearch. (aka.ms/pg_durable) The revenue impact of upstream work is indirect—but it’s real Which brings me back to the question new hires ask me the most, especially if they come from a proprietary software background: Question: “How do we know our work on the upstream Postgres project moves the needle on Azure revenue?” My answer: The revenue impact of our open source work is indirect. And while it can't easily be measured, it's real. That's true of the patches our engineers write, and it's true of the podcast, POSETTE, and the conferences we sponsor. You can't trace most commits to a dollar of revenue, any more than you can trace a conference talk to one. Here's the thing: Azure Database for PostgreSQL and Azure HorizonDB are built on Postgres. As the Postgres project continues to thrive and grow, so do our Azure services. It all starts with people When we help make Postgres better, everyone who uses Postgres benefits, including our Azure customers. On the Talking Postgres podcast we sometimes talk about the toothbrush test: when you brush your teeth in the morning, are you looking forward to the work you'll be doing that day? My work leading our Postgres community efforts at Microsoft definitely passes the toothbrush test. 😊 And the biggest reason is the people. In my talk at PGConf.EU I said that Microsoft’s investment in the Postgres project starts with people. And the inspiration for my Postgres community work also starts with people: the people in the broader Postgres open source community, and my Postgres teammates at Microsoft. : Slide from my talk at PGConf.EU 2026 about Microsoft’s work with Postgres, with headshots of the people contributing to the upstream Postgres open source project—who inspire me every day. About Microsoft's Perspectives on PostgreSQL Perspectives on PostgreSQL is a monthly blog series featuring insights from Microsoft engineers, contributors, and builders working with PostgreSQL. Explore more articles on the Microsoft for PostgreSQL blog.1.9KViews3likes0CommentsWhy PostgreSQL Still Inspires Builders
The PostgreSQL project turned 30 years old in July. As it enters middle-age, developers and builders rely on it more today than ever. In the crowded and competitive SQL database market, what is driving this popularity? PostgreSQL is a great fully featured database, but it’s not clearly better than the alternatives (SQL Server, MySQL, Oracle) on performance benchmarks or in feature-by-feature comparisons. Its popularity stems from other factors: the community’s focus on reliability and stability, and its open governance and lenient licensing. Together these qualities of PostgreSQL have spawned an ecosystem of extensions and forks built around its stable core. A stable open core My claim that PostgreSQL is more reliable than other databases is based on my experience and not on any hard data. I don’t know of any rigorous study on the count and severity of regressions in new releases of different database engines. Companies love to show off their TPC-C benchmark performance numbers, but we don’t have such an easily measurable metric for reliability. I’ve written code for a few different database engines in my engineering career (SQL Server, MemSQL/Singlestore in the MySQL ecosystem, and Azure HorizonDB in the PostgreSQL ecosystem). Of those, PostgreSQL is on the more conservative, careful and rigorous end of the engineering spectrum. The PostgreSQL committers may move a little more slowly when adding new features, but they move with great care. PostgreSQL’s open and independent governance model prevents a single company from dominating its evolution. That said, large companies such as Microsoft and Amazon employ teams of engineers whose job is writing open-source PostgreSQL engine code (not working on proprietary closed source forks for their respective companies). Application developers have learned to expect a steady stream of new features year after year as a result. PostgreSQL can run on a laptop, your own server running a variety of different operating systems, or on any of a dozen different PostgreSQL cloud services (see Table 1 below). It’s the database that gives builders the most choice and least single vendor lock-in. Built to extend and fork The PostgreSQL source code is also an important building block in many PostgreSQL derived databases and services. Folks building applications in the PostgreSQL ecosystem have a broad choice of vendors and systems. PostgreSQL’s permissive license makes it the most forked open-source database engine. There are forks that specialize in data warehousing, distributed SQL and cloud native OLTP. Its code base is a building block generating billions in revenues across the global economy for various companies. The table below shows some of the PostgreSQL compatible databases or services in production today. They include more specialized forks built to handle use cases that community Postgres is not as good at (i.e., data warehousing) as well as services that run mostly unmodified Postgres as a cloud service. The databases in bold are available on Azure. Category Product/Service Name Compatibility Cloud Native OLTP Azure HorizonDB, AWS Aurora PostgreSQL, Google AlloyDB, Neon, PolarDB PostgreSQL forks designed to run on top of specialized WAL and page storage services enabling lower latency writes, faster failovers, storage auto grow/shrink, efficient read scale out etc. Managed OLTP Services Azure Database for PostgreSQL AWS RDS PostgreSQL, Google CloudSQL PostgreSQL, Supabase, Crunchy Data Run mostly unmodified PostgreSQL as a service attached to off-the-shelf cloud storage (managed disks) and virtual machines Distributed SQL extensions or forks CitusDB (Azure PostgreSQL Elastic Clusters), YugabyteDB, Aurora DSQL, Aurora Limitless Shard data across a cluster of machines with a PostgreSQL compatible distributed query layer on top enabling read and write scale out. Distributed SQL with Postgres compatibility Google Spanner, CockroachDB These are not Postgres forks, but are sharded databases that aim for PostgreSQL query and wire compatibility Data warehousing extensions or forks Greenplum, ParAccel (powers AWS Redshift), Aster Data, TimescaleDB Postgres forks that add parallel query processing and column stores for data warehousing Document database forks or extensions Azure DocumentDB, FerretDB MongoDB compatibility layer on top of Postgres storage Table 1 – Postgres based databases or services; Not an exhaustive list. For more see PostgreSQL derived databases - PostgreSQL wiki No other open-source database has as many successful product offerings based on its source code or its query and wire protocols. MySQL would be a distant second place as far as number of derived databases or services. The databases listed above aren’t all fully compatible with community PostgreSQL, but many are highly compatible. Postgres on Azure At Azure, we’ve built three services around PostgreSQL shown in bold in Table 1 Azure Database for PostgreSQL runs Postgres on Azure virtual machines and Azure managed disks managing backups, high availability, and geo-replica’s as needed. It offers the Citus extension (via the Elastic Clusters configuration) to shard data across a cluster of Postgres worker machines to scale out writes and reads as needed. Azure HorizonDB extends the core PostgreSQL engine with a custom storage layer that has specialized WAL and page services improving performance, reliability and scalability. It frees up Postgres to run queries and transactions by pushing the work to make data durable and highly available into the storage layer (replication, checkpointing, WAL archival, etc.). Azure DocumentDB gives customers the option to build apps against a MongoDB compatible service on top of PostgreSQL’s solid foundation. So, thank you to the PostgreSQL developers (and community) for the hard work they’ve put in over three decades. The family of Postgres derivative or compatible databases wouldn’t exist with their foundational work. Choosing Postgres gives builders the confidence they’re building on a mature, reliable and flexible foundation. Who knows where a new fork or extension may take Postgres in the future. About PostgreSQL Perspectives PostgreSQL Perspectives is a monthly blog series featuring insights from Microsoft engineers, contributors, and builders working with PostgreSQL. Explore more articles on the Microsoft for PostgreSQL blog.519Views4likes0CommentsA Single View of Your PostgreSQL Estate: Database Hub in Public Preview
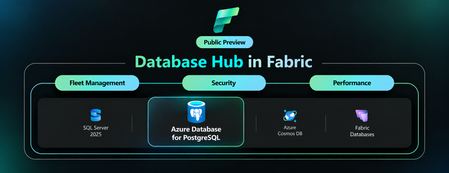
By Varun Dhawan, Matt McFarland, Erdem Tuna from Microsoft PostgreSQL team Azure Database for PostgreSQL support in Database Hub is now in public preview, bringing fleet visibility, security posture, and performance monitoring into one place. This preview is part of the broader vision outlined in our SQLCon Barcelona 2026 announcement: bringing database signals together so teams can see where attention is needed and take a well-informed next step. Here, we focus on the Azure PostgreSQL experience in Database Hub. Database Hub in Microsoft Fabric lets you monitor existing flexible servers in their Azure subscriptions and regions, without moving or mirroring data or building a new customer-managed telemetry pipeline. Baseline monitoring uses existing Azure Monitor metrics. Available capabilities vary by database service. Start with a practical question: Which PostgreSQL servers show sustained memory pressure, and which should I investigate first? Follow the three views below to narrow the scope and compare trends. See the PostgreSQL monitoring guide for setup and preview details. 1. Start with an estate-wide Overview Overview brings cross-engine findings and performance summaries into one starting point. Spot a signal worth investigating, such as elevated PostgreSQL memory usage, then open Estate to focus on the relevant resources. Figure 1: Overview combines cross-engine findings with performance summaries, including PostgreSQL, to help prioritize investigation. Illustrative mockup with sample data. 2. Focus on your Azure PostgreSQL estate In Estate, select the PostgreSQL view and filter by subscription or resource group to define the scope for the memory-pressure investigation. Compare the flexible servers you can access before choosing resources to examine: Filter your PostgreSQL estate by subscription or resource group to focus on the servers you manage. Review a flexible server's resource details in one place. The inventory represents server instances, not each database hosted inside them. Save and share a custom view for a scope you revisit regularly. Colleagues see only the resources their existing permissions allow. Figure 2: Estate filtered to PostgreSQL, bringing flexible server resources, status, findings, and subscription context into one inventory. Illustrative mockup with sample data. Once you have scoped your estate, switch to Performance and select the PostgreSQL servers you want to investigate. 3. Review security posture and performance Security posture In public preview, Database Hub assesses four aspects of your Azure PostgreSQL security configuration: Microsoft Entra authentication: identify servers where it is not enabled. Encryption at rest using customer-managed keys: review key management against your organization's policy. A server using service-managed keys is still encrypted at rest. Microsoft Entra authentication enforced: review whether Microsoft Entra authentication is required, rather than only available as an option. Public Network Access Disabled: review public exposure against your network policy. The private networking guidance explains the virtual network integration option. Performance monitoring In Performance, select the PostgreSQL dashboard and use CPU, memory, and storage summaries to identify servers that need a closer look. You can also review disk activity, connections, failed connections, and applicable read-replica lag. For the memory-pressure question, compare server trends over the same interval to distinguish sustained pressure from a brief spike. Use the Azure Monitor metric reference to match units and aggregation. Missing data is not proof of good health. Figure 3: Performance monitoring with PostgreSQL selected, illustrating utilization summaries and trends for closer investigation. Illustrative mockup with sample data. When a server needs a deeper look, continue in the Azure portal and PostgreSQL tools using the monitoring and diagnostics guidance. Preview scope: Monitoring is metric-based; query-level diagnostics remain in native PostgreSQL tools. Security findings are not a complete compliance audit. Database Hub does not automatically tune, resize, or remediate PostgreSQL servers. Check the servers selected in Performance: dashboard scope can differ from the Estate inventory. Why this matters if you run Postgres at scale Database Hub doesn't replace your PostgreSQL expertise or native tools. It reduces the work of finding which servers need attention, alongside your other supported database engines including SQL Database and Cosmos DB. The Database Hub FAQ explains the access boundaries and how the experiences fit together. Get started Review the Database Hub documentation and PostgreSQL prerequisites, then: Enable the preview: Ask your Fabric administrator to enable Users can access the Database hub (preview) in Tenant settings. Check access: Use a Microsoft Entra identity with Reader or greater permissions on each subscription containing the servers you want to monitor. Start here: open Database Hub in Microsoft Fabric. Scope your estate: In Estate, choose View: PostgreSQL and filter to the subscriptions or resource groups you manage. Compare servers: In Performance, select PostgreSQL, choose the servers to compare, and set the same time range and aggregation. Access boundary: Resource visibility and shared views do not grant permission to query databases. Existing PostgreSQL authentication and network controls still apply. As your PostgreSQL estate grows, Database Hub brings the bigger picture into focus, helping you see where attention is needed and take a more informed next step. We're excited to bring Azure PostgreSQL into this shared experience. Explore the public preview in Microsoft Fabric and discover a simpler way to stay on top of your PostgreSQL estate.500Views3likes2Comments
The need for a maintainer mindset in the age of LLMs
For a few years now, people have been predicting the end of software engineering as a profession. Matt Welsh argued in Communications of the ACM in 2023 that the conventional idea of writing a program was headed for extinction. In June, CACM ran a piece called "The End of the Coder?", which notes that the head of Claude Code at Anthropic says all his own code is now AI-generated and the profession isn’t about writing code anymore. Regardless of whether you think humans can write better code than LLMs, there is still work involved in committing a patch to PostgreSQL that people can do better than AI. As PostgreSQL committers, we have been reflecting on the need for a maintainer mindset in the age of LLMs. Asking the right questions LLMs can be a huge help in software development, but they need to be coupled with software maintainers who have a mental model of the system and a vision for the product. LLMs are specifically adept at finding bugs, but are best at this when guided by an experienced engineer. Index-only scans in Postgres are a powerful performance boost, but they rely on visibility information for tuples being up to date. In Postgres 19, there is a feature that enables SELECT queries to set the visibility map to allow index-only scans to be performed, in many cases without need for vacuum. It went through extensive testing and verification. But after commit, several oversights were discovered. For example, it neglected to update the free space map when setting the page all-visible, leading to bloat. So why weren’t these found during development? Many LLM models were used to review the code and perform adversarial testing, yet none found issues. It was found by maintainers analyzing the code armed with their own understanding of the system. Even as the LLM models improve, it’s easiest to guide them to identify bugs and discrepancies when you have a mental model of the system and can ask probing questions, and you know the likely failure modes. To develop that mental model, over the years, maintainers have spent countless hours studying the code, documenting function call stacks, and stepping through code paths. This foundation is what makes both developing and debugging committable code with LLMs work. Understanding users and designing interfaces These days, the prep work for starting a new Postgres project includes using an LLM to do analysis for how to implement a feature consistently. It might involve summarizing relevant mailing list discussions or surveying other similar cases in our code bases and other systems. While helpful, it isn’t a substitute for understanding users and their production needs. At a high level, how does this fit into Postgres as a whole? Is there user-visible surface area? Is it exposed in EXPLAIN? Do properties of the underlying tables matter to the implementation? How does it interact with replication? These questions need to be considered from both a technical as well as product angle. In 2024, there was a community discussion where a contributor reported that only the parallel leader's stats were being reported in parallel bitmap heap scan EXPLAIN. The contributor’s team had repeatedly drawn wrong conclusions in their query analysis because they assumed the reported block counts included the workers. A patch was proposed to fix it, and then there was extensive debate about what the right fix was. The debate was mostly not about the code. It was about what the output should mean. This kind of audit used to be done by hand. Today an LLM can do the audit, but the processing and analysis still takes time. The need for developing the mental model hasn't been replaced, only the tools at hand to do it. The fix was eventually to make the leader report its own count and a per-worker line beneath it. Committing the patch because it fixed the specific reported issue wasn't good enough: maintaining product quality requires looking at the wider picture and doing so in collaboration with users. Defining, essentially, how the feature should work. Widening scope Another area where LLMs can help software maintainers is surveying large codebases like Postgres and helping developers see a bigger picture rather than fixing issues in isolation. But even though it sounds cliché, LLMs are no substitute for judgment. Maintainers are responsible for knowing when a redesign or paradigm change is needed. There was recently another community discussion thread about partition indexes losing certain properties after a particular ALTER command. The participants used LLMs to survey other ALTER commands and other index properties and found that many were incorrectly dropped. Knowing all of these, the shape of the solution changed. Interrogating this, thinking about what kind of a system could prevent these omissions, what is the correct model, that takes time. You can instruct an LLM to look for other precedents, but ultimately a good portion of the work is the human judgment to think about if and how to change an existing precedent or introduce a new one that will better encompass all cases. You may need a new precedent: a bigger change that will prevent problems like this from happening again. Perhaps a new system could automate detection of omissions or fail when required components are omitted. LLMs learn from existing code, but humans are still responsible for determining when we should do something new. Postgres 19, LLMs, and the rise of good reproducers Many of the new features in Postgres 19 started their life a long time ago, as an idea in the head of a developer or through a discussion in the hallway at a conference. Some saw development long before AI tools were even available, but all of them have seen a tremendous amount of review and scrutiny thanks to LLMs. Many bugs have been identified, some features have been reverted, and the remaining features have been polished and stabilized late in the release. Online checksums, the ability to enable checksums on data pages in a running cluster, has been worked on for years, culminating in it being committed and then reverted from Postgres 19. Changing state synchronized across a distributed system is not easy, and bugs are often dependent on very small race condition windows. Being able to consistently reproduce errors is as helpful as it can be hard to achieve. This is an area where LLMs have filled a very important role. There was one bug in particular which broke the tests intermittently. Sometimes it took 5 runs, sometimes 500. The only common characteristic between test runs was inconsistency, and that it needed to be executed in a resource-constrained environment. Running the tests on a typical developer machine did not reproduce anything, making it even harder to observe. The window in question was, however, frustratingly hard to define. Eventually the bug was found through countless hours of reading logs and code. Since then, LLMs have become magnitudes better at creating tests, and bugs found since have often had a reproducer from the start. If this bug was found today, chances are we could have been able to focus on the fix and not the identification. Understanding every line Tempting as it may seem, the code generated by the LLM to reproduce the bug cannot be committed verbatim along with the fix. Every line of code must be read, understood, and checked for correctness. A lot is then also rewritten to improve readability, maintainability and match project style. LLMs tend to be verbose and encode all assumptions. This often has the effect of communicating nothing. Maintainers are responsible for understanding what is non-obvious and including only the important details. This time spent by maintainers saves the time of countless future developers. It is the developers who suffer the consequences of over-wrought tests and verbose comments. LLMs don’t care if tests take hours to run or if comments take minutes to read. Being able to describe the bug in plain prose, with references to code, is a skillset a maintainer grows as their knowledge of the system and code proves. Internalizing every line also builds a foundation for devising systemic change to push the project forward Trust still requires humans In his 1984 Turing Award lecture, Ken Thompson taught us that we cannot trust code we didn’t create ourselves. This is as true today as it was in 1984. The trust given by users of our software is a trust in the maintainers, not the lines of code. There is no free lunch, but when LLM tools are used to further our knowledge and help us see things we overlooked, perhaps we can at least have a subsidized meal. About PostgreSQL Perspectives PostgreSQL Perspectives is a monthly blog series featuring insights from Microsoft engineers, contributors, and builders working with PostgreSQL. Explore more articles on the Microsoft for PostgreSQL blog.399Views3likes0CommentsPrivate Database, Public Tools - Securing Azure Database for PostgreSQL Flexible Server Behind MCP
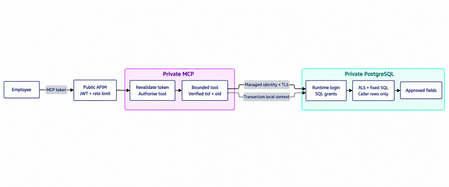
You locked Azure Database for PostgreSQL Flexible Server behind a private network. Congratulations, but a firewall can’t tell what your MCP server is about to do. One poisoned document, one over trusting agent, and your privileged app hands over the whole corporate summary. Politely. Legitimately. No breach required. The fix isn’t more walls. Verify who’s really asking. Swap raw SQL for tight business tools. Lock data down with least privilege and row level security. Treat the LLM as untrusted, and audit every decision. Stop asking “is the database private?” Start asking: who can make it talk, and what can walk out?100Views0likes0CommentsPostgreSQL 18 EXPLAIN Improvements
PostgreSQL 18 makes EXPLAIN more useful for real-world performance troubleshooting by exposing more of what happens during query execution. Beyond plan shape and execution time, it provides better visibility into buffer activity, repeated index access, memory and disk usage, WAL behavior, parallel execution, and window-function processing. This makes it easier to identify the actual source of a performance issue and make more targeted tuning decisions. In this blog, we’ll explore the key EXPLAIN improvements in PostgreSQL 18 and see how they can help diagnose performance issues more effectively. What’s New in PostgreSQL 18 EXPLAIN 1) BUFFERS Is Now Automatic with EXPLAIN ANALYZE Before PostgreSQL 18, EXPLAIN ANALYZE did not show buffer stats unless you explicitly added BUFFERS. EXPLAIN ANALYZE SELECT * FROM orders WHERE customer_id = 5001; EXPLAIN (ANALYZE, BUFFERS) SELECT * FROM orders WHERE customer_id = 5001; PostgreSQL 18 makes EXPLAIN ANALYZE more useful by including buffer statistics automatically. This helps reveal what execution time alone cannot: where the data is coming from. shared hit=120 read=12500 → disk-heavy shared hit=12500 read=120 → cache-heavy When investigating performance, correlate time, rows/loops, and buffer activity. The following example creates a large table with multiple rows per customer and uses an index to retrieve one customer’s rows. We then run the same EXPLAIN ANALYZE query in PostgreSQL 17 and PostgreSQL 18. -- Setup CREATE TABLE buffer_test (id INT, customer_id INT); INSERT INTO buffer_test SELECT x, (x % 10000) + 1 FROM generate_series(1,1000000) x; CREATE INDEX ON buffer_test(customer_id); VACUUM ANALYZE buffer_test; EXPLAIN (ANALYZE, COSTS OFF, TIMING OFF) SELECT * FROM buffer_test WHERE customer_id = 5001; EXPLAIN Output PG 17 Bitmap Heap Scan on buffer_test (actual rows=100 loops=1) Recheck Cond: (customer_id = 5001) Heap Blocks: exact=100 -> Bitmap Index Scan on buffer_test_customer_id_idx (actual rows=100 loops=1) Index Cond: (customer_id = 5001) Planning Time: 0.076 ms Execution Time: 0.225 ms (7rows) EXPLAIN output PG 18 Bitmap Heap Scan on buffer_test (actual rows=100.00 loops=1) Recheck Cond: (customer_id = 5001) Heap Blocks: exact=100 Buffers: shared hit=103 -> Bitmap Index Scan on buffer_test_customer_id_idx (actual rows=100.00 loops=1) Index Cond: (customer_id = 5001) Index Searches: 1 Buffers: shared hit=3 Planning: Buffers: shared hit=6 Planning Time: 0.097 ms Execution Time: 0.142 ms (12 rows) In the PostgreSQL 18 output, focus on Buffers: shared hit and shared read to determine whether the query is primarily using cached pages or reading from storage. A high read count may indicate an I/O-heavy execution, while a high hit count indicates that most pages were already available in shared buffers. A query with substantial physical reads may be more I/O-sensitive, while high shared hits indicate the required pages were already cached. 2) Index Search Counts (Index Searches) PostgreSQL 18 adds Index Searches to show how many separate index searches were performed by an index scan. This is especially useful for nested loop joins, where an inner index scan may be searched repeatedly for rows produced by the outer side. The following example joins customers_idx with orders_idx. The query retrieves 10 customers, and for each customer PostgreSQL searches the orders index for matching rows. This makes it easy to see how PostgreSQL 18 exposes repeated index access that was not directly visible in PostgreSQL 17. -- Setup CREATE TABLE customers_idx ( id INT PRIMARY KEY ); CREATE TABLE orders_idx ( id INT, customer_id INT ); INSERT INTO customers_idx SELECT x FROM generate_series(1,1000) x; INSERT INTO orders_idx SELECT x, (x % 1000) + 1 FROM generate_series(1,100000) x; CREATE INDEX orders_customer_idx ON orders_idx(customer_id); VACUUM ANALYZE customers_idx; VACUUM ANALYZE orders_idx; EXPLAIN (ANALYZE, COSTS OFF, TIMING OFF) SELECT c.id, o.id FROM customers_idx c JOIN orders_idx o ON o.customer_id = c.id WHERE c.id <= 10; EXPLAIN Output PG 17 Nested Loop (actual rows=1000 loops=1) -> Index Only Scan using customers_idx_pkey on customers_idx c (actual rows=10 loops=1) Index Cond: (id <= 10) Heap Fetches: 0 -> Bitmap Heap Scan on orders_idx o (actual rows=100 loops=10) Recheck Cond: (c.id = customer_id) Heap Blocks: exact=1000 -> Bitmap Index Scan on orders_customer_idx (actual rows=100 loops=10) Index Cond: (customer_id = c.id) Planning Time: 0.305 ms Execution Time: 0.666 ms (11 rows) EXPLAIN Output PG 18 Nested Loop (actual rows=1000.00 loops=1) Buffers: shared hit=1023 -> Index Only Scan using customers_idx_pkey on customers_idx c (actual rows=10.00 loops=1) Index Cond: (id <= 10) Heap Fetches: 0 Index Searches: 1 Buffers: shared hit=3 -> Bitmap Heap Scan on orders_idx o (actual rows=100.00 loops=10) Recheck Cond: (c.id = customer_id) Heap Blocks: exact=1000 Buffers: shared hit=1020 -> Bitmap Index Scan on orders_customer_idx (actual rows=100.00 loops=10) Index Cond: (customer_id = c.id) Index Searches: 10 Buffers: shared hit=20 Planning: Buffers: shared hit=77 read=3 Planning Time: 0.362 ms Execution Time: 0.590 ms (19 rows) Compare Index Searches with loops, actual rows, and Buffers. Here, the inner index is searched 10 times, exposing the repeated index probes performed by the nested loop. A high Index Searches count can reveal expensive repeated index access and help determine whether the join strategy, indexing, or query structure should be reviewed. 3) Fractional Actual Row Counts EXPLAIN now supports fractional row averages for repeatedly executed nodes, for example: rows=0.25 loops=1000 This is not “partial rows”; it is average output per execution. It helps reveal behavior in: nested loops parameterized scans correlated subqueries selective joins The following example uses a correlated subquery that executes repeatedly but returns a row only for a fraction of those executions. PostgreSQL 18 preserves fractional actual rows values, providing a more accurate picture of how often the node produces a result. -- Setup: CREATE TABLE frac_outer (id INT PRIMARY KEY); CREATE TABLE frac_inner (id INT PRIMARY KEY,value TEXT); INSERT INTO frac_outer SELECT x FROM generate_series(1,1000) x; -- Only 1 out of every 4 outer rows has a match INSERT INTO frac_inner SELECT x, 'match' FROM generate_series(4,1000,4) x; EXPLAIN (ANALYZE, COSTS OFF, TIMING OFF) SELECT o.id, (SELECT i.value FROM frac_inner i WHERE i.id = o.id) FROM frac_outer o; EXPLAIN Output PG 17: Seq Scan on frac_outer o (actual rows=1000 loops=1) SubPlan 1 -> Index Scan using frac_inner_pkey on frac_inner i (actual rows=0 loops=1000) Index Cond: (id = o.id) Planning Time: 0.082 ms Execution Time: 0.790 ms (6 rows) EXPLAIN Output PG 18 Seq Scan on frac_outer o (actual rows=1000.00 loops=1) Buffers: shared hit=1255 SubPlan 1 -> Index Scan using frac_inner_pkey on frac_inner i (actual rows=0.25 loops=1000) Index Cond: (id = o.id) Index Searches: 1000 Buffers: shared hit=1250 Planning: Buffers: shared hit=27 Planning Time: 0.190 ms Execution Time: 0.752 ms (11 rows) Compare actual rows with loops. An actual rows=0.25 over 1,000 loops indicates that the node returns a row on average once every four executions. This is useful when troubleshooting nested loops and correlated subqueries where rounding the average to zero can hide meaningful execution behavior. 4) Better Memory/Disk Visibility for More Nodes PostgreSQL 18 extends memory and disk reporting to Material, Window Aggregate, and CTE-related nodes. This helps identify when growing intermediate results start using disk and cause query performance to degrade. Rather than immediately increasing work_mem, use EXPLAIN ANALYZE to determine which node is consuming resources and why. The following query calculates a running total over one million rows with work_mem intentionally limited to 1 MB. This creates memory pressure and causes the Sort operation to spill to disk, making it easier to see how PostgreSQL 18 identifies resource usage at individual plan nodes. -- Setup CREATE TABLE memory_test (id INT, dept_id INT, amount NUMERIC); INSERT INTO memory_test SELECT x, (x % 10) + 1, random() * 1000 FROM generate_series(1,1000000) x; VACUUM ANALYZE memory_test; SET work_mem = '1MB'; EXPLAIN (ANALYZE, COSTS OFF, TIMING OFF) SELECT id, dept_id,amount, SUM(amount) OVER ( PARTITION BY dept_id ORDER BY id) FROM memory_test; EXPLAIN Output PG 17 WindowAgg (actual rows=1000000 loops=1) -> Sort (actual rows=1000000 loops=1) Sort Key: dept_id, id Sort Method: external merge Disk: 28592kB -> Seq Scan on memory_test (actual rows=1000000 loops=1) Planning Time: 0.159 ms Execution Time: 1069.011 ms (7 rows) EXPLAIN Output PG 18 WindowAgg (actual rows=1000000.00 loops=1) Window: w1 AS (PARTITION BY dept_id ORDER BY id) Storage: Memory Maximum Storage: 17kB Buffers: shared hit=6371, temp read=10716 written=10781 -> Sort (actual rows=1000000.00 loops=1) Sort Key: dept_id, id Sort Method: external merge Disk: 28592kB Buffers: shared hit=6371, temp read=10716 written=10781 -> Seq Scan on memory_test (actual rows=1000000.00 loops=1) Buffers: shared hit=6370 Planning Time: 0.055 ms Execution Time: 1129.466 ms (12 rows) The WindowAgg uses only 17 KB, while the Sort spills about 28 MB to disk. This clearly identifies the Sort, rather than the WindowAgg, as the source of the disk spill. This additional visibility helps pinpoint the resource-intensive node before making tuning changes such as increasing work_mem. 5) Better WAL Visibility (buffers full) For write-heavy statements, PostgreSQL already supports: EXPLAIN (ANALYZE, WAL) UPDATE ...; PostgreSQL 18 adds another signal: how often WAL buffers became full. Look at WAL as a set: Records : WAL records generated Fpi : Full-page images written to WAL Bytes : Total WAL volume generated buffers full : Number of times WAL buffers became full rows modified: Number of rows affected by the operation This is useful for bulk UPDATE/DELETE/INSERT diagnostics and replication-impact analysis. The following example updates 250,000 rows after a checkpoint, generating substantial WAL activity. -- Setup CREATE TABLE wal_test (id INT PRIMARY KEY,status INT,payload TEXT); INSERT INTO wal_test SELECT x, 0, repeat('x', 500) FROM generate_series(1,500000) x; VACUUM ANALYZE wal_test; CHECKPOINT; EXPLAIN (ANALYZE, WAL, COSTS OFF, TIMING OFF) UPDATE wal_test SET status = 1 WHERE id <= 250000; EXPLAIN Output PG 17 Update on wal_test (actual rows=0 loops=1) WAL: records=753424 fpi=17365 bytes=187303863 -> Index Scan using wal_test_pkey on wal_test (actual rows=250000 loops=1) Index Cond: (id <= 250000) Planning Time: 0.231 ms Execution Time: 2105.951 ms (6 rows) EXPLAIN Output PG 18 Update on wal_test (actual rows=0.00 loops=1) Buffers: shared hit=1821461 dirtied=34716 written=17355 WAL: records=753424 fpi=17365 bytes=184498617 buffers full=11293 -> Index Scan using wal_test_pkey on wal_test (actual rows=250000.00 loops=1) Index Cond: (id <= 250000) Index Searches: 1 Buffers: shared hit=17353 Planning: Buffers: shared hit=14 dirtied=1 Planning Time: 0.187 ms Execution Time: 2149.051 ms (11 rows) Check buffers full alongside WAL records, FPIs, and bytes to identify how often WAL buffers became full during the write operation. In PostgreSQL 18, inspect records, fpi, bytes, and buffers full together with the number of affected rows. These values help assess the WAL cost of a bulk operation and its possible effect on write throughput, storage, and replication. Frequent buffers full events can indicate sustained WAL pressure, but should be evaluated alongside total WAL volume and execution behavior 6) Improved Parallel Bitmap Heap Scan Stats PostgreSQL 18 adds worker cache statistics for parallel bitmap heap scans, improving per-worker visibility in parallel plans. When analyzing parallel execution, go beyond Workers Planned and Workers Launched and correlate worker-level behavior with buffers and row flow. The following example uses a Parallel Bitmap Heap Scan to retrieve matching rows through multiple processes. PostgreSQL 18 exposes additional worker-level statistics, allowing the activity of individual workers to be compared with the overall parallel scan. -- Setup CREATE TABLE pb_test AS SELECT x AS id, x % 10 AS category FROM generate_series(1,100000) x; CREATE INDEX pb_test_category_idx ON pb_test(category); VACUUM ANALYZE pb_test; SET max_parallel_workers_per_gather = 2; SET min_parallel_table_scan_size = 0; SET parallel_setup_cost = 0; SET parallel_tuple_cost = 0; SET enable_seqscan = off; SET enable_indexscan = off; EXPLAIN (ANALYZE, VERBOSE, BUFFERS, COSTS OFF, TIMING OFF) SELECT * FROM pb_test WHERE category < 3; EXPLAIN Output PG 17 Gather (actual rows=30000 loops=1) Output: id, category Workers Planned: 2 Workers Launched: 1 Buffers: shared hit=443 read=27 -> Parallel Bitmap Heap Scan on public.pb_test (actual rows=15000 loops=2) Output: id, category Recheck Cond: (pb_test.category < 3) Heap Blocks: exact=443 Buffers: shared hit=443 read=27 Worker 0: actual rows=0 loops=1 -> Bitmap Index Scan on pb_test_category_idx (actual rows=30000 loops=1) Index Cond: (pb_test.category < 3) Buffers: shared read=27 Query Identifier: 6421728296517627451 Planning: Buffers: shared hit=9 Planning Time: 0.065 ms Execution Time: 12.218 ms (19 rows) EXPLAIN Output PG 18 Gather (actual rows=30000.00 loops=1) Output: id, category Workers Planned: 2 Workers Launched: 1 Buffers: shared hit=445 read=27 -> Parallel Bitmap Heap Scan on public.pb_test (actual rows=15000.00 loops=2) Output: id, category Recheck Cond: (pb_test.category < 3) Heap Blocks: exact=443 Buffers: shared hit=445 read=27 Worker 0: actual rows=0.00 loops=1 Buffers: shared hit=2 -> Bitmap Index Scan on pb_test_category_idx (actual rows=30000.00 loops=1) Index Cond: (pb_test.category < 3) Index Searches: 1 Buffers: shared read=27 Query Identifier: 6365259442062613493 Planning: Buffers: shared hit=9 Planning Time: 0.085 ms Execution Time: 17.366 ms (21 rows) Workers Planned and Workers Launched alone do not show how much useful work each worker performed. Worker-level statistics can reveal cases where work distribution is uneven or a launched worker contributes very little. 7) Disabled Plan Nodes Are Explicitly Identified When experimenting with planner toggles: SET enable_seqscan = off; SET enable_hashjoin = off; SET enable_nestloop = off; PostgreSQL 18 can indicate disabled nodes more clearly in plan output, making “what-if” diagnostics easier to interpret. The following example disables sequential scans and executes a leading-wildcard search that has no suitable B-tree index access path. PostgreSQL still needs to perform a sequential scan, but PostgreSQL 18 makes this explicit in the plan with Disabled: true. -- Setup CREATE TABLE disabled_test ( id INT, notes TEXT); INSERT INTO disabled_test SELECT x, CASE WHEN x % 100 = 0 THEN 'order checked manually' ELSE 'normal order' END FROM generate_series(1,100000) x; VACUUM ANALYZE disabled_test; SET enable_seqscan = off; EXPLAIN (ANALYZE, COSTS OFF, TIMING OFF) SELECT * FROM disabled_test WHERE notes LIKE '%checked%'; EXPLAIN Output PG 17: Seq Scan on disabled_test (actual rows=1000 loops=1) Filter: (notes ~~ '%checked%'::text) Rows Removed by Filter: 99000 Planning Time: 0.065 ms Execution Time: 7.045 ms (5 rows) EXPLAIN Output PG 18: Seq Scan on disabled_test (actual rows=1000.00 loops=1) Disabled: true Filter: (notes ~~ '%checked%'::text) Rows Removed by Filter: 99000 Buffers: shared hit=642 Planning: Buffers: shared hit=8 Planning Time: 0.096 ms Execution Time: 6.992 ms (9 rows) This makes planner experiments easier to interpret because you can distinguish between a normally selected plan node and one PostgreSQL used even though that planner method had been disabled. 8) Better Window Function Visibility Plans now expose additional details about window-function arguments. Combined with richer Window Aggregate memory/disk reporting, this improves troubleshooting for analytical workloads using: ROW_NUMBER() RANK() SUM() OVER (...) AVG() OVER (...) LAG() / LEAD() The following example uses LAG() to retrieve the previous value within each department. PostgreSQL 18 exposes more information about the window itself, making it easier to associate the window function with its partitioning, ordering, and resource usage. -- Setup CREATE TABLE window_test (id INT,dept_id INT,amount NUMERIC); INSERT INTO window_test VALUES (1, 1, 100), (2, 1, 200), (3, 1, 300), (4, 2, 150), (5, 2, 250); VACUUM ANALYZE window_test; EXPLAIN (ANALYZE, VERBOSE, COSTS OFF, TIMING OFF) SELECT id, dept_id,amount, LAG(amount, 1, 0) OVER ( PARTITION BY dept_id ORDER BY id ) AS previous_amount FROM window_test; EXPLAIN Output PG 17 WindowAgg (actual rows=5 loops=1) Output: id, dept_id, amount, lag(amount, 1, '0'::numeric) OVER (?) -> Sort (actual rows=5 loops=1) Output: id, dept_id, amount Sort Key: window_test.dept_id, window_test.id Sort Method: quicksort Memory: 25kB -> Seq Scan on public.window_test (actual rows=5 loops=1) Output: id, dept_id, amount Query Identifier: -674688654798365229 Planning Time: 0.083 ms Execution Time: 0.038 ms (11 rows) EXPLAIN Output PG 18 WindowAgg (actual rows=5.00 loops=1) Output: id, dept_id, amount, lag(amount, 1, '0'::numeric) OVER w1 Window: w1 AS (PARTITION BY window_test.dept_id ORDER BY window_test.id) Storage: Memory Maximum Storage: 17kB Buffers: shared hit=38 -> Gather Merge (actual rows=5.00 loops=1) Output: id, dept_id, amount Workers Planned: 1 Workers Launched: 1 Buffers: shared hit=38 -> Sort (actual rows=2.50 loops=2) Output: id, dept_id, amount Sort Key: window_test.dept_id, window_test.id Sort Method: quicksort Memory: 25kB Buffers: shared hit=38 Worker 0: actual rows=0.00 loops=1 Sort Method: quicksort Memory: 25kB Buffers: shared hit=37 -> Parallel Seq Scan on public.window_test (actual rows=2.50 loops=2) Disabled: true Output: id, dept_id, amount Buffers: shared hit=1 Worker 0: actual rows=0.00 loops=1 Query Identifier: -8082484858136532801 Planning: Buffers: shared hit=13 Planning Time: 0.106 ms Execution Time: 13.623 ms (28 rows) Check the Window, Output, and Storage fields to understand the window definition, function arguments, and WindowAgg memory usage. Instead of displaying only OVER (?), PostgreSQL 18 makes it easier to identify the applicable window definition and correlate it with resource consumption. PostgreSQL 17 and Earlier vs PostgreSQL 18 Area Earlier behavior PostgreSQL 18 Buffers with ANALYZE Usually requested explicitly Included automatically Index diagnostics Loops/time based interpretation Adds Index Searches Row precision Less precise averages Fractional row counts Material/Window/CTE resource visibility Limited Expanded memory/disk details WAL diagnostics records/fpi/bytes Adds buffers full Parallel bitmap visibility Less worker cache detail Worker cache statistics Disabled nodes Less explicit Explicitly indicated Conclusion With PostgreSQL 18, EXPLAIN provides deeper visibility into query execution through automatic buffer statistics, index search counts, fractional row reporting, improved memory and WAL details, worker-level cache statistics, and clearer window-function information. These enhancements make it easier to identify bottlenecks and make evidence-based tuning decisions.39Views0likes0Comments