opentelemetry
39 TopicsReliability Starter Kit: SLIs, Health models, and SRE Agent
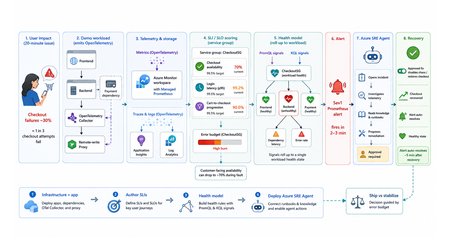
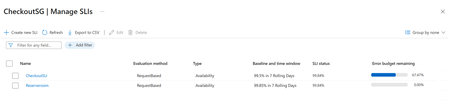
TL;DR This walkthrough uses a small e-commerce demo app to show how Azure Monitor can measure a user journey with service level indicators (SLIs) and service level objectives (SLOs), roll those results into a health model, and have the Azure SRE Agent investigate the alert. When the demo intentionally breaks, about one in three checkout attempts, a Sev1 Prometheus alert fires in about 2 to 3 minutes, and the agent opens an incident from that alert within a minute or two. Clone the kit, run four steps in order, and watch the failure go from alert to proposed fix on your own subscription. Who this is for Site reliability engineers who own on-call and want alerts that mean something. Platform engineers wiring observability for other teams. Application developers who need to prove a service is healthy before they ship. Engineering leaders deciding when to ship and when to stabilize. What the user felt, and what the system reported In the demo app, a fault makes about one in three checkout attempts fail for twenty minutes. The table below shows how that same incident can look to customers and to the platform. What the customer experienced What the system reported Payment failed, retried twice, gave up CPU 40%, memory normal, every instance up Cart abandoned, no order placed No alert fired on slidemo-be-<suffix> Called support: "it works fine for us" Average latency 180 ms, inside target Every statement in the right column is accurate. None of them explains the left column. The platform was answering a resource question: are the apps running? Users had a different question: can I complete checkout? A service level indicator (SLI) closes that gap. It is one number: successful checkouts divided by attempted checkouts, as a percentage. It changes when checkout succeeds or fails, not when CPU or memory changes. Set a target for that number, say 99.5%, and the target is your service level objective (SLO). With both in place, the questions that matter answer themselves: The question What the SLI tells you Is this real? Checkout availability is 70%, against a 99.5% target How bad is it? Most of a week's error budget is gone in ten minutes What broke? The checkout journey is failing, so responders start in the right place Azure Monitor computes that SLI for you. Azure Monitor health models roll it up into one workload state. The Azure SRE Agent turns the right alert into an investigation and a proposed fix. The hard part is the wiring between them: which metric feeds the indicator, which indicator feeds the health signal, and which alert source actually reaches the agent. This kit ships that wiring, as scripts you can run, against a workload you can break on purpose. What the kit ships The kit is a self-contained reference implementation. It deploys its own demo workload, instruments it, and connects five stages end to end: telemetry is emitted, stored in Azure Monitor, scored into SLIs and rolled up by a health model, turned into an alert the Azure SRE Agent acts on, and finally weighed against the error budget. It is opinionated on purpose: one workload, one service group, three SLIs, one health model, one agent, one proven trigger. The four services it wires together Service What it does Layer Azure Monitor SLIs and SLOs on a Service Group You name the metric that counts as good and the one that counts as total. It computes the ratio on a schedule, compares it to your target, and tracks the error budget. The score belongs to a service group, which is how Azure Monitor names your application as a whole, so the number describes the app rather than any one resource. This post calls that scoring component the SLI engine. Measurement Azure Monitor health models A dependency graph where every node carries its own health state. Each node is an entity, either an Azure resource or an application component discovered from Application Insights. You attach signals to an entity (a PromQL query, a KQL query, or a platform metric) with degraded and unhealthy thresholds, and the worst child state rolls up into one state for the workload. Aggregation Azure SRE Agent Takes Azure Monitor alerts as incidents and runs the first-pass investigation: queries the relevant metrics, logs, and recent deployments, forms a root-cause hypothesis, and proposes a remediation. It never applies a change without human approval. The kit deploys it read-only, so it investigates freely and has to ask before it changes anything. Action The telemetry plane OpenTelemetry (OTel) in the apps, a collector, an Azure Monitor workspace running managed Prometheus for metrics, and Application Insights backed by a Log Analytics workspace for traces and logs. One workspace holds both the raw metrics and the SLI results, so everything reads a single consistent set of numbers. Foundation What ships in the box Four steps you run in order: infrastructure and the app, SLIs on a service group, the health model, and the Azure SRE Agent. Runnable PowerShell scripts for every step, all idempotent, all with teardown. A demo workload with a chaos endpoint, so you can break checkout on demand. Validated console transcripts in the lab guides, so you know what "working" looks like before you run it. Everything is in this repo. The diagram shows how the pieces hand off to each other: Walking the flow: Emit. The apps emit OpenTelemetry counters and histograms. The Collector splits the stream two ways: metrics go to a remote-write proxy that attaches a Microsoft Entra ID token, and traces and logs go to Application Insights, backed by a Log Analytics workspace. Store. The Azure Monitor workspace ingests the metric series. Prometheus recording rules pre-aggregate them into the exact label shape the SLI engine can filter on. Score and roll up. Three SLIs on the CheckoutSG-<suffix> service group compute good over total, compare against a 99.5% baseline, and write their evaluated results back into the same workspace. The health model reads those stored results as PromQL signals and the failure data as a KQL signal, then rolls the worst child state up to the workload root. Alert and act. A Prometheus alert rule on the workspace fires Sev1 into the action group and into the Azure SRE Agent's incident source. The agent reads its uploaded knowledge base, correlates against the traces and logs, and proposes a runbook. After you approve it, the remediation runs and the agent verifies recovery. The health model's own health-state alerts reach the action group for human triage only: they fire in rg-healthmodel-demo, which is not the agent's incident-ingestion scope, so they never become incidents. Decide. The error budget gates the release call: ship when healthy, stabilize when burning. The demo workload The workload is a small e-commerce store, deliberately boring so the reliability mechanics are the interesting part. Component What it is What it does Frontend Node.js on App Service Linux Customer site, proxies /api/* to the backend Backend Node.js on App Service Linux Serves /login and /checkout, calls the payment dependency, emits the SLI source metrics Payment dependency Simulated, inside the backend Exercised through checkout, never called directly OpenTelemetry Collector Container web app Receives OpenTelemetry Protocol (OTLP) traffic, fans traces to Application Insights and metrics toward Prometheus remote write Remote-write proxy Node.js on App Service Linux Attaches a managed identity token so remote write works on App Service, which has no Instance Metadata Service (IMDS) endpoint Azure Monitor workspace Managed Prometheus Both the SLI source and the SLI destination Application Insights + Log Analytics workspace Traces and logs The investigation surface the agent correlates against The three source metrics are the raw material for every SLI in the kit: Metric Type Labels Feeds http_server_requests_total counter service, route, status_class Checkout availability (good is status_class="2xx") http_server_request_duration_seconds histogram service, route Login latency (good is under 300 ms) dependency_calls_total counter dependency, status Payment dependency availability The chaos endpoint Use the backend admin endpoint to inject failures or latency: POST {backend}/admin/chaos Set service to "login" or "checkout", then use errorRate and extraLatencyMs to shape the fault. Do not pass "payment": the payment dependency is exercised through checkout, so "payment" returns HTTP 400. Before you start: prerequisites Start by cloning the kit: git clone https://github.com/jvargh/azure-reliability-starter-kit.git cd azure-reliability-starter-kit Every command in this post runs from that repository root. No step asks you to change directory. Open two terminals there: the traffic generator described later in "Start traffic and leave it running" blocks its shell for the full run. Two things the table cannot tell you. Every step creates role assignments, so you need a subscription where you can grant roles, not just create resources. And the App Service plan defaults to P1v3, which is what you want if you also care about Azure Resource Health signals in the health model; pass -PlanSku B1 for a cheaper run, and use the Clean up section when you are finished. Requirement Value used in this kit Subscription role Owner, or Contributor plus User Access Administrator Shell PowerShell 7+ (pwsh), two terminals CLI Azure CLI, signed in (az login) Tooling (Step 4) git, jq, Python 3 with PyYAML on PATH (Phase 2 can install the last three) Resource providers Microsoft.Monitor, Microsoft.Web, Microsoft.CloudHealth, Microsoft.App Network Outbound to *.azuresre.ai Workload region eastus2 (any region works) Health model region centralus (region limited, so the kit pins it) Azure SRE Agent region eastus2 (check the current region list before changing it) Prefer to paste the whole sequence and read afterwards? The full command sequence is consolidated later in "Try it now." Step 1: stand up the infrastructure and the app Folder: 01-sli-demo/infra Prerequisites: everything in the table above. infra-deploy.ps1 registers the required resource providers itself, so you do not need to pre-register them. What infra-deploy.ps1 does infra-deploy.ps1 is one script that takes you from an empty subscription to a running, instrumented workload: Creates the resource group (rg-sli-demo) in your chosen location, or leaves it alone if it already exists. Registers the required resource providers. Deploys the Bicep in main.bicep, which composes four modules: monitoring (Azure Monitor workspace, Log Analytics workspace, Application Insights), identity (the user-assigned managed identity plus its Monitoring roles), the App Service plan and four web apps, and the ingestion wiring for the workspace. Zip-deploys the three Node.js applications (backend, frontend, remote-write proxy) with Oryx building each one on the platform. Prints every value the later steps need: the frontend URL, the Azure Monitor workspace name, the managed identity client id, and the suggested service group name. az login az account set --subscription "<SUBSCRIPTION_ID>" ./01-sli-demo/infra/infra-deploy.ps1 -ResourceGroup rg-sli-demo -Location eastus2 A clean run, trimmed: PS ...\azure-reliability-starter-kit> ./01-sli-demo/infra/infra-deploy.ps1 -ResourceGroup rg-sli-demo -Location eastus2 ==> Ensuring resource group rg-sli-demo (eastus2) ==> Registering required resource providers ==> Deploying infrastructure (Bicep) ==> Deploying app code (backend, frontend, proxy) ==> Deploying code to slidemo-be-<suffix> Status: Build successful. Time: 52(s) Status: Site started successfully. Time: 87(s) ... ==> Done. Resources deployed and code pushed. Frontend: https://slidemo-fe-<suffix>.azurewebsites.net Backend: https://slidemo-be-<suffix>.azurewebsites.net Azure Monitor WS: slidemo-amw-<suffix> Service Group name: CheckoutSG-<suffix> (add rg-sli-demo as a member) Keep <suffix> handy. Every later script auto-discovers it from the deployment outputs, but you will see it in resource names throughout. Smoke-test it with infra-validate-lab.ps1 infra-validate-lab.ps1 reads the deployment outputs and asserts the deployment succeeded, all four App Services are running, and every health and functional endpoint responds (including the frontend-to-backend proxy path). It prints [PASS], [FAIL], or [SKIP] per check and exits non-zero on any failure, so you can gate a demo or a pipeline on it. Run it with no optional switches at this point. The metric and SLI checks depend on traffic and on Step 2, neither of which has happened yet. ./01-sli-demo/infra/infra-validate-lab.ps1 -ResourceGroup rg-sli-demo Validating SLI/SLO demo infrastructure in 'rg-sli-demo'... == Prerequisites == [PASS] Azure CLI signed in [PASS] Resource group 'rg-sli-demo' exists == Deployment == [PASS] Deployment 'main' found [PASS] Deployment provisioningState (Succeeded) ... == Health endpoints == [PASS] backend /healthz (GET -> 200) [PASS] frontend /healthz (GET -> 200) [PASS] proxy /healthz (GET -> 200) ... == Functional endpoints == [PASS] frontend /api/checkout (GET -> 200) ... The two optional switches, -IncludeMetrics and -IncludeSlo, are staged deliberately. Switch -IncludeMetrics needs live traffic, and -IncludeSlo looks for the recording-rule group that Step 2 creates, so both belong at the end of Step 2 (see Re-validate, now with the metric and SLI checks). A [FAIL] means a resource is missing; a [SKIP] means it exists but has no data yet. Start traffic and leave it running Run this in a second terminal at the repository root. It blocks the shell for the full duration, and every remaining step needs it flowing. pwsh -File ./01-sli-demo/load/generate-traffic-all.ps1 -ResourceGroup rg-sli-demo -Rps 30 -DurationSeconds 3600 generate-traffic-all.ps1 auto-discovers the frontend URL from the main deployment output (falling back to the App Service whose name contains -fe-), then drives a mixed load defaulting to 30 requests per second with a 70% checkout weight. It requires PowerShell 7 or later. PS ...\azure-reliability-starter-kit> pwsh -File ./01-sli-demo/load/generate-traffic-all.ps1 -ResourceGroup rg-sli-demo -Rps 30 -DurationSeconds 3600 Resolved target from 'rg-sli-demo': https://slidemo-fe-<suffix>.azurewebsites.net Driving ~30 rps against https://slidemo-fe-<suffix>.azurewebsites.net checkout 70% (also drives payment dependency) | login 30% duration: 3600 s [1188s] checkout: sent=11032 ok=10977 fail=23 | login: sent=4777 ok=4772 fail=1 | payment via checkout Keep traffic running before you author SLIs. The SLI query validator needs the Azure Monitor workspace to index metric dimensions first, and that only happens after metrics flow. Histogram-derived dimensions index later than plain counters, so starting traffic early avoids false validation errors such as status_class not being available yet. Step 2: author the SLIs Folder: 01-sli-demo Prerequisites: Step 1 deployed and green in infra-validate-lab.ps1, and generate-traffic-all.ps1 still running in its own terminal, for the indexing reason in the callout above. What deploy-sli.ps1 does deploy-sli.ps1 automates the SLI authoring flow: Stage What the script does Why it matters Read context Reads the Azure Monitor workspace, managed identity, and suggested service group name from the main deployment outputs. Keeps later commands tied to the deployed workload. Prepare metrics Deploys six Prometheus recording rules. Four feed the SLIs; two (sli:http_request_latency_p95:5m, sli:http_request_latency_avg:5m) support dashboards and the health model. The SLI engine can filter dimensions on recording-rule output, not raw remote-written series. Create scope Creates CheckoutSG-<suffix>, adds rg-sli-demo as a member, and sets the default managed identity and Azure Monitor workspace. Puts the frontend and backend in SLI scope. Wait for data Waits up to -MetricWaitMinutes for sli:http_requests:rate5m and sli:http_request_latency_total:rate5m, then retries SLI creation for up to -SliIndexingRetryMinutes while dimensions index. Avoids false validation failures while metric metadata catches up. Author SLIs Creates the three SLIs and polls until each reports Succeeded. Produces the customer-facing reliability measurements. Wire alerts Creates ag-sli-demo and the linked baseline, fast-burn, and slow-burn alerts for each SLI. Makes the SLIs visible with their alert configuration. The three SLIs it creates. All three sit at a 99.5% baseline over a 7 rolling-day window: SLI Type Good over total CheckoutAvailabilitySLI Availability 2xx checkout requests over all checkout requests LoginLatencySLI Latency Login requests under 300 ms over all login requests PaymentDependencySLI Dependency availability Successful payment calls over all payment calls Run this script from the repository root after traffic has started. It creates the recording rules, service group, SLIs, and linked alert configuration in one pass. ./01-sli-demo/infra/sli/deploy-sli.ps1 -ResourceGroup rg-sli-demo A successful run should show these checkpoints: PS ...\azure-reliability-starter-kit> ./01-sli-demo/infra/sli/deploy-sli.ps1 -ResourceGroup rg-sli-demo ==> Reading deployment context AMW : .../Microsoft.Monitor/accounts/slidemo-amw-<suffix> Identity : .../userAssignedIdentities/slidemo-id-<suffix> ServiceGroup : CheckoutSG-<suffix> ==> Deploying Prometheus recording rules Succeeded ==> Creating Service Group Service Group: Succeeded ==> Adding resource group as a Service Group member Member relationship submitted. ==> Enabling monitoring on the Service Group Default workspace and identity set. ==> Waiting up to 10 min for recording-rule metrics Counter metric present: True Latency total metric present: True ==> Creating SLIs CheckoutAvailabilitySLI created LoginLatencySLI created PaymentDependencySLI created ==> Verifying SLI provisioning CheckoutAvailabilitySLI Succeeded LoginLatencySLI Succeeded PaymentDependencySLI Succeeded The result is a service group view with three SLIs: checkout availability, login latency, and payment dependency availability. Each one uses the same 99.5% baseline over a 7 rolling-day window, and the list shows both the current SLI value and the remaining error budget. The guided design method: sli-run-lab.ps1 Automation gets you three SLIs. It does not teach you how to choose them for your own application. That is what sli-run-lab.ps1 is for: an eight-phase interactive method that walks from telemetry to a design checklist, prompting for the judgement calls and computing everything else. Phase Name What you get 1 Environment setup and access checks Resolved workspace, identity, service group, Prometheus endpoint 2 Enumerate ALL user journeys journey-inventory.csv built from live telemetry 3 Extract the CRITICAL journeys Criticality scores and a shortlist 4 Data collection (per critical journey) Dimensions confirmed, performance measured, continuity checked 5 Consolidate into the design checklist design-checklist.csv, one row per SLI 6 Author the SLIs in the portal The wizard, or deploy-sli.ps1 7 Validate end-to-end Published :value series cross-checked against your own math 8 Lab completion checklist What "done" looks like Phase 4 is where the evidence gets collected, per journey: ---- checkout ---- ==> 4.1 - Confirm the source metric and required dimensions exist checkout / 2xx checkout / 5xx ==> 4.2 - Measure CURRENT performance (evidence for the target) Measuring over the last 7d... Measured (7d): 99.796% ==> 4.3 - Confirm the signal is continuous (no silent gaps) Checking the last 6h in 5m buckets... Continuous: yes (no empty 5m buckets). ==> 4.4 - Write the good / valid definition (the contract) ==> 4.5 - Data-collection worksheet (fill one per critical journey) At target 99.5% the error budget is 0.5% (currently ~0.41x used). Recorded worksheet for CheckoutAvailabilitySLI. Phase 7 proves the engine is not just configured but actually publishing, and cross-checks its arithmetic against yours: ==> 7.2 - Confirm the engine publishes results Authored SLIs: CheckoutAvailabilitySLI, LoginLatencySLI, PaymentDependencySLI ---- CheckoutAvailabilitySLI ---- engine value = 99.6914 ==> 7.3 - Cross-check the engine against your own math 100*good/total = 99.6914 (internal consistency) ... ---- LoginLatencySLI ---- engine value = 100.0000 Right after you restart traffic, Phase 7 will report "No published :value series yet." That is the engine waiting on evaluation cycles, not a failure. The portal's SLI status and error budget columns lag a further 30 to 60 minutes. You can validate the same thing yourself with one PromQL (the Prometheus query language) query against the workspace: 100 * sum(sli:http_requests:rate5m{service="checkout",status_class="2xx"}) / sum(sli:http_requests:rate5m{service="checkout"}) Re-validate, now with the metric and SLI checks With traffic flowing and the recording rules deployed, the two switches you skipped in Step 1 now have something to assert against. This is the full 22-check run: ./01-sli-demo/infra/infra-validate-lab.ps1 -ResourceGroup rg-sli-demo -IncludeMetrics -IncludeSlo == Metric pipeline == [PASS] Prometheus query token acquired [PASS] Source metrics present (http_server_requests_total series=3) [PASS] Recording-rule group deployed (slidemo-sli-recording-rules) [PASS] Recording-rule metrics present (sli:http_requests:rate5m) Summary: 22 passed, 0 failed, 0 skipped Before you move to Step 3, give the SLI engine 30 to 60 minutes to publish evaluated values into the workspace. The health model reads those stored results rather than recomputing them, so starting Step 3 too early gives you a graph of Unknown states and nothing to debug. Step 3: roll it up with an Azure Monitor health model Folder: 02-healthmodel-demo Prerequisites: the three SLIs authored and publishing values, and generate-traffic-all.ps1 still running. What healthmodel-run-lab.ps1 does healthmodel-run-lab.ps1 is a six-phase runner that calls two write scripts: src/healthmodel-deploy.ps1 creates the model, and src/configure-signals-alerts.ps1 attaches signals and alerts. Phase Name 1 Environment setup and access checks 2 Create the health model 3 Discover the app as entities 4 Map the SLIs to entities (from the sli label) 5 Configure signals and alerts 6 Validate end-to-end ./02-healthmodel-demo/healthmodel-run-lab.ps1 Phase 2 creates the health model (hm-checkout-demo) with a system-assigned identity under the Microsoft.CloudHealth provider at API version 2026-05-01-preview, grants that identity Monitoring Reader on the workload resource group, binds an authentication setting, and creates the discovery rules. Why there are two discovery nodes The kit creates two discovery rules, not one, because they answer different questions: Azure Resource Graph discovery imports the workload's Azure resources (the four App Services and the plan) as entities. This is the infrastructure view: concrete resource ids the Azure SRE Agent can act on. Application Insights topology discovery imports the application's own component map (sli-demo-frontend, sli-demo-backend) and their observed dependencies. This is the application view, which survives resource renames and shows call relationships that Resource Graph cannot see. The model uses a "worst of" rollup: if any child entity is Unhealthy, the parent moves to Unhealthy too. Discovery is not instant; it runs every five minutes, so wait 5 to 10 minutes after Phase 2 before checking for entities in Phase 3. The critical detail: tap the stored SLI results The health model does not recompute your SLIs from raw metrics. It reads the stored SLI result series that the SLI engine writes back into the Azure Monitor workspace. That is what keeps the model's numbers identical to the SLI blade's numbers. Those series are named ns::<servicegroup-lowercase>/m::<sli-lowercase>:value (with :good and :total alongside). The :: and / characters make that invalid as a bare metric token, so the selector has to be pinned with __name__ equality: last_over_time({__name__="ns::checkoutsg-<suffix>/m::checkoutavailabilitysli:value"}[1h]) Thresholds and the one-hour lookback. The one-hour last_over_time lookback is what keeps a brief gap in traffic from reading as an error: the signal returns the most recently published value instead of an empty result, and only goes Unknown when the SLI has published nothing for a full hour. Thresholds on that signal are degraded below 99 and unhealthy below 95, which means a 99.9% reading correctly stays Healthy instead of tripping on a "below 100" rule. ==> 5.1 - Invoking src/configure-signals-alerts.ps1 ==> Ensuring AMW query roles (Monitoring Data Reader + Monitoring Reader) for the health model identity Monitoring Data Reader assigned Monitoring Reader assigned ==> Discovering published SLI result series in the AMW CheckoutAvailabilitySLI: found LoginLatencySLI: found PaymentDependencySLI: found ==> Checkout (backend): slidemo-be-<suffix>: Checkout availability SLI (AMW), Payment dependency SLI (AMW) ==> Login (frontend): slidemo-fe-<suffix>: Login latency SLI (AMW) ==> App Service plan tier: PremiumV3 (Resource Health supported: True) ==> Uptime signal (Resource Health) on 'slidemo-promproxy-<suffix>' ==> Linking the model root to each discovery node so health rolls up root -> appinsights-topology updated root -> resource-graph updated Phase 6 reads the resulting states and confirms the numbers match: ==> 6.1 - Entity health states and attached SLI signals Entity Health SliSignals ------ ------ ---------- slidemo-be-<suffix> Healthy Checkout availability SLI (AMW), Payment dependency SLI (AMW) slidemo-fe-<suffix> Healthy Login latency SLI (AMW) Checkout/Login workload Healthy hm-checkout-demo Healthy ... -- 6.2 stored :value series -- checkoutavailabilitysli = 99.82 loginlatencysli = 100 paymentdependencysli = 99.82 Tier awareness matters. Azure Resource Health is unsupported on Free and Shared App Service plans, so configure-signals-alerts.ps1 reads the plan SKU and adapts: Basic and above use the built-in Resource Health signal, while Free and Shared fall back to the Http2xx platform metric on the sites and CpuPercentage on the plan. Without that fallback, every supporting entity reads Unknown on a cheap plan and the model looks broken when it is not. Step 4: deploy the Azure SRE Agent Folder: 03-sre-agent Prerequisites: Microsoft.App registered on the subscription, Owner or User Access Administrator so the deployment can create role assignments on both managed resource groups, outbound access to *.azuresre.ai for the agent data plane, and git, jq, and Python 3 with PyYAML available on PATH. Phase 2 can install the last three for you through the templates' Install-Prerequisites.ps1, so a clean machine only needs git in advance. What sre-run-lab.ps1 does sre-run-lab.ps1 runs six phases: Phase Name 1 Environment and access checks 2 Acquire the Azure SRE Agent IaC templates 3 Generate the agent config from the recipe 4 Deploy the agent 5 Validate the agent is up 6 Wire inputs from the health model and SLI 6.1 Alerts on the target resource groups 6.2 Action group (human notification path) 6.3 Confirm the agent target scope covers both resource groups 6.4 Apply response plans (incident filters) so alerts are auto-handled 6.5 Final data-plane verification 6.6 Upload knowledge (app topology and remediation runbooks) Phase 2 pulls the official Infrastructure as Code templates from github.com/microsoft/sre-agent. Phase 3 generates config from the azmon-lawappinsights recipe, which wires Azure Monitor alert response together with Log Analytics and Application Insights connectors, safety defaults, and a daily health check. Phase 4 deploys Microsoft.App/agents (API version 2025-05-01-preview) plus a user-assigned managed identity, a Log Analytics workspace, Application Insights, and role assignments on both managed resource groups. The Azure Resource Manager (ARM) deployment itself takes roughly 2 to 3 minutes. One naming trap to get ahead of: sre-run-lab.ps1 defaults -ResourceGroup to rg-sre-agent, while sli-alert-scenario.ps1 defaults -AgentResourceGroup to rg-sre-checkout. Pass the name explicitly so both scripts point at the same agent. -SkipRepos strips the optional placeholder GitHub connection, so the deploy never pauses for a browser sign-in. ./03-sre-agent/sre-run-lab.ps1 -SkipRepos -ResourceGroup rg-sre-checkout The deploy header confirms the safety posture before anything is created: ==> 4.1 - Deploy-Agent.ps1 ──────────────── SRE Agent deployment ──────────────── Region: eastus2 Agent name: sre-checkout Agent RG: rg-sre-checkout (will be created) Target RGs: rg-sli-demo, rg-healthmodel-demo Access level: Low Action mode: Review ───────────────────────────────────────────────────── ─────────────── Deployment Succeeded ─────────────── Agent (portal): https://sre.azure.com/#/agent/<SUBSCRIPTION_ID>/rg-sre-checkout/sre-checkout Phase 6.5 is the authoritative check. It re-reads the data plane and compares actual against expected: ARM PATCH -> incidentManagementConfiguration.type=AzMonitor ok ==> 6.4 - Apply response plans (incident filters) so alerts are auto-handled Response plan applied: azmon-sev01 (priorities Sev0/Sev1 -> alert-investigator) ==> 6.5 - Final data-plane verification (all config applied) Check Actual Expected Result ───────────────────────── ────────── ────────── ────── Incident platform AzMonitor AzMonitor PASS Connectors (total) 0 0 PASS Response Plans 1 1 PASS Filter names azmon-sev01 azmon-sev01 PASS ... Results: 22 passed, 0 failed All 22 checks pass on a clean run. One earlier line reads like a failure and is not. Phase 6.1 reports that rg-healthmodel-demo has no metric alert rules. That is correct, because health-model alerts live inside the health model resource and never appear in az monitor metrics alert list. The key settings are incidentManagementConfiguration.type = AzMonitor and response plan azmon-sev01. Together they turn Sev0 and Sev1 Azure Monitor alerts into agent investigations; the agent still runs in review mode, so it proposes mitigation and waits for approval. Finish the two portal steps that cannot be scripted The runner provisions everything it can, but two interactive OAuth steps have no scriptable equivalent. Do both before you run The end-to-end run, or no incident will appear and the agent will look inert. Open the agent in sre.azure.com using the portal link the deployment prints. Complete the GitHub sign-in prompt if you want the agent to correlate deploys. Skip it if you passed -SkipRepos. Open the agent's incident source settings and confirm the Azure Monitor Alerts incident source. Until you confirm it, fired alerts are not converted into incidents. The knowledge upload (phase 6.6) Phase 6.6 uploads a knowledge base to the agent's Knowledge settings, indexed for semantic search. This is the difference between an agent that spends its first incident rediscovering your architecture and one that starts from a map. Two kinds of document go up. The first is checkout-app-topology-and-runbook.md: the services, the telemetry pipeline (crucially, that request metrics live in the Azure Monitor workspace and not in Application Insights), the recording rules, the alerts, and the common failure scenarios. Without it, the agent burns cycles querying Application Insights for request data that is not there. The second is every remediation runbook, each wrapped into an indexed markdown document, because a .ps1 file is not an indexable knowledge type on its own. Runbook When to use it What it does disable-chaos.ps1 Injected or demo failure, chaos knobs non-zero Resets errorRate and extraLatencyMs to 0 per service restart-backend.ps1 Transient backend state Runs az webapp restart on the backend scale-plan.ps1 Latency under load Scales the App Service plan out or up rollback-deploy.ps1 Regression correlates with a deploy Lists recent deployments and prints the rollback command ==> 6.6 - Upload knowledge (app topology + all remediation runbooks) =================== Upload knowledge to SRE Agent =================== Agent : sre-checkout (rg-sre-checkout) Files : 1 knowledge + 4 runbook doc(s) ==> Uploading checkout-app-topology-and-runbook.md ok (indexed for semantic search) ==> Uploading runbook-disable-chaos.md ok (indexed for semantic search) ... 5/5 document(s) uploaded to sre-checkout Knowledge settings. The end-to-end run Prerequisites: the agent deployed and its knowledge uploaded (Step 4 complete, Phase 6.6 green), and traffic running against the workload. The scenario script starts its own traffic job, but the SLI needs recent data before the fault lands. sli-alert-scenario.ps1 drives the whole scenario, and it stops once the alert fires. Nothing in the script contacts the agent: the agent's Azure Monitor incident source ingests the fired alert on its own and opens the incident. What the scenario script does ./03-sre-agent/sli-alert-scenario.ps1 sli-alert-scenario.ps1 does five things: Stage What happens Reset Clears old chaos settings, traffic jobs, and prior trigger rules. Create trigger Creates a unique Sev1 Prometheus rule group on the Azure Monitor workspace in rg-sli-demo. Start traffic Starts load and warms up for 90 seconds so the SLI has recent data. Inject fault Sets checkout errorRate to 0.30, so about 30% of checkout requests fail. Watch alert Polls Azure Monitor until the new alert fires, reports it, and exits. Representative output, reconstructed from the script's messages. Timestamps and the per-run suffix will differ. =================== SLI alert -> SRE Agent scenario =================== Subscription : <SUBSCRIPTION_ID> AMW : .../Microsoft.Monitor/accounts/slidemo-amw-<suffix> (eastus2) Action group : .../actionGroups/ag-sli-demo Backend : https://slidemo-be-<suffix>.azurewebsites.net Agent : sre-checkout (rg-sre-checkout) Alert : sli-fast-alerts-<run> / checkoutAvailabilityFastBreach (Sev1, checkout availability < 95%; unique per run) ====================================================================== ==> 0 - Reset leftover state from any previous run Prior chaos cleared, stale traffic stopped, and old trigger alerts removed. ==> 1 - Create the fast SRE-Agent trigger alert (unique name per run) Alert 'sli-fast-alerts-<timestamp>/checkoutAvailabilityFastBreach' created (Sev1; unique name = new SRE-A incident). Auto-resolves ~5m after recovery. ==> 2 - Start traffic against the workload [<time>] Traffic job 'sli-scenario-traffic' started (~30 rps). Warming up 90s so the SLI value has fresh data... ==> 3 - Inject the fault (chaos) on 'checkout' [<time>] Chaos injected (errorRate 0.3). Watching for the SLI alert to fire... ==> 4 - Watch for the alert (it should fire in ~2-3 min) ... Alert FIRED (within the expected 2 to 3 minute band): checkoutAvailabilityFastBreach severity : Sev1 monitorService : Prometheus targetRG : rg-sli-demo (in the agent's managed scope) ==> 5 - The SRE Agent engages The timeline The default path, with the agent deployed as the kit ships it: T+ Event 0:00 30% error rate injected on checkout about 2 to 3 minutes Sev1 Prometheus alert fires on the Azure Monitor workspace, scoped to rg-sli-demo within a minute or two The Azure SRE Agent ingests the alert as an incident and investigates on its own next It reads the uploaded topology doc, identifies the chaos knob as the cause, and proposes the disable-chaos runbook on your approval The chaos knob is reset and checkout availability climbs back above 95% about 5 minutes after recovery The alert auto-resolves, because the rule carries timeToResolve: PT5M Watch it happen in sre.azure.com under Incidents. The Azure SRE Agent Lab covers the rest: widening the agent identity beyond the default Reader and Log Analytics Reader, the alerts that look like triggers but never fire, and a troubleshooting table for every failure mode above. Clean up Prerequisites: the same shell, at the repository root, with az login still valid. Work in reverse order. Steps 1 and 2 tear down together, and the scenario state is reset first. # Reset first: removes the per-run Prometheus rule group, clears the injected chaos, stops traffic ./03-sre-agent/sli-alert-scenario.ps1 -TeardownAlert # Step 4: delete the Azure SRE Agent (and optionally its resource group) ./03-sre-agent/teardown.ps1 -ResourceGroup rg-sre-checkout -AgentName sre-checkout -DeleteResourceGroup -Yes # Step 3: delete the health model and its Monitoring Reader role assignment ./02-healthmodel-demo/teardown.ps1 -ResourceGroup rg-healthmodel-demo -HealthModelName hm-checkout-demo -DeleteResourceGroup # Steps 1 and 2: remove the service group and SLIs first, then delete the workload resource group ./01-sli-demo/infra/infra-teardown.ps1 Two things the comments do not say. -ResourceGroup rg-sre-checkout is required on the agent teardown because the script defaults to rg-sre-agent, and -Yes skips its confirmation prompt. And infra-teardown.ps1 asks you to type yes before it deletes anything (skip with -Force). The order matters for one reason. The service group and its SLIs are tenant scoped, so they live outside rg-sli-demo and a plain resource group delete would orphan them. infra-teardown.ps1 removes them first, then deletes the resource group. To drop only the service group and leave the workload standing, run teardown-slo.ps1 instead. Conclusion and next steps You now have the full path: a metric a customer would recognize, an SLI that scores it, a health model that rolls it up, an alert that means something, and an agent that acts on it. The wiring is the product. Try it now Terminal 1 (leave running). Clone, deploy, then start traffic and leave it flowing for the rest of the walkthrough. The traffic generator blocks this shell for the full hour. git clone https://github.com/jvargh/azure-reliability-starter-kit.git cd azure-reliability-starter-kit az login az account set --subscription "<SUBSCRIPTION_ID>" # Step 1: infrastructure + apps, then traffic ./01-sli-demo/infra/infra-deploy.ps1 -ResourceGroup rg-sli-demo -Location eastus2 ./01-sli-demo/infra/infra-validate-lab.ps1 -ResourceGroup rg-sli-demo pwsh -File ./01-sli-demo/load/generate-traffic-all.ps1 -ResourceGroup rg-sli-demo -Rps 30 -DurationSeconds 3600 Terminal 2. Open a second shell at the same repository root and run the remaining steps while traffic flows. # Step 2: SLIs on the service group ./01-sli-demo/infra/sli/deploy-sli.ps1 -ResourceGroup rg-sli-demo # Step 3: health model (allow 30 to 60 min after Step 2 for SLI values to publish) ./02-healthmodel-demo/healthmodel-run-lab.ps1 # Step 4: Azure SRE Agent, then break checkout and watch it heal ./03-sre-agent/sre-run-lab.ps1 -SkipRepos -ResourceGroup rg-sre-checkout ./03-sre-agent/sli-alert-scenario.ps1 Learn more Repository lab guides. Each one carries the full captured console transcript of a validated run, so you can compare your output line by line: SLI/SLO Design Lab and the SLI/SLO Design Guide Health Model Lab and the Health Model Design Guide Azure SRE Agent Lab Video walkthroughs: # Walkthrough Video 01 Infrastructure and SLI demo Watch 02 Health modeling Watch 03 Azure SRE Agent Watch 04 End-to-end test Watch Microsoft Learn documentation: Create service level indicators Azure Monitor health models overview Azure SRE Agent overview Connect and contribute Run the steps, break them, and tell the repository what broke. Open an issue or a pull request at the solution repo.1.1KViews5likes0Comments
Find anomalies in Prometheus and OpenTelemetry metrics with Dynamic Thresholds (Preview)
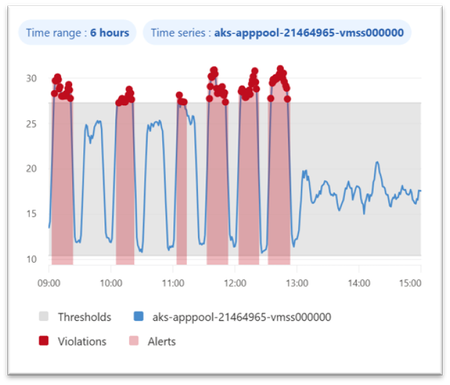
Dynamic thresholds are extended to query-based metric alerts in Azure Monitor, allowing to detect and alert on anomalies in Azure Monitor managed Prometheus metrics and OpenTelemetry metrics stored in an Azure Monitor Workspace. This follows the introduction of Dynamic Thresholds for Log search alerts — Azure Monitor now offers consistent Dynamic Thresholds support across logs and metrics — platform metrics, log search queries, and now query-based metric alerts. A consistent anomaly-detection approach, wherever your signals live. Dynamic thresholds are not a single static formula. They apply a range of machine-learning models and algorithms to historical query results, learn each series’ normal rhythm — including hourly, daily, and weekly seasonality — and automatically fit the most appropriate baseline separately to every time series. This way, a single alert rule can monitor many resources or dimensions while each one gets its own independent, self-refining baseline. Why Dynamic Thresholds Matter Simpler configuration: Reduce the need to define, maintain, and continuously tune static thresholds inside PromQL alert logic. Adaptive monitoring: Let alert thresholds adjust to changing workload behavior, recurring traffic peaks, and seasonal usage patterns. At-scale intelligence: Monitor multiple time series with a single alert rule, while Azure Monitor learns an independent baseline for each resource or dimension combination. Example 1 — Spot CPU anomalies in AKS workloads Scenario: Monitor container CPU utilization across pods or deployments in AKS with a query-based metric alert built on Prometheus metrics. Example query: sum by (microsoft_resource_id, namespace, deployment, container) (rate(container_cpu_usage_seconds_total[5m])) / sum by (microsoft_resource_id, namespace, deployment, container) (container_spec_cpu_quota / container_spec_cpu_period) Why dynamic thresholds help: CPU usage of a Kubernetes workload changes with workload mix, deployment timing, scaling activity, and traffic patterns. Static thresholds can be difficult to tune across namespaces, deployments, and containers. Dynamic thresholds learn a separate baseline for each monitored time series — in this example, for every pod, deployment, and container combination — so genuine CPU spikes stand out while expected variation from autoscaling and traffic mix stays quiet. Example 2 — Catch application latency regressions sooner Scenario: Detect abnormal latency patterns in an application by alerting on custom OpenTelemetry metrics stored in an Azure Monitor Workspace. Example query: histogram_quantile(0.95, sum by (le, service_name, http_route, http_method) (rate(http_server_duration_seconds_bucket[5m]))) Why dynamic thresholds help: Application latency naturally changes with traffic, user behavior, and release cadence. Fixed thresholds can be noisy during peak periods and too loose during quiet ones. Dynamic thresholds learn a separate baseline for each time series — here, for every service, route, and method — so real p95 latency regressions surface even as traffic and release cadence shift throughout the day. Best practices for better results To get the best results from dynamic thresholds for PromQL-based alerts, design your query so Azure Monitor can learn a clear, stable signal over time: Keep the expression numeric. Dynamic thresholds work best when the query returns a continuous numeric signal rather than a Boolean true/false result. For example, use an expression that calculates CPU usage, not a Boolean comparison like CPU > 0.8. Use meaningful dimensions. Split by dimensions such as namespace, deployment, service, or route when you want separate baselines for different workloads or endpoints. Prefer stable entities. Use longer-lived dimensions or aggregate across short-lived entities so the model has enough consistent history to learn from. In Kubernetes, for example, deployment is usually a better baseline dimension than individual pod ID. Choose the right threshold behavior. Decide whether the alert should trigger on values above the learned upper bound, below the lower bound, or both. Start with medium sensitivity. Use Medium as a balanced default, then tune up or down based on noise and missed anomalies. Allow enough historical data. Dynamic thresholds improve as more history is collected. Initial seasonal patterns use recent history, and weekly seasonality becomes more effective after several weeks of data. Get started Ready to try it? Create a query-based metric alert with dynamic thresholds on your metrics in Azure Monitor Workspace. You can create such rules in the Azure portal, where the built-in preview chart shows when your dynamic threshold alert would have fired based on historical baseline analysis. Use the preview chart to tune both the PromQL query and the dynamic threshold sensitivity before enabling the rule. You can also create query-based metric alert rules using programmatic interfaces or resource templates. Figure 1. Dynamic thresholds preview chart showing the learned baseline and the points where an alert would have fired. Dynamic thresholds cut alert noise where it starts — at detection. The alerts that do fire connect into Azure Monitor’s broader AIOps experience, where the Azure Copilot Observability Agent can help correlate signals into investigated issues with explainable reasoning — with humans in control. Next steps Related blog: Anomaly detection made easy with Dynamic thresholds for Log search alerts Dynamic thresholds in Azure Monitor Query-based metric alerts overview Create query-based metric alerts Prometheus metrics in Azure Monitor OpenTelemetry on Azure Monitor Stay connected Follow the Azure Observability Blog for more updates on Azure Monitor, Prometheus-based monitoring, alerting, and troubleshooting experiences. We’ll continue sharing product updates, practical guidance, and examples to help you improve observability across your Azure environments. Feedback We’d love to hear how dynamic thresholds for query-based metric alerts work for your scenarios. Share your feedback through your Microsoft account team, Azure support channels, or the feedback options in the Azure portal so we can continue improving the experience.212Views0likes0CommentsModern VM monitoring, powered by OpenTelemetry
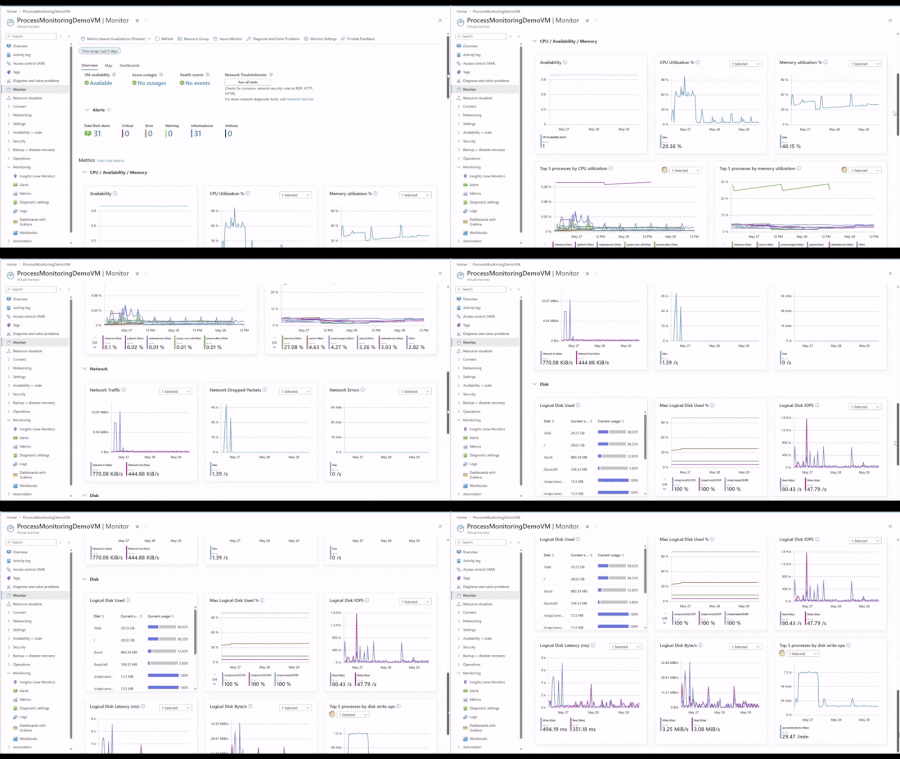
At Build 2026, we're announcing the general availability of OpenTelemetry (OTel) Guest OS metrics for Azure VMs and Arc-enabled Servers. OTel provides a standards-based foundation for VM monitoring with consistent metrics across Windows and Linux, richer Guest OS and per-process visibility, and streamlined integration with open-source and cloud-native observability tools. Alongside the GA, we're introducing an enhanced VM monitoring experience, recommended alerts, and out-of-the-box Grafana dashboards, all powered by OTel Guest OS metrics. We're also sharing upcoming VM troubleshooting capabilities in the Azure Copilot observability agent enriched by OTel Guest OS metrics. What are OpenTelemetry Guest OS metrics OTel Guest OS metrics are collected from inside a VM. Today's coverage includes a curated set of CPU, memory, disk I/O, networking, and per-process metrics including CPU utilization, memory usage, uptime, and thread count. The supported set is point-in-time and will continue to expand as the OTel Host Metrics Receiver evolves upstream. This level of visibility helps customers diagnose operating system and application issues without manually signing into individual VMs. Why they matter 1. Lower cost and faster queries Default OTel Guest OS metrics are available at no additional cost. They are stored in Azure Monitor Workspace using metric-optimized storage and pricing, providing lower cost and faster query performance compared to LA-based metrics. 2. Per-process visibility for deeper troubleshooting Customers can optionally enable per-process metrics for deeper visibility into VM resource consumption. This helps identify noisy processes, memory leaks, runaway jobs, or resource-intensive applications without manually signing into the VM. 3. Consistent metrics across Windows and Linux Use the same metric names, dashboards, and alerts across operating systems without maintaining separate monitoring configurations. 4. Native PromQL support Use PromQL with the scale and managed experience of Azure Monitor Workspace. 5. OpenTelemetry-based standardization Use the same metrics across Azure Monitor, existing OTel pipelines, or other compatible observability backends. Log Analytics (LA)‑based metrics vs OTel‑based metrics Customers running workloads on Azure VMs and Arc-enabled Servers have long relied on Log Analytics (LA)-based metrics for fleet visibility. That experience continues to be generally available and trusted by thousands of customers. We recommend evaluating your requirements to determine which approach best suits your needs. LA-based metrics remain the foundation for customers who need advanced analytics and correlation, while OTel-based metrics open new possibilities for modern VM observability. Learn more. New Capabilities Powered by OpenTelemetry VM monitoring experience powered by OpenTelemetry (GA) We're excited to announce the general availability of the enhanced monitoring experience for Azure VMs and Arc servers. This experience brings comprehensive monitoring capabilities in a single, streamlined view, helping you more efficiently observe, diagnose, and optimize your virtual machines. The new experience offers two levels of insight within one unified interface: Basic view (Host OS-based): Available for all Azure VMs with no configuration required. This view surfaces key host-level metrics including CPU, disk, and network performance for quick health checks. Detailed view (Guest OS-based): Requires simple onboarding. Azure Monitor continues to support the GA detailed view powered by Log Analytics-based metrics. Customers can now choose to power the experience using OTel Guest OS metrics, which enable recommended alerts and provide expanded visibility into Guest OS and process-level resource consumption, including CPU, memory, disk I/O, and networking. Dashboards with Grafana for VMs For deeper analysis and customization, customers can leverage Azure Monitor dashboards with Grafana powered by OTel Guest OS metrics and PromQL at no additional cost. Built-in dashboards provide out-of-the-box visualizations for at-scale monitoring, host-level monitoring, Guest OS monitoring, and per-process monitoring, while still allowing teams to: Customize panels and dashboards Run ad hoc investigations Import dashboards from the Grafana community Share dashboards using Azure RBAC and ARM/Bicep deployment support Together, the enhanced VM monitoring experience and Grafana dashboards provide both streamlined day-to-day monitoring and flexible deep troubleshooting capabilities for modern VM environments. Query metrics in the context of your resources (GA) We’re also announcing the general availability of resource-scope querying for Azure Monitor Workspace (AMW) metrics, including OTel Guest OS metrics. With resource-scope query, you can query metrics directly from the context of a resource, resource group, or subscription, without needing to know which workspace stores the data. This simplifies troubleshooting, aligns with Azure-native workflows, and enforces least-privilege access using Azure RBAC. This capability powers scenarios like querying OTel Guest OS metrics directly from the Virtual Machine resource in Azure Portal, or resources can be scoped as a dedicated data source in Grafana to query with PromQL, making it easier for application and infrastructure teams to monitor and troubleshoot in the context of their workloads. Coming soon: Observability Agent Troubleshooting for VMs (Public Preview) Today, the Observability Agent helps customers investigate issues by correlating applications, infrastructure signals, LA-based metrics, logs, alerts, health information, and recent changes into a guided investigation narrative. Support for OTel Guest OS metrics is coming soon, extending investigations with richer Guest OS and per-process visibility. With OTel Guest OS metrics, the Observability Agent will be able to incorporate finer-grained operating system and process-level insights into its analysis, helping customers more quickly identify resource bottlenecks and understand their impact on application performance. Instead of manually piecing signals together across multiple tools and timelines, customers will receive a guided investigation summary with likely causes and recommended next steps. Combined with the new VM monitoring experience and Grafana dashboards, customers will have both AI-assisted investigations and powerful manual troubleshooting tools built on the same OTel foundation. Onboarding VMs at scale to OpenTelemetry Onboarding Azure VMs and Arc-enabled Servers to OTel Guest OS metrics is now simpler and more cost-efficient than ever. For teams getting started at scale, the easiest path is through the Monitoring Coverage experience in the Azure portal, where you can review recommended resources and onboard VMs through a guided workflow. Customers that prefer infrastructure-as-code can use ARM and Bicep templates to apply the same monitoring configuration programmatically. Azure Advisor recommendations provide another seamless entry point for onboarding, proactively identifying VMs that are not fully monitored and guiding customers to enable OTel -based monitoring with a few clicks. This helps teams continuously improve coverage across their fleet without needing to manually audit resources. Customers can now also reuse an existing Data Collection Rule (DCR) during onboarding, making it easier to standardize monitoring across large VM fleets. After onboarding, teams can centrally evolve their monitoring configuration by updating that DCR to collect additional metrics and logs, with changes applying across all associated VMs. Get Started Explore the new OpenTelemetry-powered experiences today: Enable enhanced monitoring for an Azure virtual machine - Azure Monitor Migrate from logs-based to OpenTelemetry metrics for Azure virtual machines - Azure Monitor Metrics experience for virtual machines in Azure Monitor - Azure Monitor Use Dashboards with Grafana for Azure Virtual Machines - Azure Monitor999Views3likes1CommentAzure Monitor SLIs now Generally Available
Azure Monitor SLIs are now generally available Service Level Indicators (SLIs) and Service Level Objectives (SLOs) in Azure Monitor are now generally available. Teams can now measure reliability based on customer experience, not just infrastructure signals. SLI: A quantitative measure of how well an application or service is performing from the customer’s point of view. SLO: A defined target for an SLI that represents how good or bad the SLI is over a given time-period. This is also referred to as a baseline in Azure Monitor. Traditional monitoring shows what is happening across your systems, but not always what customers are experiencing. A service can be technically available and still feel unreliable because of latency, partial failures, or dependency issues. SLIs help close that gap by measuring reliability from the customer’s point of view. With GA, Azure Monitor now brings SLI authoring, SLO tracking, error budgets, and burn rate–based alerting into one experience, helping teams focus on whether they are meeting the reliability their customers expect. What Azure Monitor SLI helps you do Azure Monitor SLI lets you measure availability and latency with either request-based or window-based evaluation methods. In Azure Monitor, SLIs are defined at the Service Group level, which provides a logical representation of your application across multiple resources. This gives teams a clearer view of application health, customer impact, and the signals that matter most. SLIs continuously evaluate your service by using existing Azure Monitor metrics and store the resulting evaluations in your Azure Monitor Workspace. Azure Monitor uses these SLI evaluations to power error budgets, burn rate visualization, and alerting. This helps teams spot reliability issues earlier and make better release and incident response decisions. Get started To get started, you’ll need: A Service Group. Application metrics flowing into an Azure Monitor Workspace, for example through Managed Prometheus or OpenTelemetry Collect and analyze OpenTelemetry data with Azure Monitor (Preview) - Azure Monitor | Microsoft Learn Learn more here. Summary Azure Monitor SLI helps teams measure customer experience, track reliability against clear targets, and respond sooner with error budgets and burn rate–based alerting. Learn more in the product documentation and start defining SLIs for your services in Azure Monitor today.540Views0likes0CommentsPUBLIC PREVIEW - Azure Monitor - Collect Azure Resource Platform Logs at Scale with DCRs
PUBLIC PREVIEW - Azure Monitor - Collect Azure Resource Platform Logs at Scale with DCRs. How DCR-based platform logs simplify the telemetry collection for organizations managing 1,000+ resources.1.1KViews2likes1Comment
Connect Metrics to Traces with Exemplars in Azure Monitor
Following Microsoft’s recent GA announcement for OpenTelemetry (OTel) support, we are excited to announce support for Exemplars for customers instrumenting metrics with Prometheus or OpenTelemetry and traces using OpenTelemetry, enhancing Azure Monitor’s integrated observability experience for cloud-native applications. Modern cloud-native applications generate enormous volumes of telemetry. Metrics help teams detect that something is wrong, but traces explain why. Exemplars bridge these two worlds by attaching trace references directly to metric data points, making it dramatically easier to pivot from a spike in latency or errors to the exact distributed trace responsible for the issue. With Azure Monitor, customers can now ingest metrics with exemplars and visualize them in Azure Managed Grafana. This enables seamless correlation between metrics and traces, helping engineering teams troubleshoot issues faster and reduce mean time to resolution (MTTR). Why Exemplars Matter Traditional monitoring workflows often require users to manually correlate data across multiple systems. Exemplars simplify this workflow by embedding trace context directly into metric samples. For example, if a latency metric spikes at a specific timestamp, the exemplar associated with that data point can link directly to the distributed trace responsible for the outlier. This provides several benefits: Faster root cause analysis Quicker transition from aggregate metrics to request-level details Simplified debugging workflows for SRE and platform teams Better observability experiences for microservices and distributed applications Unified Observability with Azure Monitor With Azure Monitor and Azure Managed Grafana, you can now: Ingest OTLP or Prometheus metrics with exemplars into Azure Monitor Workspace Store and analyze traces in Azure Monitor Application Insights Visualize exemplar markers directly in Grafana charts Navigate from a metric spike to the exact distributed trace associated with that data point By combining these signals in a single observability platform, organizations can correlate infrastructure health, application behavior, and request traces without context switching between tooling. How It Works Once metrics, exemplars, and traces are ingested into Azure Monitor, Azure Managed Grafana can consume exemplar information from the configured Prometheus data source. When exemplars are enabled in Grafana dashboards, users will see markers associated with individual metric data points. Selecting an exemplar opens the associated trace in Azure Monitor, providing end-to-end diagnostic context. Getting Started Setup data ingestion: Instrument your application to emit OpenTelemetry traces, OpenTelemetry or Prometheus metrics with exemplars, and enable ingestion of the same to Azure Monitor using OpenTelemetry Collector. Follow the instructions in Ingest OTLP Data into Azure Monitor with OTel Collector - Azure Monitor | Microsoft Learn. After this step, you will have the Log Analytics Workspace, Azure Monitor Workspace and Application Insights resources all set up to store the telemetry data. Create an Azure Managed Grafana instance and connect it with the Azure Monitor Workspace by navigating to your Azure Monitor Workspace in the Azure portal and then clicking on “Linked Grafana workspaces”. To learn more, see Manage an Azure Monitor workspace - Azure Monitor | Microsoft Learn Optionally, enable Azure Managed Prometheus on your AKS cluster or use remote-write and configure it to use the same Azure Monitor Workspace to centralize infrastructure and application metrics. Enable Exemplars in Azure Managed Grafana: After setting up the data ingestion, ensure that logs and traces are flowing into Log Analytics Workspace, and metrics are flowing into Azure Monitor Workspace. Step 1: Enable Exemplars on Prometheus Data Source in Azure Managed Grafana Navigate to Connections -> Data Sources in Azure Managed Grafana. Since you have connected Azure Managed Grafana to Azure Monitor Workspace, you will see the data source (Managed_Prometheus_<AMW-Name>) already configured. If the data source is not configured, follow the steps here to add your Azure Monitor Workspace as a data source. Open the data source configuration. Click Add Exemplars to enable exemplar support. Step 2: Configure Trace Linking with Azure Monitor In the exemplar configuration section, toggle Internal Link to On. Select Azure Monitor as the data source. In the Label Name, enter the name of the field in the labels object that should be used to get the trace id, eg. trace_id. Click Save & Test. This configuration enables direct navigation from exemplar markers in Grafana charts to the associated traces stored in Azure Monitor. Azure Managed Grafana also supports trace correlation from other solutions like Jaeger etc. To use your trace solution, use the appropriate links. Step 3: Enable Exemplars in Dashboards Navigate to a Grafana dashboard that uses your configured Prometheus data source. Open the panel options for a metrics chart. Toggle Exemplars to On. Once enabled, exemplar markers will appear on supported metric visualizations. Clicking on it will show exemplar details along with an option to open the corresponding distributed trace in Azure Monitor. To learn more, visit https://aka.ms/azmon-exemplars329Views1like0CommentsWhen Telemetry Volume Gets Real: Azure Monitor pipeline’s Performance Story!
What is Azure Monitor pipeline? Azure Monitor pipeline provides centralized governance and a single point of control that runs close to your data sources, so you can filter, transform, aggregate, and route telemetry before it's sent to Azure Monitor. This approach helps you reduce ingestion volume, improve reliability in disconnected environments, and apply consistent data processing across hybrid and multi-cloud deployments. Built on OpenTelemetry technology, the pipeline supports standard ingestion protocols including Syslog and OTLP, enabling it to receive telemetry from a wide range of clients and environments. Read more about Azure Monitor pipeline here - Azure Monitor pipeline GA: Centralized, Secure Telemetry Ingestion Azure Monitor pipeline Performance A single replica on a stock 8-core node sustains ~200,000 Syslog messages per second end-to-end into Log Analytics — roughly 17 billion events or ~20 TB per day — using only ~2.8 GB of working-set memory. That's ~2.5 TB/day of throughput per vCPU, on commodity hardware, with no special tuning. (Measured on pipeline v1.1.1, May 2026.) Find more detailed performance information in the table below - vCPUs Example node Syslog Basic* Syslog Fully Formed* CEF Fully Formed* 2 Standard_D2as_v6 ~50,000/sec ~35,000/sec ~17,000/sec 4 Standard_D4as_v6 ~100,000/sec ~70,000/sec ~35,000/sec 8 Standard_D8as_v6 ~200,000/sec ~150,000/sec ~65,000/sec 16 Standard_D16as_v6 ~400,000/sec ~300,000/sec ~130,000/sec Syslog Basic* – Azure Monitor pipeline ingesting raw syslog data into Azure Monitor custom table Syslog Fully Formed* – Azure Monitor pipeline ingesting syslog data in Azure Monitor standard syslog table CEF Fully Formed* – Azure Monitor pipeline ingesting CEF data in Azure Monitor standard CEF table Further, adding replicas scales throughput linearly. Linear scaling is what makes the rest of the performance story credible in practice: if one 4-core node handles about 100,000 Syslog logs per second, eight replicas scale that to roughly 800,000 logs per second without changing the architecture. In other words, you do not hit an arbitrary throughput wall as volume grows—you add cores or replicas and get predictable capacity growth. We are continuously improving these numbers, and the latest guidance is documented here -- Azure Monitor pipeline performance and sizing - Azure Monitor | Microsoft Learn Why this Performance Story Matters? Zero-config core usage. The pipeline automatically uses every available CPU core. Move to a bigger node and it just goes faster — no tuning, no config. Backpressure, not data loss. When you exceed capacity, the pipeline applies TCP backpressure to senders instead of dropping messages. Rising send latency is your scale-up signal. Predictable sizing math. Pick your per-vCPU rate, divide your peak logs/sec, add 30% headroom, round up. Done. Efficient memory usage. ~2.8 GB working-set to push 200,000 logs/sec means you're paying for throughput, not overhead. One sizing tip worth knowing: make sure senders open at least as many concurrent TCP connections as there are cores on the pipeline node. The pipeline distributes traffic across cores by source connection, so too few connections leave cores idle. How this Stacks Up? Telemetry pipelines are usually sized per CPU core, making per-core throughput a practical way to reason about capacity and scaling. Against that backdrop, ~2.5 TB/day per vCPU for Syslog Basic — and ~65,000–150,000 logs/sec, on 8 cores for fully formed records — highlights the per-core efficiency of Azure Monitor pipeline for edge log collection. Exact numbers will vary based on event size and processing applied, but the key point is consistency: you get substantial throughput per core, and it scales linearly as you add capacity. Less hardware to move the same volume, efficient memory usage, backpressure instead of loss, and linear growth — that's the performance case for Azure Monitor pipeline. Get started Spin up a pipeline group on your Arc-enabled cluster, point your Syslog/CEF senders at it, and watch the throughput numbers above hold up in your own environment! Read more about getting started here -- What is Azure Monitor pipeline? - Azure Monitor | Microsoft Learn253Views0likes0Comments
Is Your Monitoring Actually Working? What's New in Monitoring Coverage
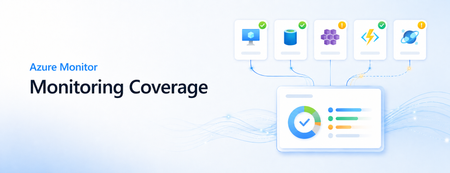
Monitoring is only useful when the right signals are collected, the right alerts are in place, and the data is actually flowing when teams need it. In large Azure environments, confirming all three across every VM and AKS cluster can still take too much manual work. At Microsoft Ignite, we introduced Monitoring Coverage in Azure Monitor, a centralized preview experience for finding coverage gaps and enabling recommended VM and container monitoring at scale. At Microsoft Build, we are expanding that experience with two new capabilities that make monitoring easier to operationalize: data flow status and at-scale recommended alert enablement for virtual machines and Azure Kubernetes Service (AKS). With these updates, teams can move beyond asking whether monitoring was configured. They can see whether recommended monitoring is enabled, whether important alert coverage is missing, and whether configuration issues may prevent monitoring data from reaching its destination. Monitoring Coverage overview with recommendations and data flow status. What is Monitoring Coverage? Monitoring Coverage in Azure Monitor gives you a single place to review recommended monitoring across supported Azure resources. The Overview page summarizes coverage across your selected scope, shows Azure Advisor observability recommendations, and provides quick actions to enable recommended monitoring settings. Coverage is grouped into basic, partial, and enhanced monitoring so you can quickly understand whether a resource is using only default monitoring or has the Microsoft-recommended configuration enabled. From there, you can drill into the Monitoring Details tab to review individual resources and take action. New: data flow status The most important question after enabling monitoring is simple: is the data flowing? Data flow status helps answer that question directly from Monitoring Coverage. The new data flow status summary shows how many resources need attention, passed initial checks, or are not configured for validation. It also highlights top resources that need attention so operators can start with the most important issues first. When you open data flow status for a resource, Azure Monitor shows validation checks across areas such as: Resource configuration Data collection rule associations Network connectivity Data flows to the configured destination Detected issues are prioritized at the top of the details pane, and each validation check includes a recommended action. After making a fix, you can run validation again to confirm that data flow issues are resolved. Data flow status details with validation checks and recommended actions. Alternatively, you can visualize your data flows and identify problems from there. New: enable recommended alerts at scale Monitoring Coverage now also helps close alerting gaps. From the Overview page, you can see recommendations such as Enable VM Recommended Alerts and Enable AKS Recommended Alerts, then select Apply to configure recommended alert rules from a centralized flow. For virtual machines, you can enable alerts across an entire subscription or choose selected resources. Subscription scope is useful when you want recommended alerts to apply broadly, including to future VMs in the selected subscription. Selected resource scope gives you more granular control when you want to enable alert rules for a specific set of VMs. The enablement flow lets you review recommended alert rules, adjust thresholds, and configure notification options such as email, Azure Resource Manager role notifications, Azure mobile app notifications, or an existing action group. Some VMs may already have alerts configured, and new rules are designed not to duplicate existing alerts. For AKS, Monitoring Coverage can surface recommended alert gaps and start the same guided pattern: review impacted resources, configure recommended alert settings, and use Review + Enable to create the alert rules. A resource-centric view for follow-up The Monitoring Details tab brings coverage and data flow into the same resource list. Two columns are especially useful for triage: Monitoring coverage and Data flow status. Select either value to open resource-level details. Monitoring coverage details show what is configured for the resource, including VM Insights, recommended alerts, data collection rules, data sources, destinations, and agent version when available. Data flow details show validation results and recommended remediation steps. This makes it easier to move from a high-level gap to the specific resource and configuration that needs attention. Getting started Monitoring Coverage is available in preview from the Azure portal. Open Monitor, select Monitoring Coverage (preview), and choose the subscriptions and resources you want to review. From the Overview page, you can: Review coverage across VMs and AKS resources. Apply recommendations to enable VM Insights, container monitoring, and recommended alerts. Use data flow status to find resources whose monitoring data needs attention. Open Monitoring Details for resource-level coverage and validation results. A few preview notes: enablement operations include up to 100 resources at a time, and enabling monitoring or alert rules may create data collection rules, deploy Azure Monitor Agent, configure destinations, or create alert rules. Data collection, workspace ingestion, and alert rules may incur costs based on the settings you enable. To learn more, see Monitoring coverage in Azure Monitor (preview). Looking ahead Monitoring Coverage is part of our continued work to make Azure Monitor easier to operationalize at scale. We want teams to spend less time hunting for monitoring gaps and more time acting on reliable, validated signals. We would love your feedback as you try these new Build updates and we look to expand support beyond this set of resource types. Use the Azure portal feedback options or share feedback through your Microsoft account team.385Views1like0CommentsWhat’s new in Observability at Build 2026
At Build 2026, Azure Monitor introduces major advancements in end-to-end observability, extending across AI agents, applications, and infrastructure with OpenTelemetry at its core. New capabilities with Azure Copilot Observability agent, SLI/SLO support, and smarter alerting help teams move faster from detection to root cause while reducing noise and manual effort. Together, these innovations enable developers and SREs to operate modern, AI-driven systems with greater insight, efficiency, and alignment to customer experience.1.2KViews2likes0CommentsAny source. Any destination. Ready for AI-era.
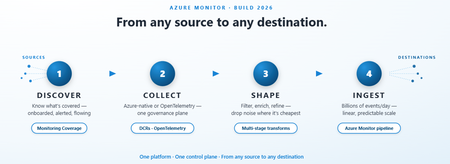
Telemetry is exploding, every new app, edge node, and AI agent is a new firehose, and AI has raised the bar on what that telemetry must be: governed, on open standards, observable at agent scale. Today, most teams answer that by stitching together a stack of disconnected tools, each catering to a set of data sources, another that offers transforms, different ones for routing to each destination, and wrappers on top for some essence of much-needed enterprise governance, all struggling to be held together by glue code and tribal knowledge. This is the gap we're closing at Build 2026, with every announcement lining up with what modern, AI-shaped workloads need most: An AI-native standard, ready for enterprises: OpenTelemetry direct ingest, GA Headroom for bursty AI-agent traffic: Azure Monitor pipeline scaling to billions of events per day One governance plane for AI and Azure platform telemetry (via DCRs) AI-noise controlled at the right point in the journey: Multi-stage transforms Coverage AI can trust: Monitoring Coverage so AI can reason on complete signals instead of blind spots. …..All organized around the journey your data takes: 1 · Discover Most teams think they're monitoring everything, until an incident proves they aren't! Monitoring Coverage turns hope into evidence by answering 3 questions at fleet scale: is monitoring configured, are the right alerts in place, is telemetry actually flowing? Go from “I think we’re covered” to “I know we are”: Is Your Monitoring Actually Working? What's New in Monitoring Coverage | Microsoft Community Hub 2 · Collect Whatever your source, Azure-native or open standard, you shouldn't need a different platform, agent, or governance model to bring it in. At Build, two big shifts close that gap: Govern Azure platform telemetry like the rest of your data: No more per-resource diagnostic settings or separate tooling for platform metrics and logs. They now ride the same policy-based control plane you already use for the rest of Azure Monitor with one model, one audit story, scoped at scale. Platform metrics support - GA Platform logs support - Public preview coming soon! Bring OpenTelemetry straight in - GA: Send OTLP logs, metrics, and traces directly to Azure Monitor and land them in Application Insights, Log Analytics, Azure Monitor Workspace (Prometheus), and Grafana, no shim, no detour! Direct OpenTelemetry ingestion into Azure Monitor is now generally available Have additional OTel collection needs? Tell us us more by filling out this quick survey! 3 · Shape Observability and storage budgets are dying a death by a thousand low-value log lines. The question today is no longer whether to shape your telemetry, it's where. Multi-stage transformations (public preview) now lets you control telemetry where it matters: at the source, in-pipeline, or post-ingest before, all before data lands at its destination. Drop noise early, enrich centrally, and optimize cost without losing signal: Is 94% of your syslog just noise? Now you can filter it out before ingestion. | Microsoft Community Hub 4 · Ingest at scale When telemetry volume spikes, you need a pipeline that doesn't blink. 17 billion events, per day, per replica. That's what Azure Monitor pipeline now sustains, generally available since April ’26, as the living proof of ‘any source, any destination’. This is the high-scale, multi-cloud, edge-resilient engine already trusted in regulated banks, industrial OT networks, and globally distributed SOCs. That's the kind of headroom you want when AI agents start emitting in bursts you didn't plan for: When Telemetry Volume Gets Real: Azure Monitor pipeline’s Performance Story! | Microsoft Community Hub Get Started TODAY! Explore the links above, try the new experiences in Azure Monitor, and tell us in comments below what to build next. The next era of enterprise telemetry is here. We can't wait to see what you'll build on it. — Your Azure Monitor team246Views0likes0Comments