modern apps
139 TopicsIntroducing Azure Container Apps as a target workload in Azure Migrate
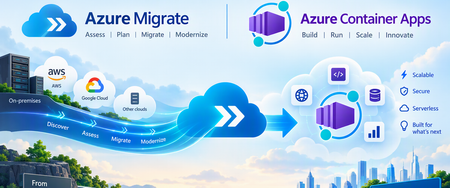
We are excited to announce Azure Container Apps as a target workload for assessment in Azure Migrate, helping organizations evaluate existing web applications for migration to a managed, serverless container platform. This capability extends the Azure Migrate assessment experience to Azure Container Apps, bringing application readiness, migration requirements, sizing recommendations, and estimated hosting costs into migration planning. Organizations can identify suitable applications, understand the changes required, and make informed decisions before starting migration. Supported workloads include Web Apps discovered through Azure Migrate Make informed modernization and migration decisions For organizations with an existing application estate, modernization starts with a few essential questions: Which applications are suitable for container-based hosting? What needs to change? What resources will they require, and what will they cost to run? Azure Migrate helps answer these questions through discovery and assessment. With Azure Container Apps as a workload target, migration teams can: Assess application readiness: Evaluate existing web applications for migration to Azure Container Apps. Identify migration requirements: Review compatibility issues, warnings, and recommended remediation. Review resource recommendations: Understand the compute requirements of the assessed applications. Estimate hosting costs: Use assessment estimates to support migration decisions and budgeting. Plan migration waves: Turn assessment insights into manageable migration batches. These insights help migration teams and application owners establish a shared understanding of migration scope, effort, and priorities. Why Azure Container Apps? Azure Container Apps enables organizations to run containerized applications without managing servers or the underlying container orchestration infrastructure. The platform supports web applications, APIs, microservices, and background processing, with capabilities including: Automatic scaling based on HTTP traffic or event-driven rules, including scale-to-zero for supported configurations. Managed ingress for application endpoints. Application revisions and traffic splitting to support controlled updates. Connectivity to dependent services, including databases, storage, and messaging. Adding Azure Container Apps as an assessment target helps organizations evaluate these capabilities against the requirements of existing applications before migration begins. From discovery to migration 1. Discover existing web applications Start with an Azure Migrate project and configure the Azure Migrate appliance for the source environment. Discovery builds an inventory of web applications and their hosting servers. Review the discovered applications and dependency information to establish the assessment scope. Review discovered web applications and select workloads for assessment. The inventory includes discovered workloads; discovery alone does not establish readiness for Azure Container Apps. 2. Assess for Azure Container Apps Create a web app assessment for the selected applications and choose Azure Container Apps as the target. Configure the applicable assessment settings, including target region and sizing preferences, then run the assessment to generate readiness findings, resource recommendations, and estimated costs. Create an assessment for the discovered web app workloads. 3. Review results and decide Review the assessment findings to understand which applications are ready for migration and which require changes. Evaluate migration issues alongside business criticality, application dependencies, and operational requirements. Use these insights to select applications for migration and prioritize modernization work. Navigate to the Azure Container Apps tab for more details on the readiness Review readiness and estimated monthly costs for Azure Container Apps. This example shows three web apps ready for migration and one not ready, with a cost estimate for the three ready apps. Estimates vary by workload and assessment settings. 4. Plan migration waves After selecting the migration path, use Azure Migrate wave planning, to organize assessed applications and workloads into migration batches. Review the proposed waves, sequencing, dependencies, and risks. Refine assignments with application owners and stakeholders, then commit approved waves. Committing a wave accepts the migration plan; it does not start migration. The approved scope and assessment findings provide the foundation for application preparation and deployment. 5. Migrate to Azure Container Apps Continue the approved migration plan in GitHub Copilot app modernization, using the Azure Migrate assessment findings, application scope, and dependency information as context. The tooling handles application code changes, validation, containerization, and deployment to Azure Container Apps. Follow the workflow for the application's language: Java: Migrate with GitHub Copilot app modernization, including containerization and deployment to Azure Container Apps. .NET: GitHub Copilot modernization overview and deployment workflow. Get started Assess existing web applications for Azure Container Apps and move forward with a migration grounded in application readiness, resource requirements, and cost insights. Explore the resources: Azure Migrate overview Azure Container Apps overview Migrate to Azure Container Apps with Azure Migrate Containerize Java Web Apps and Migrate to Azure Container Apps - Azure Migrate211Views0likes0CommentsPython support has arrived in the guided Copilot experience for VS Code
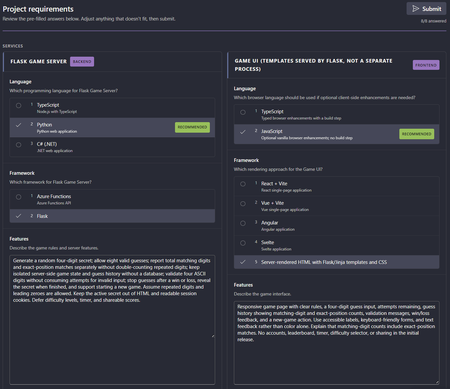
When we introduced the guided Copilot experience for building Azure apps in VS Code, we started with JavaScript and TypeScript, with Python on the roadmap. Since then, we've seen people creating Python projects with the experience, and we wanted to make sure our Python lovers had proper support. Today, we're excited to announce that the guided Copilot experience in VS Code now fully supports Python projects. 🐍 From Python idea to Azure app The guided experience helps you move from an idea to a deployed Azure app through a structured workflow, with checkpoints for reviewing important decisions. Now Python developers can use that same experience to: Plan and scaffold: Describe your app, review the proposed architecture, and approve a plan before code is generated. Develop locally: Get help preparing your development environment, then run and iterate on your Python project in VS Code. Deploy to Azure: Review the deployment tools, resources, and estimated costs before deploying your app. This guided path complements the free-form Copilot workflows you already know, so you can choose the approach that works best for you. Give it a try Install the Azure Tools extension pack, open an empty folder in VS Code, and start the guided Copilot experience with your Python project in mind. Whether you're building an API, prototyping an idea, or learning something new, we'd love to see what you create. Have feedback? Share it with us on GitHub. Thanks to everyone who's been building Python projects with the experience. We're excited to see what you make next!140Views0likes0CommentsWhy Did Our Azure Bill Change? Investigating Cloud Spend with Azure SRE Agent
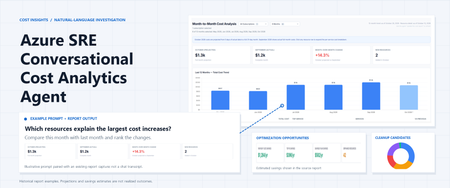
The question after the cost chart The monthly cost review usually starts with a straightforward observation: Azure spending changed. Then come the questions that take the time. Which subscription accounts for the increase? Is it an existing workload getting more expensive, or something that only started generating charges this month? Did a reduction somewhere else hide part of the increase? And which optimization recommendations are worth taking to a workload owner? Azure already has the underlying information. Cost Management provides spending data. Azure Advisor provides optimization recommendations. Resource inventory provides context about what those resources are. The work is connecting those sources into an explanation that someone can check and act on. Conversational Cost Analytics Agent: a solution built around Azure SRE Agent that lets operations and FinOps leads start with a question, investigate cost drivers, identify optimization opportunities, and generate reusable reports. The solution can also generate proactive alerts and scheduled reports. Scope of this post: The repository contains a prototype, an importable dashboard template, reusable skills, and example report screenshots. These demonstrate the reporting approach; they are not evidence of measured customer savings, verified production readiness, or a completed deployment in your environment. The prompts below are examples to try, not a transcript of a measured production investigation. What we built This is a custom cost-investigation workflow on Azure SRE Agent, not a separate billing system or a claim that every feature is available out of the box. The solution brings together three pieces: An analytical skill that describes how to compare spending, calculate resource contributions, identify newly billed resources, and handle incomplete periods. A query-reference skill that records the Cost Management query patterns, response shapes, aggregation rules, and SRE Agent tool mappings used by the dashboard workflow. An HTML Live Report template that presents subscription selection, summary metrics, six-month trends, and expandable resource-level comparisons. The distinction matters. A template determines how findings appear. A skill determines how the agent should investigate. Neither replaces access to the underlying data. The agent still needs scoped permissions, supported tools, and a successful data refresh before the report can represent your subscriptions.' How the investigation works The workflow starts by discovering the subscriptions the agent can access. It then queries Cost Management for historical totals and current- and previous-month resource-level details, aggregates the results, and populates the report template. Source or component Role in the investigation Azure Cost Management Billing-based cost data and historical comparisons Azure Resource Graph Resource inventory and metadata enrichment, not cost data Azure Advisor Optimization recommendations to review alongside spending Reusable agent skills Investigation rules, query patterns, and interpretation guardrails Live Report template Interactive presentation of the refreshed data snapshot How cost data is collected: The agent sends a request to Azure Cost Management to retrieve spending data. The request uses HTTP POST, so the kit runs it through RunAzCliWriteCommands, even though it only reads data. Reading costs does not change resources: This query does not resize, delete, or modify resources. Still, configure permissions and tools carefully to limit what the agent can do. The report shows the most recently refreshed data: Opening the report displays the data collected during its most recent refresh. It does not automatically request updated billing data. Fetching data directly from the report requires a connector: A supported connector gives the report access to a cost-query tool. The report cannot directly use the agent’s built-in CLI tools. You can start without a connector: Use the report with periodically refreshed data, and add a connector later if you need to fetch updates directly from the report. Four questions to explore in the report 1. Where is spending heading? Start with the broad view: The overview brings subscription selection, summary KPIs, previous-month actuals, and an adjustable cost trend into one view. Select the number of months you want to compare, up to 12, and expand any month to explore the services behind the spending changes. Figure 1. Historical prototype snapshot, not current pricing or a verified financial result. The current-month KPI is a projection; the screenshot does not establish that the partial-month trend bar uses the same basis. Reconcile those values and use consistent labels before relying on the comparison. This is also where an apparently simple comparison can become misleading. Ten days of current-month spend and a full previous month are not comparable periods. For an in-progress month, ask for matched month-to-date periods when investigating change. If the report displays a full-month run-rate projection, keep it labeled as a projection. Do not describe it as a Cost Management forecast unless that forecast was actually retrieved. The useful outcome is not just a larger or smaller bar. It is an explicit statement of the period, cost basis, currency, and freshness behind that bar. 2. Which resources explain the change? Once the subscription-level movement is clear, move to the contributors: "Rank the resources driving increases and decreases. Separate newly billed resources from existing resources whose costs changed." The resource view compares spending at the resource level, highlights resources appearing in the current period’s billing data, and supports expandable service breakdowns. Figure 2. Historical prototype comparison. The screenshot's "New Resources" label means newly observed in billing, not confirmed creation. In this example workflow, current-month "Full" values are projections, not completed-month actuals. The agent can help break down cost changes that might otherwise require multiple spreadsheets and time-consuming manual comparisons: New charges do not always mean new resources: An existing resource may start generating charges after a period of inactivity. Costs may also rise because of autoscaling, longer VM running hours, increased storage usage, more read/write operations, or billable data transfers. These changes can be difficult to spot in summary reports. Newly created resources can add to spending: The agent can highlight resources appearing in the current period’s billing data. Resource inventory or deployment history is needed to confirm whether they were newly created or simply started generating charges. One resource can have several cost entries: A resource may appear in multiple billing records for different services or meters. Adding the relevant entries together helps show its total cost and contribution to the change. The net change can hide larger movements: For example, if one resource’s cost increases by $800 while another decreases by $300 over comparable periods, the net increase is $500. Showing both changes reveals the increase and the offsetting reduction. These figures are illustrative. Finding the cost driver is not the same as finding the cause: Identifying which resource contributed to an increase is the first step. Explaining why it happened may require additional evidence about usage, configuration changes, pricing, or other factors. 3. Which optimization opportunities deserve attention? The next question is usually practical: "Show Azure Advisor cost optimization recommendations for the subscriptions in scope. Separate estimated savings from confirmed spending reductions." The repository includes an example Advisor optimization view for reviewing rightsizing and commitment-related opportunities alongside the cost investigation. Figure 3. Historical prototype optimization view. Displayed savings are estimates, not realized savings; low CPU alone does not establish that shutdown is appropriate. A displayed zero for reservations requires a successful, authorized query before it can be interpreted as no reservations. The useful next step is to review the findings with the workload owner, not to make an automatic purchase or resize a resource. Rightsizing can change the baseline for a reservation or savings plan decision. Recommendations can also overlap, so adding every displayed savings figure may overstate the opportunity. Billing and commitment visibility depend on the identity's actual access; subscription resource access does not automatically expose every reservation or savings plan dataset. An unavailable dataset should be reported as unavailable. It should never silently become "no recommendations" or "no commitments." 4. What might we be paying for without using? Finally, investigate cleanup candidates: "Identify potentially orphaned resources and show the evidence that makes each one a candidate for owner review." The example orphaned-resource view covers candidates such as unattached disks, stale snapshots, unassociated public IP addresses and network interfaces, and empty App Service plans. Figure 4. Example cleanup-candidate inventory. An apparent orphan is an investigation finding, not deletion approval. An unattached disk may be retained for recovery. A snapshot may be subject to a retention requirement. A network resource may be reserved for a planned deployment. The report should help the owner answer those questions by identifying the resource, its state, and any observed charges. It should not turn "not currently attached" into "safe to delete." The intended configuration is read-only reporting and investigation. Validate the identity's effective permissions and enabled tools before use; the template alone does not enforce that boundary. Any cleanup requires separate validation and explicit approval. Have a meaningful cost conversation with the agent A cost dashboard remains useful. It shows the shape of spending and gives people a shared view. However, a conversational approach takes this further by helping users investigate what is driving spending, identify key contributors, distinguish new charges from changes in existing resources, and explore cost optimization opportunities. Start with a simple cost question, then use follow-up prompts to explore what changed, which resources contributed, and what needs further investigation. Example prompts include: “Which subscriptions and resources explain the largest cost increases compared with last month?” “Why did costs increase this month?” “Which resources contributed most to the increase?” “Is this newly billed spending or higher costs from existing resources?” “Compare the last three months and show the biggest changes.” “Create a report focused on this subscription and its top cost drivers.” “Show Azure Advisor savings opportunities and orphaned resources that require owner review.” “Refresh this report every Monday morning.” With the required data access and tools configured, the agent can help rerun analyses, narrow the scope, and generate reports focused on specific cost questions. Scheduled reports and cost alerts require supported capabilities, appropriate permissions, and separate configuration. Check findings against source data before making decisions or changing resources. Try it in your environment Start with one subscription whose costs you already understand. That makes it easier to reconcile the first report before expanding the scope. Review the kit. Start with the repository overview Add the three skills from the skills folder, and upload the cost analysis playbook as a knowledge source. Configure scoped access. The kit calls for Cost Management Reader and Reader on each target subscription for cost queries and inventory enrichment. Validate any additional billing or commitment access separately. Bootstrap the report. Submit the first-run prompt from the bootstrap prompts and provide the HTML report template. Validate the result. Reconcile a completed month's totals against Cost Management using the same scope, currency, and cost basis. Check resource aggregation, labels, and missing-data states. Configure refresh only after validation. The kit includes a suggested Monday 07:00 UTC refresh prompt. Confirm scheduling support, permissions, and failure handling in your environment before relying on it. Using this workflow may incur Azure SRE Agent charges and other applicable service charges. Review Azure SRE Agent pricing and billing and the pricing for the services you configure before running a pilot. This post does not describe a free service offering. Further reading Azure SRE Agent overview Azure Cost Management overview Azure Cost Management Query API Azure Advisor cost recommendations Azure Resource Graph overview554Views1like0CommentsAnnouncing flex nodes for AKS (preview) in Azure portal
Explore how AKS flex nodes can address regional CPU and GPU capacity constraints, bring distributed compute under one control plane, and support on-premises workload placement for data residency, now with the Azure portal experience to simplify onboarding.421Views1like0Comments
How Microsoft Intune team upgraded a .NET service with GitHub Copilot modernization
Microsoft's Customer Zero blog series gives an insider view of how Microsoft builds and operates Microsoft using our trusted, enterprise-grade platform. Learn best practices from our engineering teams through real-world lessons, architectural patterns, and operational strategies for building, operating, and scaling AI-powered systems across the organization. A hosting platform transition gave our team an opportunity to modernize a Microsoft Intune enrollment service to .NET 8. I used GitHub Copilot modernization to assist with that work while retaining responsibility for design decisions and validation. Using GitHub Copilot modernization, I saved more than four weeks on the first library alone. The more durable outcome was the working method built around the agent: three working files that I kept alongside the code and owned myself, rather than leaving that state to the model, that let a months-long migration be paused, corrected and resumed without re-deriving the analysis every time. What follows is how that worked in practice, including where the agent stopped helping. The Challenge: retiring a hosting platform without carrying the framework forward My team owns a Platform as-a Service (PaaS) service that supports devices enrolling into Intune at the start of their enrollment journey. Microsoft Intune is a cloud-based endpoint management service that secures and manages an organization's devices and apps. It lets a company’s IT team manage and secure employees’ laptops, phones, tablets, apps, and company data from one central service. It supports Android, iOS/iPadOS, Linux, macOS, tvOS, visionOS, and Windows devices. This Service was running on .NET Framework 4.7.2, hosted on a non-AKS hosting platform. I moved it to Azure Kubernetes Service (AKS) hosting environment which is what started the work. The modernization combined two related but distinct changes: moving the workload to AKS and modernizing the application code to .NET. 8. The heaviest part was dependency mapping. A key part of the migration was mapping dependencies across shared libraries, namespaces, and APIs, including Intune owned and even team-owned libraries, some of which also needed modern .NET-compatible packages. The service had a substantial codebase with dependencies across multiple libraries, namespaces, and APIs. Some APIs were unchanged, some were renamed, and some had no direct replacement and required a design decision. These APIs were most often from internal Intune libraries. Without reusable mappings, those questions recur across projects and files. To maintain continuity across the migration as this was a long-term project, I kept an explicit record of decisions, completed work, and the next steps. The service spans several libraries and multiple endpoints that support about 20 plus different enrollment flows across Windows, Linux, Android, iOS, and macOS platforms. A single pull request covering the full migration was not possible, so I divided the work into increments small enough to review, test, and merge, or to isolate by enrollment flow, with a way to stop one day and pick up the next without paying the analysis cost twice. The Solution: a modernization agent with engineer-owned working content I started the side-by-side .NET framework service to .NET 8 service migration by hand, then brought in GitHub Copilot. In my early tests, I needed .NET migration-specific domain context beyond what I had established in my copilot session. The limitation was missing domain context, not an inability to generate code, and that is the gap a purpose-built tool closes. GitHub Copilot modernization is an agent built on GitHub Copilot, with Microsoft's language teams supplying domain knowledge. For .NET, its recommendations draw on current assembly and NuGet package analysis rather than relying only on patterns learned during model training. GitHub Copilot modernization is now available in Visual Studio, Visual Studio Code, GitHub Copilot CLI, GitHub Copilot app, and GitHub.com. When I did this migration, it was available only in Visual Studio and Visual Studio Code. For this migration, I chose GitHub Copilot modernization in Visual Studio through GitHub Copilot Chat in agent mode. I tested the modernization agent against work it could already check, running it over the same project and classes that I had migrated by hand and comparing the two. They were very close. That comparison, rather than anything in the tool's description, is what established enough confidence to point it at code nobody had migrated or analyzed manually yet. Once I started using the modernization agent, I realized that it was able to map .NET specific and global libraries as well as the API calls efficiently. The agent analyzed well but did not reliably retain migration state across sessions. Returning to the work could trigger a new assessment that overwrote prior artifacts. To avoid this, the more transferable part of my approach was the working context I built around the agent: a migration plan (migrationplan.md), a progress record (progress.md), and context notes. The agent generated a migrationPlan.md and progress.md at my request; I added the context from my notes from my previous sessions and manual migration and kept all three current in my local repository. The context preserved mappings I had already established by hand, so the agent could reuse settled decisions instead of researching them again. I kept them in my local repository rather than checking them in. The migrationplan.md broke the work into phases and day-sized tasks, and the progress.md file was updated after each increment. The next session could resume the recorded task instead of reassessing the codebase. When a migration increment surfaced a build issue, fixing it meant a side conversation, and the thread of the main work got lost in it. To avoid this, I started recording each failure under that day's task: what failed, what was tried, and what was ruled out. That gave the investigation somewhere to live without overwriting the main work. The current agents experience records task failures in progress-details.md. The Migrationplan.md is an editable markdown file, not opaque internal state, and I edited it when needed. Where a generated step was wrong for the service, or I wanted smaller increments of work per pull request, or to migrate a scenario before another, or to focus on one API path per pull request, or even to change the ordering, I updated the file with the correct information and the agent picked up the revision and carried on rather than reverting to its own plan. That made the editable plan especially useful when the migration approach changed. Plan granularity is also how I controlled pull request size. I used the plan to constrain each increment: for example, three model files and a view file, or one small end-to-end enrollment flow at a time, or one controller at a time, or sometimes not even a whole controller, just one API path, I made this judgement depending on the complexity of the scenario I wanted to migrate. Small increments stayed reviewable, and a broken build left a smaller surface to investigate. Supplying the build error and asking the agent to re-examine that increment produced a focused follow-up change. I began using the .NET modernize agent with an internal library, that supports Windows client calls made over Simple Object Access Protocol (SOAP). Before discovering the tool, I had already side-by-side migrated the .NET framework version of that library into another .NET8 successor library and had updated portions of the service’s windows enrollment flow. I used the mapping I had made between framework and .NET 8 libraries and APIs during this migration as a context for the tool, allowing each migration pass to reuse and add to the mappings established in previous one. The tool’s recommendations closely aligned with my manual migration approach on redo of the first library, which built my confidence in its output. I then used it for my next two internal library migrations, and the remaining Apple and Android enrollment flows in the service. The Impact: what the approach saved, and what it did not The internal library that handles Windows enrollment calls was estimated and took roughly six weeks of work but the tool completed it in one and a half weeks, a 75% schedule reduction, and on the second internal library dependency, also estimated at six weeks, I saved time again. I was able to reapply those savings to the remaining enrollment flows as I continued the service migration. The saving came from work that did not have to happen twice. Mappings settled in one phase were reused in the next rather than rediscovered. Project file conversion and NuGet package resolution, which is mechanical but voluminous, moved to the agent. What stayed with me was review, integration, the decisions, and the containerization and move to AKS itself. Without the agent, I would have needed to prioritize the migration more exclusively, which would have cut into the other project work I was delivering at the same time. Where the agent stopped helping In my experience, public libraries and Microsoft-wide libraries mapped well. Intune-internal libraries did not. In a subsequent internal prototype, I tested the agent on another service with different migration dependencies. For Intune-internal libraries, it could not identify which modern NuGet package or API replaced each dependency because those mappings were not available in its context. It still removed some of the mechanical work, but the mappings themselves stayed manual. During the prototype, I also built skills that work as a wrapper for the modernization agent that provides this internal migration context. I checked those skills into our internal repository so other Microsoft Intune engineering teams can use them internally through a plugin. What another team should take from this Validate it against work already done by hand to gain confidence. Running the agent over classes you have already migrated manually and comparing the output is cheap, and it gives you evidence for deciding whether to use the agent on code it has not yet migrated. Own the plan, not just the prompt. The agent writes its own plan and progress files to the repository. Read them and correct them, and it will follow your edits. For what it can't know, such as internal library mappings or your team's coding conventions, add a custom skill to the repository, and the agent will follow that too. Control pull request size through the plan rather than after the fact. Break pull requests into small increments. Scoping an increment to one controller, one API path, or a small end-to-end scenario keeps the change reviewable and testable, with a clear boundary for investigating migration issues. Reuse dependency mapping instead of rediscovering them. A large part of time savings come from carrying mappings established in previous phases into subsequent ones, even across libraries and services. Mechanical work like project conversion and NuGet package resolution can be handed off to the agent while you retained responsibility for integration, review and design decisions. Looking ahead The application-layer modernization is finished, while parity validation and the AKS traffic rollout continues. The reusable skills are checked into an internal repository and available to Intune engineering teams through an internal plugin, so another library or service can reuse established dependency-mapping work as well as Intune internal guidelines. I also shared the method and its measured time savings through Intune learning sessions, show and tell, Teams posts, and a newsletter. Learn more about GitHub Copilot modernization for .NET at https://dotnet.microsoft.com/platform/modernize and about Microsoft Intune at What is Microsoft Intune? - Microsoft Intune | Microsoft Learn.585Views0likes0CommentsEnhanced Feature Flags: A New Foundation for Feature Management in Azure App Configuration
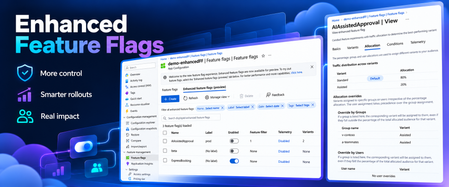
Shipping is no longer just about deploying code. Consider a team introducing a new checkout experience. The code is already in production, but the team wants to expose it to a small audience, gradually increase availability, monitor the results, and retain the ability to turn it off if something goes wrong. Feature flags make that possible without requiring another deployment. As feature flags become increasingly central to how software is released and operated, we saw an opportunity to evolve how they’re represented in Azure App Configuration. Enhanced Feature Flags are available in public preview, with a dedicated resource model designed specifically for feature management. Why rethink the feature flag resource model? Consider a team preparing to launch a new check out experience. The release manager needs to control when the feature becomes available but shouldn’t necessarily have permission to modify payment settings or other application configuration. With traditional feature flags sharing the same key-value resource and permission model as application configuration, separating these responsibilities isn’t possible. Similarly existing SDKS and tooling simplify feature flag management; the underlying APIs still treat flags as specially formatted configuration entries rather than resources with their own defined structure. These are not challenges with feature evaluation itself. They're challenges with how feature flags are represented, managed, and governed. Enhanced Feature Flags address this by introducing a purpose-built resource model, with dedicated APIs and separate access control. What changes with Enhanced Feature Flags? The new model introduces several important improvements. 1. Feature management gets its own security boundary Feature flags often change application behavior in production, and the people responsible for those changes may not be the same people responsible for application configuration. With Enhanced Feature Flags, organizations can grant access to feature flag resources independently of configuration key-values. A team responsible for feature rollout, for example, can manage flags without also receiving permission to modify unrelated application settings. This creates a clearer security boundary for applying least privilege access to feature management. 2. Feature flags get a dedicated API surface Previously, managing feature flags through configuration APIs required clients and automation to understand specific naming conventions, content types, and serialized feature definitions. Enhanced Feature Flags expose dedicated APIs for creating, querying, updating, and deleting flags. The benefit isn't simply another API. Tools and deployment workflows can now work directly with a resource designed for feature management instead of interpreting a feature flag stored as configuration. 3. Validation moves closer to the source Enhanced Feature Flags have a defined resource schema that Azure App Configuration can validate when a flag is created or updated. Malformed definitions can be rejected before they are stored, providing consistent validation across clients and tooling. Existing feature management capabilities continue to work Enhanced Feature Flags build on the feature management capabilities already available in Azure App Configuration, including targeting, variants, allocation, and telemetry. Applications can continue using their existing feature evaluation logic with supported versions of the App Configuration provider libraries. And importantly, existing key-value-based feature flags remain supported. Teams can evaluate the new model alongside their current flags, rather than treating this preview as a mandatory migration. See Enhanced Feature Flags in action Watch this short demo to learn how granular role-based access control enables teams to manage feature releases independently while keeping application configuration protected. A foundation for what comes next Enhanced Feature Flags solve concrete management and governance challenges today, but the opportunity goes further. Giving feature flags their own resource model creates room for feature management to evolve independently from general application configuration, with deeper investments in areas such as automation, governance, targeting, and connecting feature delivery to application outcomes. The longer-term opportunity is to make managing a feature throughout its lifecycle as natural as developing and deploying it. Enhanced Feature Flags are available now in public preview in Azure App Configuration. If you're building a new application or evolving your feature management workflows, explore the new resource model and let us know what you think. We want Enhanced Feature Flags to provide the foundation for the next generation of feature management in Azure App Configuration, and your feedback will help shape where we take it next. Learn about Enhanced Feature Flags Explore the Enhanced Feature Flags REST API Share feedback with the Azure App Configuration team #Azure #AzureAppConfiguration #FeatureFlags #FeatureManagement #DeveloperExperience475Views2likes0CommentsIntroducing a Guided Copilot Experience for Building Azure Apps in VS Code
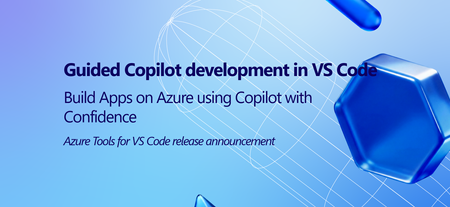
Today we're previewing a new way to build cloud apps with GitHub Copilot in VS Code: a guided Copilot experience that takes you from idea to a deployed Azure app through a structured, predictable workflow instead of a free-form chat session that may or may not land where you need it to. The problem: Copilot is powerful, but unpredictable Ask Copilot to "build me a Node.js API on Azure Functions with a Postgres database" today, and you might get a working project, or you might not. Sometimes Copilot scaffolds the app but skips infrastructure. Sometimes it generates a deployment script that fails halfway through. Sometimes it forgets what you were building three prompts later. The underlying model is capable. The problem is the shape of the experience: an open-ended chat with no checkpoints, no guardrails, and no consistent path from "I have an idea" to "it's running in Azure." How it works The guided Copilot experience adds to that open-ended flow with three clear, explicit stages: 1. Project scaffolding: Describe your app in plain language. Copilot proposes an architecture and asks for anything that is missing (e.g., language, app type, Azure services) through simple forms and pickers, not more back-and-forth chat. You review and approve the plan before any code is written. 2. Local development: Your project is scaffolded then Copilot checks for the runtimes, emulators, and tools you'll need and helps you install what's missing, so the project runs locally from the very first launch. Debug configurations are wired up automatically, so you can test and iterate on your app before it ever touches Azure. 3. Deployment: Copilot shows the tools that will be used for deployment along with a summary of all resources that will be created and a cost estimate so you can be confident in what you're getting. Infrastructure files are created for your app to ensure a consistent and reproducible deployment environment for testing and staging before going to production. Deployment runs through the same reliable tooling used across Azure (az and azd), so if something goes wrong, you get a clear explanation and a concrete next step instead of a wall of CLI output. Once your app is live, the guided experience doesn't disappear, Copilot retains context about your project's architecture, so coming back later to add a service or make a change picks up right where you left off. 🎉 What this means for how you work Determinism over guesswork. The same input reliably produces the same kind of outcome, so no more wondering which "mode" Copilot is going to be in. First try success. Projects are built to run and deploy on the first attempt, not after several rounds of manual repair. Structure over chat walls. Decisions that matter such as architecture choices, missing configuration, and deployment targets are surfaced through real UI, so you're not parsing paragraphs of text to figure out what Copilot needs from you. Stay in VS Code. The entire journey, from planning through deployment, happens without leaving your editor. What's in the initial preview The first version focuses on JavaScript and TypeScript projects, including web apps, Azure Functions, Container Apps, and Static Web Apps, with support for PostgreSQL, Azure Storage, Azure Key Vault, and Azure OpenAI. .NET and Python support are on the roadmap for a future release. Nothing about your existing Copilot workflows changes, the guided experience is an additional, opinionated path alongside the free form chat you already know, for when you want a reliable, structured way to go from zero to deployed. What's next This is an early look at a broader shift in how we think about AI-assisted development on Azure: less "ask and hope," more structured collaboration with clear checkpoints and real UI where it counts. We're continuing to expand language support, refine the deployment experience, and incorporate feedback from developers using it in the wild. Install the Azure Tools extension pack and open an empty folder to try the guided Copilot experience and let us know what you think. File issues or share feedback on the GitHub repo.1.6KViews2likes1CommentIntroducing Azure Container Apps Sandboxes: Secure Infrastructure for Agentic Workloads
Today we are announcing the public preview of Azure Container Apps Sandboxes - a new first-class resource type that gives you fast, secure, ephemeral compute environments with built-in suspend and resume. This is the underlying infrastructure on which products like Cloud sandboxes in GitHub Copilot, Foundry Hosted Agents, and Azure Container Apps Express are built, you now have the opportunity to build your solutions leveraging this infrastructure. Azure Container Apps Sandboxes unlocks two massive opportunities. For platform developers and ISVs, sandboxes give you the same isolated compute fabric that powers many Microsoft products. You get the building blocks to create your own multi-tenant platform on proven, enterprise-scale infrastructure. For AI agents, sandboxes become a self-configurable tool that lets agents extend their own capabilities on the fly. An agent can spin up a fresh sandbox in milliseconds and use it to execute untrusted code, compile source, test HTTP requests against a live app, launch a browser session, or tackle whatever needs a quick and scalable infrastructure. On one side it empowers humans to build platforms, on the other it empowers agents to build their own capabilities. Both get enterprise-grade isolation, instant startup, and snapshot-based persistence out of the box. We'll walk through the resource model, sandbox lifecycle, the features that set Sandboxes apart - like snapshots, lifecycle policies, network egress controls, volumes, and managed identities - and show you how to get started with the portal and CLI. What Are Container Apps Sandboxes? Container Apps Sandboxes are secure, isolated compute environments that start in sub-second time, scale to thousands, and cost nothing when idle. Each sandbox runs in its own hardware-isolated microVM boundary - fully separated from the host, the platform, and every other sandbox. You bring your own Open Container Initiative (OCI) image, and Sandboxes handle the rest: provisioning from prewarmed pools, strong multi-tenant isolation, and snapshot-based suspend/resume that preserves full memory and disk state across sessions. There are many ways Sandboxes can help you build your next project - here are a few: Your own build & test systems - wire a Sandbox into your CI/CD flow to run builds while your laptop stays cool. Agents that can run anything safely - an agent spawns a sandbox, executes work inside it, and returns the output with no agent host privileges required. Agent swarms - decompose a research question, spawn N sandbox workers in parallel (each pinned to its own image and egress policy), and synthesize the result. Early access customers are already unlocking significant benefits by leveraging Azure Container Apps Sandboxes. "With Azure Container Apps sandboxes, SitecoreAI can safely enable agents to take real action. The combination of multi-tenant isolation, rapid scale-out, and full automation allows Sitecore to run long-lived, autonomous agents that securely execute code, manage workflows, and interact with enterprise systems within secure, governed environments. With this foundation, we can build agents that do real work: assembling content, personalizing experiences, and optimizing campaigns in production. Agents that operate continuously, learn from results, and improve over time, so our customers get better outcomes without giving up control." - Mo Cherif, VP of AI and Innovation, Sitecore "We got early access to Azure Container Apps Sandboxes, and got the first prototype integrated with Atlas AI in hours, and it's already shaping a new Atlas AI capability that we plan to launch in preview in Q3. It gives every Atlas AI agent a safe, sandboxed workspace (file system, terminal, code execution) on a customer's live data in Cognite Data Fusion. The value: Industrial process, reliability, and production engineers spend days and weeks on questions like "which wells are underperforming and why?" These questions are tractable but expensive, so they are asked rarely and decisions are made on gut feel. With this, an agent pulls the data, runs the analysis, cross-references maintenance and inspection records, and returns a cited draft in minutes. Sandboxes make it practical: Aligned feature set, per-customer isolation, pause/resume across multi-day investigations, scale-to-zero economics." - Kelvin Sundli, Product manager, Atlas AI, Cognite Resource Model: Sandbox Groups and Sandboxes The top-level ARM resource is Microsoft.App/SandboxGroups. A Sandbox Group is the management boundary for a collection of sandboxes that share configuration - think of it like a Container Apps Environment, but purpose-built for sandboxes. When you create a Sandbox Group, you specify: Subscription, Resource Group, and Region Sandbox defaults (optional): default CPU, memory, disk, max sandbox count, and default idle timeout Networking: optionally deploy into a custom VNet with a dedicated subnet for private networking Identity: System or user assigned Entra identity. Individual sandboxes are created within a Sandbox Group. Each sandbox has its own source (disk image or snapshot), resource tier, lifecycle policy, network egress policy, environment variables, ports, volumes, and connections. Sandbox Lifecycle Sandboxes have a well-defined lifecycle with the following states: State Description Creating Provisioning the sandbox from a disk image or snapshot Running Actively executing - backed by a live microVM Idle System-suspended after inactivity; can auto-resume on the next request Suspended Full state (memory + disk) preserved as a snapshot; no compute costs Resuming Restoring from a suspended or idle state - sub-second for most workloads Stopped User-initiated stop; can be resumed Stopping Graceful shutdown in progress Deleting Teardown in progress The key insight here is the distinction between Idle and Suspended. When a sandbox goes idle (e.g., no traffic for a configured timeout), the system can automatically suspend it and capture a snapshot. When a new request arrives, the sandbox resumes transparently. This gives you scale-to-zero economics with stateful compute - something that wasn't possible before without significant custom engineering. Disk Images: Bring Your Own Container Sandboxes boot from Disk Images - Open Container Initiative (OCI) images converted into an optimized root filesystem format. You point to any OCI image (public or private registry), and the platform builds a bootable disk image from it. You can start with public, pre-built images maintained by the platform (for example, Ubuntu base images), or bring your own private images. For private registries, you can authenticate with username/token or use a user-assigned managed identity for Azure Container Registry (ACR) – integrated with Azure as you expect. Snapshots: Full-State Persistence Snapshots capture the complete state of a running sandbox - memory, disk, and all running processes. When you resume a sandbox from a snapshot, every process, open file handle, and in-memory data structure is restored exactly as it was. A snapshot captures the full state of a running sandbox: memory pages, disk, processes. Two ways to make one - automatically on suspend, or manually on demand. Three things they're great for: Checkpointing mid-task so a long-running agent can resume exactly where it left off Cloning an environment that's already warm - dependencies installed, caches populated, services running Shipping a "ready-to-go" state that resumes in sub-second instead of cold-booting Snapshots are free during the preview, after which they will be stored as Azure Blob Storage at standard rates. Each snapshot records the source sandbox, resource allocation (CPU, memory, disk), and container metadata - so what you get back is exactly what you snapshotted. Resource Tiers Every sandbox is assigned to a resource tier that determines its CPU, memory, and disk allocation: Tier CPU Memory Disk XS 0.25 vCPU 0.5 GiB 5 GiB S 0.5 vCPU 1 GiB 10 GiB M (default) 1vCPU 2 GiB 20 GiB L 2 vCPU 4 GiB 40 GiB XL 4 vCPU 8 GiB 80 GiB When creating a sandbox from a snapshot, the resource tier is inherited from the snapshot and cannot be changed - this ensures the restored environment has the exact resources it was running with when the snapshot was taken. Lifecycle Policies: Auto-Suspend and Auto-Delete Every sandbox can be configured with lifecycle policies that automate state transitions and cleanup: Auto-Suspend Idle timeout: How long a sandbox can sit idle before being suspended (configurable: 1m, 2m, 5m, 10m, 30m, 60m) Suspend mode: Disk + Memory (default): Full snapshot including memory state - resume picks up exactly where you left off, with all processes and in-memory data intact. Disk: Only the disk is preserved; the VM restarts fresh on resume. Useful when you only need file persistence, not process continuity. Auto-Delete Automatically delete sandboxes after a configurable number of days of inactivity Prevents accumulation of abandoned sandboxes that consume snapshot storage These lifecycle policies are what make Sandboxes economically viable at scale. A platform serving thousands of tenants can configure aggressive idle timeouts (say, 60 seconds) with Memory suspend mode, and each tenant's sandbox disappears from the billing meter almost immediately - but resumes in sub-second time the moment they return. Network Egress Policy For scenarios involving untrusted code - AI agents executing LLM-generated scripts, multi-tenant SaaS with user-submitted workloads - controlling outbound network access is critical. Sandboxes provide a per-sandbox Network Egress Policy: Default action: Allow or Deny all outbound traffic Host rules: Domain-pattern rules (e.g., *.github.com → Allow) to permit specific destinations Custom CIDR rules: Network-level rules for IP ranges (e.g., 10.0.0.0/8 → Deny) Skip egress proxy: Option to bypass the egress proxy entirely when custom VNet routing handles policy enforcement This means you can run a sandbox in a deny-by-default posture and allowlist only the specific endpoints it needs (your API server, a package registry, etc.) - without setting up NSGs or firewall appliances. Managed Volumes: Persistent and Shared Storage Sandboxes support two types of mountable volumes, both managed by Microsoft: Volume Type Backed By Best For Managed Azure Blob Azure Blob Storage Shared data across sandboxes, file uploads/downloads, persistent artifacts Managed Data Disk Azure Disk Storage High-performance storage for databases, build caches, large working sets - only available to one sandbox at a time Blob volumes come with a built-in file explorer in the portal - you can browse, upload, download, create folders, and drag-and-drop files directly. Data Disk volumes provide dedicated block storage with configurable sizes. Secrets and Identity Secrets Sandbox Groups support key-value secrets scoped to the group. Secrets can be created, edited, and referenced by sandboxes within the group. These secrets can be used in egress policies to modify requests with transform or header-injection rules, without exposing the secrets to code running inside the sandbox. Managed Identity Sandbox Groups support both system-assigned and user-assigned managed identities, with full RBAC role assignment management. This means your sandboxes can authenticate to Azure services (Key Vault, Storage, Cosmos DB, etc.) without managing credentials - the same identity model you use everywhere else in Azure. MCP Connectors and Triggers ACA Sandboxes now supports managed connectors through the Model Context Protocol (MCP), giving sandboxes access to external APIs - including Microsoft 365, Salesforce, ServiceNow, GitHub, and 1,400+ other systems - without managing credentials directly. Attach a Connector Gateway to your sandbox group, and every sandbox in the group can call external APIs through a standardized MCP interface at runtime. Pair connectors with triggers to build event-driven automation: route an Outlook email to a sandbox that triages it with an AI agent, or react to a SharePoint file upload by extracting and processing the document all without writing glue code. Triggers can fire a shell command inside a sandbox or invoke an HTTP endpoint the sandbox exposes, so your automation shapes fit naturally around your workload. The integration is built on the new Connector Namespace service (az connector-namespace), the same runtime behind Logic Apps and Power Platform connectors, now available as a programmable layer for sandboxes. See the end-to-end samples for runnable azd up-deployable examples covering email triage and document automation scenarios. The Portal Experience Azure Container Apps Sandboxes are only available in the new Azure Container Apps portal that provides a rich, IDE-like experience for working with sandboxes. Creating a Sandbox The portal offers multiple creation paths: Standard Sandbox - full configuration control over source, resources, lifecycle, networking, and volumes GitHub Copilot Sandbox - preset, Copilot CLI ready to go, GitHub credentials can be wired through the Access Token before the sandbox is created Claude Sandbox - Claude CLI pre-installed, ready for agentic coding inside the sandbox Using Coding Agents (Copilot CLI / Claude Code) If you live inside Copilot CLI or Claude Code, you don't need to learn a new CLI. Install the azure-sandbox skill once and your agent picks up the right skills: # GitHub Copilot CLI # Add as a plugin marketplace /plugin marketplace add microsoft/azure-container-apps # Install all skills /plugin install sandboxes@Azure-Container-Apps # Claude Code claude plugin add microsoft/azure-container-apps The skill runs prerequisite checks silently (az --version, az account show, node --version, aca --version), prompts only if something's missing, and maps natural-language asks to the right aca commands. Bundled runbooks cover Copilot CLI BYOK (bring your own Azure OpenAI key), the deploy-a-web-app walkthrough, and shell setup. Sandbox Detail Page Once your sandbox is running, the detail page gives you immediate access to the sandbox terminal and additional details, such as - Network Audit - real-time egress traffic log showing allowed and denied requests Monitor - live CPU, memory, disk, and network utilization charts Connectors - attached connections with an "Add" action Volumes - mounted volumes with an "Add" action Log Stream - streaming container logs Processes - running process list inside the sandbox Files - file explorer to browse the sandbox filesystem The toolbar actions let you manage the state of the sandbox - Resume or Stop. In the Ellipsis menu (⁝) you can find additional settings to manage network Egress Policy and ingress (Add port), take a Snapshot of the sandbox, Commit (save disk state as a new disk image), set Lifecycle Policy or permanently Delete the sandbox. Finally, you can see additional Details in a side panel. Getting Started with the CLI and Python SDK All sandbox and sandbox-group operations go through the aca CLI. There are no az containerapp sandbox commands, - az is only used for az login, az account show, and resource-group management. Install (CLI) # Mac, Linux curl -fsSL https://aka.ms/aca-cli-install | sh # Windows irm https://aka.ms/aca-cli-install-ps | iex Run aca --help to get started. Install (Python SDK) pip install azure-containerapps-sandbox For more details, quick start and examples on ACA CLI and Python SDK, please go to https://sandboxes.azure.com Evolution from Dynamic Sessions If you've used Azure Container Apps Dynamic Sessions, Sandboxes are the next evolution of that capability. Everything Sessions can do, Sandboxes can do - and significantly more: Capability Dynamic Sessions Sandboxes Sub-second startup ✓ ✓ Strong isolation ✓ ✓ Custom container images ✓ ✓ Custom VNet integration ✓ (Partial) ✓ Suspend/resume with Memory and Disk snapshots - ✓ Lifecycle policies (auto-suspend, auto-delete) - ✓ Network egress policy (per-sandbox) - ✓ Persistent managed volumes (Blob, Data Disk) - ✓ Managed identity (system + user-assigned) - ✓ Secrets management - ✓ Configurable resource tiers - ✓ Direct access to sandbox in Portal experience - ✓ We will continue to support Dynamic Sessions, but all new investment goes into Sandboxes. If you're building new workloads on isolated ephemeral compute, start with Sandboxes. How It All Fits Together ACA Sandboxes is a platform primitive. It's the foundation on which multiple Microsoft products are already built - including ACA Express, Cloud sandboxes in GitHub Copilot, and Foundry Hosted Agents. When you build on Sandboxes, you're building on the same infrastructure that powers Microsoft's own portfolio. This is the evolution of what we shared with Project Legion in 2024. Legion described the internal infrastructure; Sandboxes exposes it as a customer-facing primitive that you can use directly. What's Next • Deeper Azure integrations - first-class connectivity with Azure networking, identity, storage, and AI services • Enhanced SDK and CLI - richer programmatic experiences for managing sandboxes at scale • More Microsoft services built on Sandboxes - this is just the beginning Get Started Today • Portal: https://sandboxes.azure.com/ • Documentation: Azure Container Apps Sandboxes • Pricing: Azure Container Apps Pricing (per-second vCPU/memory billing, scale-to-zero, snapshots at Blob Storage rates) We'd love to hear your feedback. You can ask questions, or file issues on the Azure Container Apps GitHub (prefix with [Sandbox] for Sandboxes-specific issues).10KViews3likes1CommentAzure Container Apps Sandboxes, Now Generally Available
Agents Act. You Set the Limits. Your platform needs to run untrusted code. Agents choose actions at runtime, from installing packages to calling APIs. In a multi-tenant service, you have to support both without letting one customer's code reach another customer's data. That requires an execution environment you control for each tenant, session, or task. Azure Container Apps Sandboxes is that execution environment, as a service. Each sandbox is a hardware-isolated microVM with its own Linux kernel. It starts in under a second, and you decide per sandbox what it can reach, how large it is, and how long it lives. For each user, controlling which credentials their agent can use and what it can reach is key. Untrusted code must stay isolated from other workloads and the host kernel. Preserving a session state without giving up scale to zero or instant startup is important, as is visibility into what each agent did. Let's unpack these one at a time. Control What Your Agents Can Reach The first question about an agent is not what it can do, but what it can reach. Per-sandbox egress policies answer that: an external proxy evaluates every outbound request against rules you set - by host, domain pattern, or CIDR. You can start with a default 'Deny' action and allow only the endpoints the task needs, so a prompt injection or a compromised dependency has nowhere to go. Network Audit shows you what was allowed and what was denied. Approved endpoints usually need credentials, and handing an API key to an agent means the key can be logged, echoed into a response, or carried off somewhere you did not intend. Transform rules can inject authentication headers outside the sandbox. The agent sends a request with no secret in it, the proxy adds the credential outside the sandbox, and the call goes through. The agent gets access to the service without ever getting the API key. When a static allowlist cannot express the rule you need, an egress webhook hands each request to your own service before it leaves. You can build a service that reviews all outbound calls, approves some and rejects others. Good results depend on the agent reaching the right data, and the data that matters usually sits on your private network. Outbound, VNet integration places the sandbox group on a dedicated subnet, so agents can reach internal APIs, databases, and services behind private endpoints. Egress rules are still enforced: routing is chosen per rule, so a call to an internal database is filtered, transformed, and recorded in Network Audit exactly like a call to the open internet. Inbound, a Private Endpoint brings the sandbox service into your VNet, so your own applications reach into your sandboxes without crossing the public internet. Run Untrusted Code Without Sharing a Kernel Each sandbox runs in a hardware-isolated microVM with its own Linux kernel and virtual hardware, with memory separation enforced through CPU virtualization. In contrast, typical container runtimes isolate processes while sharing the host kernel. In a sandbox, code calls into its own guest kernel, so the blast radius of a kernel exploit is one sandbox. You get that boundary with ACA Sandboxes. Inside that boundary, the filesystem is yours to choose. The quickest way to start is by creating a sandbox based on a platform-provided disk image: Public image Ready for ubuntu General-purpose Linux execution and development tools nginx Running a web server copilot, claude GitHub Copilot CLI or Claude Code workflows azure-dev Azure development with CLI tools and multiple language runtimes python-3.12-code-interpreter Isolated Python execution through REST and MCP python-3.11 to python-3.14 Python workloads node-22, node-24 Node.js workloads dotnet-8 to dotnet-10 .NET workloads php-8.3, php-8.4 PHP-FPM workloads Availability and versions change over time, please check the portal's catalog for the current list. Images are provided as is. For a custom environment with your own code and dependencies, you can bring a container image from a public or private registry. The platform converts it into an optimized, bootable disk image containing your application, agent harness, runtimes, and toolchain. For a private registry, you authenticate with registry credentials or a managed identity for Azure Container Registry. You can also start from a sandbox you already have running. A disk snapshot captures the filesystem as a new disk image, while a memory snapshot captures disk and memory together, so a sandbox created from it resumes where the original left off. Installed dependencies, or a cloned repo, are set up once, and every sandbox created from the snapshot starts with them. Give Every Task Its Own Sandbox A sandbox starts in under a second, and that is why it is practical to give every task its own machine. When a machine takes minutes to come up, everything ends up sharing that same space. When it starts instantly, each task, user, or tool call runs in isolation, and gets deleted when the work is done. Thousands at a time. Sandboxes are sized when created by selecting a resource tier. These range from 0.25 vCPU with 0.5 GiB of memory and a 5 GiB disk, enough for a short script or a quick evaluation, to 4 vCPU with 8 GiB of memory and an 80 GiB disk for compilation and heavier analysis, with multiple steps in between. Programmatically you can go up to 16 vCPU with 32 GiB of memory and a 320 GiB disk for the most demanding work. Sandboxes do not have to be discarded by hand. Lifecycle policies stop a sandbox once it goes idle, capturing the disk and optionally the memory. It can resume on a start command or automatically on arriving network traffic. A policy can also auto-delete a sandbox that has been stopped long enough, so abandoned work does not linger. Keep State and Bring Your Data Most agent tasks are short - run a script, or return a result. That is not the limit. A long-running agent needs state that outlives single runs, and volumes attach persistent storage to a sandbox at a path you choose. Code reads and writes to it through ordinary filesystem calls, and the data stays after the sandbox is deleted. There are three kinds: A Data Disk mounts to one sandbox at a time and gives it a fast, fully POSIX-compatible filesystem on local disk, which suits a working database, a build cache, or an agent's accumulated memory. An Azure Blob volume mounts to many sandboxes at once, for sharing a large read-heavy dataset rather than supporting concurrent writers. Azure Blob BYO volume (bring your own) does the same for blob storage you already own, referenced by resource ID. See What Your Sandboxes Are Doing Observability is how you know what a fleet of short-lived sandboxes did. Telemetry is opt-in and configured per sandbox when you create it, and it streams out while the sandbox runs, so you can go back to a run that finished hours ago. A sandbox emits four categories of data, and you choose which of them to collect: Category What it carries Console logs The stdout and stderr streams from each sandbox Sandbox metrics (platform) Platform-managed CPU usage, memory consumption, and network I/O per sandbox, sampled on an interval you set OpenTelemetry Signals emitted by your own application; the sandbox injects the OTLP endpoint, so an SDK you already use exports with no extra configuration Network egress decisions One record per outbound request, with the allow or deny decision the egress policy made Each category is then pointed at a destination: any OTLP-compatible collector, Log Analytics through the Logs Ingestion API, or Application Insights. They mix freely, so console logs can go to your collector while egress decisions go to Log Analytics. The credential that writes to the destination never enters the sandbox. OTLP resolves their from a sandbox-group secret, Log Analytics authenticates with a managed identity on the group. Separate from what a sandbox exports, the platform publishes cores and memory to Azure Monitor on the sandbox group, and that is what the portal shows for a Sandbox group. Sandbox group totals come by default, and you can opt-in for per sandbox details if you need that level of granularity. Use It From Code, a Shell, or a Browser Every one of these operations is available from code, a shell, a template, or a browser, so the choice comes down to what you are doing at the time. When the sandbox is part of your application, use an SDK. Today available for Python and TypeScript, with .NET on the way. An app or service you build creates sandboxes, writes and reads files, runs commands, mounts volumes, and captures snapshots as native objects in the language you use. When the work is scripted, the ACA CLI covers the same surface from Bash or PowerShell: aca sandbox create --disk ubuntu or aca sandbox snapshot. Commands accept label selectors, so automation and CI act on -l name=build-agent instead of tracking generated IDs. When the group itself is managed in source control, define it as infrastructure as code. Microsoft.App/sandboxGroups is a first-class ARM resource, so a Bicep template attaches a managed identity, links a delegated VNet subnet, and assigns data-plane roles. An ACA Terraform provider (Preview) covers the same group-level controls for teams standardized on Terraform. Sandboxes portal Designing a new resource type from scratch let us rethink the portal experience along with it. The creation flow asks the minimal set of questions - a disk image and resource tier - and you have a running sandbox. The Advanced section allows you to go deeper to ports, volumes, lifecycle policies, egress policies, logging and more. All there when you need it. What you see afterward is tailored the same way. A sandbox group gives you the overview of all sandboxes in that group: how many exist and how many are running, cores and memory in use over time. The most recent sandboxes with their state and size, and the disk images and snapshots the group can build from. A single sandbox gives you the machine: a terminal, live CPU, memory, storage, and network, a log stream, running processes, the files on disk, mounted volumes, and the egress traffic it generated with each request marked allowed or denied. You get that same experience wherever you start. Reach sandboxes from the Azure portal, alongside the rest of your resources and under the same subscriptions, RBAC, and policies, or go straight to the standalone ACA Sandboxes portal. It is the same experience either way, so there is nothing to relearn and nothing you can only do in one of them. How Much Does It Cost? Three types of charges: vCPU, per core-second while the sandbox runs. Memory, per GiB-second while the sandbox runs. Storage, per GiB stored, for as long as you keep it. The resource tier of the sandbox determines the amount of vCPU and GiB of memory. These rates are on the Container Apps pricing page. Storage is charged (coming soon) at Premium Azure Blob ZRS rates and covers: Custom Disk Images, including Disk Snapshots. The platform converts your OCI container image into a bootable disk image. You pay to store one copy of that image for as long as you keep it, regardless of how many sandboxes boot from it. The OS disk each of those sandboxes runs on is not billed. Snapshots are the combined memory and disk snapshots of your sandboxes, including those taken automatically when a sandbox stops. Optional Data Disk Volumes and Azure Blob Volumes that can be attached to sandboxes. Thank You and What Comes Next General availability is not the destination, it is where many more of you get to start. During public preview that we announced in June 2026, the usage surpassed quickly a million sandboxes created every day. Our team worked closely with early customers that provided valuable feedback that shaped the product as it's today. From teams running real workloads on sandboxes ranging from cloud-native SaaS companies like Templafy to global organizations like KPMG and Cognite. KPMG built their Cowork AI Agent for their global workforce on ACA Sandboxes. Cognite uses ACA Sandboxes in their industrial Atlas AI system. Lastly, the Department for Education, South Australia - uses ACA sandboxes to power their EdChat - A safe place for every learner. We run the EdChat so students can learn by writing code and exploring data alongside AI, across 60,000 students and more than 40,000 staff. That model only works if every student gets an environment of their own, with clear guardrails, and can come back later to find their work exactly as they left it. Building that in house meant owning the machinery behind it. We estimate that moving to Azure Container Apps Sandboxes lets us retire close to 50,000 lines of code written to manage custom code interpreter and state ourselves. It is the per-user execution model that scales for our school system, and a lower maintenance burden for us. Cody Little, AI Technical Lead, Department for Education, South Australia In addition, many internal customers at Microsoft adopted ACA Sandboxes to build and enhance their products for their customers. Among those Microsoft Foundry built hosted agents, Copilot Studio hosts agents you create - both on ACA Sandboxes and – our very own Azure Container Apps Express built a modern and fast serverless container platform on sandboxes. Their feedback and your feedback set the next priorities, and we are grateful to you for it. Three focus areas of work that follow: Sandbox groups get more control and visibility, so a platform team can observe sandboxes, audit and enforce policies at the sandbox group level. Broad extensibility with more SDKs and tighter integration with VS Code. Lastly, extensive interoperability with Connectors and Triggers (now in preview) that will provide even larger customizability and on-behalf-of authentication (OBO), so agents securely reach the systems needed to do their job. Next Steps Open the ACA Sandboxes portal and create a group with a sandbox. Clone the samples repo and start with the working code. Read the documentation for the quick starts and the reference behind everything above. We appreciate your feedback, please submit it in the ACA Sandboxes portal, or open an issue in the Azure Container Apps repo Issues · microsoft/azure-container-apps.3.2KViews3likes0CommentsBring Azure SRE Agent into your developer workflow with the new canvas
You’re on call. A customer-reported incident lands, Azure SRE Agent picks it up from your incident management system, investigates, and gives you a starting diagnosis. If you’re like me, you want to check that diagnosis yourself, and you want to do it where you already work: in GitHub Copilot, with your code, your tools, and your own access to the data. The new Azure SRE Agent canvas puts the investigation right next to your Copilot chat. A canvas is an interactive panel beside the conversation, with context and actions you and Copilot can both use. You get SRE Agent’s findings plus everything SRE doesn’t have: your code, your private data sources, and what you know about the app. In the GitHub Copilot App, sessions are on the left, Copilot chat is in the middle, and the SRE canvas is on the right. You can use the same canvas in Copilot CLI sessions that support canvases. I now have SRE's findings alongside my own context in Copilot chat. I can keep digging here and decide what to send back to SRE, and when. Let me show you the inner loop with an incident from September 22. It’s a Contoso demo, but it’s modeled on a real one we hit in production. Gateway health looked available while orders and payments failed. I'll use SRE's diagnosis as a starting point, check the historical telemetry with my own authorized access, and work out what the evidence does and doesn't establish. I’ll share findings with the team, and anything worth keeping goes back to SRE Agent. Start with the incident With the plugin enabled, I prompt Copilot to open Azure SRE Agent and choose my saved demo1-dt-snow favorite. I can also discover agents in a subscription I choose or connect through a caller-authorized external URL. For this investigation, I open INC0922001, "Trading order and payment requests failing while gateway health remains available," and choose Connect this thread. Selecting a row lets me browse; connecting makes it the investigation for this conversation. The September incident as recorded in SRE Agent. Then I ask: Summarize this connected September 22 investigation. Separate the reported diagnosis from observed evidence. Give the incident time window, and list what still needs independent verification. The SRE record reports a stopped PostgreSQL database. It says the gateway passed its health check, but Orders and payments requests failed after about 15 seconds. That's useful context, but a passing health check doesn't mean orders and payments are working. I want to check the logs for myself. SRE’s diagnosis and suggested recovery. Suggested isn’t the same as confirmed, which is where I start digging. Get the historical window right The first query assumption I check is the date. This incident needs September 22, 17:30 to 19:45 UTC, not the last 24 hours. I use the Log Analytics workspace behind the demo and ask: Reconstruct the failure check for this historical window. Show the complete query and target before running it. Then break down the request routes and status codes. The reconstructed query and its saved result give me something concrete to inspect. This is my own reconstruction, not a replay of SRE’s query, so the counts differ a little from SRE’s snapshot. The query runbook includes the complete KQL, working Log Analytics API route, and scope for review. The result contains 120 gateway Orders 500 records, 115 gateway payments 502 records, corresponding backend failures, and 119 database connection timeouts. These are telemetry records, not distinct customer requests: the gateway and backend can record the same call. Exporter authentication errors and later route 404s are separate signatures, not more examples of the same database failure. Inspect the requests, dependencies, and exceptions Grouped counts tell me where to look. To understand the failure, I want to look at some of the actual log entries from that time window, not just the totals: Show the Orders requests, downstream dependencies, and database timeouts for this window. Where operation IDs are populated, follow the same operation. Tell me what is correlated and what is only nearby in time. The saved exception signature says the connection to the database endpoint timed out. That supports a connectivity problem; it doesn't independently prove the database was stopped. To connect a particular exception to a particular request, I need matching trace identifiers, not just nearby timestamps. The raw-record and correlation queries are the next checks, with their own execution approval. Widen my check beyond Orders An Orders-focused query is a useful starting point, not an impact assessment. I ask: Keep the same source and time window, but remove the Orders operation and dependency-target restrictions. What else has 5xx failures or the same database-connectivity signature? Keep unrelated errors separate. The saved broader result already includes payments, which SRE also identified. My goal is to verify that scope independently and see whether the wider query adds anything. I won't turn two affected paths into an all-services outage. This data also has blank application-role names, so I use the recorded operations and dependency targets rather than invent an application-name filter. Test the competing explanation A gateway deployment or connection setting could also cause trouble. I want to compare that explanation with the database diagnosis: Preview the historical deployment and configuration records needed for this window, plus independent database state or availability evidence. Do not use today's settings or health as proof of September 22. If the records aren't available, leave the check open. The first SRE record reports the database as stopped, but its Activity Log check found no stop event and may not have covered the right scope. Independent incident-window records would help distinguish stopped state from configuration or network problems. Current settings can't establish historical state, and missing or expired change history can't rule out a deployment. For now, the logs support connectivity trouble. Historical database state and the competing configuration explanation still need checking. The first record also doesn't confirm completed recovery; a later recurrence doesn’t tell us what happened on September 22.. Bring in evidence SRE may not have, or go where it cannot The logs got me to a connectivity problem. The next question is capacity: was something starved? That evidence lives in a Kusto cluster SRE Agent can’t reach, but I can. Private Connectors let me use my own authorized access from inside the same investigation. Copilot-private connections are separate from the SRE Agent connectors. Teams is ready for the update. For a performance or capacity question, I can choose an authorized connection, review the source and complete query, and approve its time range and filters before execution. Then I can compare the relevant measurements and units. This is an extension of the investigation. Granting capacity is a separate action with its own approval. I can do it from here, but it’s my call, not the agent’s. The connection stays private to Copilot. Connecting an SRE investigation doesn't give the agent my datasource permissions. If I want SRE to use a finding, I separately preview and approve the evidence to share. For checks I run locally, I use my identity and network access; a cloud-backed connector uses its provider's network path. Review the updated team message The team update should carry the refined root-cause analysis, including its limits: SRE's reported diagnosis, the independently observed failures, the scope, and the checks still open. Next prompt: Draft a September 22 update to send to the team in Teams. Include the reported diagnosis, observed Orders and payments failures, connectivity evidence, competing explanations, and remaining checks. Include the investigation link. Show me the exact message and destination before sending. That gives the team a useful starting point for the next check, with a link back to the investigation. Continue in the terminal I can carry the same investigation into a canvas-capable Copilot CLI session. I connect INC0922001 explicitly in that conversation; the App's connection doesn't carry over. Connect to INC0922001 from September 22. Give me a TL;DR that separates the reported diagnosis, independently checked evidence, and remaining questions. The terminal is another place where I like to work, and I still want to follow the same evidence and use my own context and tools. The SRE canvas provides tools to Copilot CLI too. The IDE and terminal guide covers a separate connection through the Azure MCP Server. So who stopped the database? We did, for the demo. The real production incident that inspired this was resource exhaustion, which is less satisfying, because every engineer wants it to be the database. It’s better when you can prove it. Try the canvas for your next investigation The useful loop isn't just reading an incident summary from an agent. It's taking SRE's starting diagnosis into Copilot, inspecting the evidence, testing alternatives, and bringing in authorized data from my own tools. Sometimes that confirms SRE Agent got it right. Sometimes it doesn’t. Either way, what I learn goes back into the agent’s memory so the next incident starts smarter. In this one, I learned we’re not resilient enough to this kind of failure yet, and we have hardening work to do. Install from Customize > Plugins > Awesome Copilot > Azure SRE Agent, start a new session, and ask: Open Azure SRE Agent canvas. Watch the demo video, bring an existing investigation, and tell us what you think. The canvas guide has setup details. Also see the October SRE Agent update and explore the other Azure canvases.1.7KViews1like2Comments