microsoft sentinel
73 Topics
Defender streaming setup and integration with private event hub
Hey team, Do we know Defeneder supports private endpoint only event hubs to ingest data - I think only public is supported Configure Azure Event Hubs for Microsoft Defender XDR event ingestion - Microsoft Defender XDR | Microsoft Learn Could anyone please clarify?251Views0likes1Comment
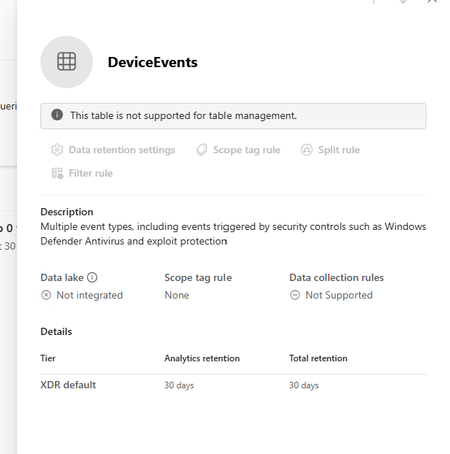
Defender XDR: Tables not supported for table management
I am trying to extend the table retention of specific tables to allow them to flow to Sentinel Analytics but keep getting the message "This table is not supported for table management" in the Sentinel > Configuration > Tables page. The Sentinel workspace is connected in System > Settings > Microsoft Sentinel. I can see the table type is XDR in the list which seems to be the reason why it can't be managed. Any ideas why this table is not able to be managed.521Views0likes1CommentIntegrating Proofpoint and Mimecast Email Security with Microsoft Sentinel
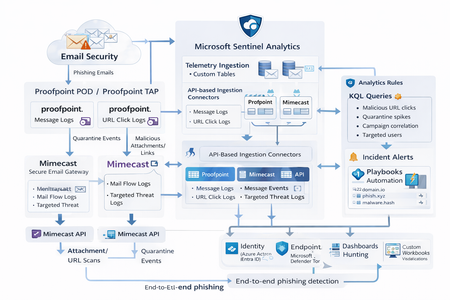
Microsoft Sentinel can ingest rich email security telemetry from Proofpoint and Mimecast to power advanced phishing detection. The Proofpoint On Demand (POD) Email Security and Proofpoint Targeted Attack Protection (TAP) connectors pull threat logs (quarantines, spam, phishing attempts) and user click data into Sentinel. Similarly, the Mimecast Secure Email Gateway connector ingests detailed mail flow and targeted-threat logs (attachment/URL scans, impersonation events). These integrations use Azure-hosted ingestion (via Logic Apps or Azure Functions) and the new Codeless Connector framework to call vendor APIs on a schedule. The result is a consolidated dataset in Sentinel’s Log Analytics, enabling correlated alerting and hunting across email, identity, and endpoint signals. Figure: Phishing emails are processed by Mimecast’s gateway and Proofpoint POD/TAP services. Security logs (delivery/quarantine events, malicious attachments/links, user clicks) flow into Microsoft Sentinel. In Sentinel, these mail signals are correlated with identity (Azure AD), endpoint (Defender) and network telemetry for end-to-end phishing detection. Proofpoint POD (Email Protection) Connector The Proofpoint POD connector ingests core email protection logs. It creates two tables, ProofpointPODMailLog_CL and ProofpointPODMessage_CL. These logs include per-message metadata (senders, recipients, subject, message size, timestamps), threat scores (spamScore, phishScore, malwareScore, impostorScore), and attachment details (number of attachments, names, hash values and sandbox verdicts). Quarantine actions are recorded (quarantine folder/rule) and malicious indicators (URL or file hash) and campaign IDs are tagged in the threatsInfoMap field. For example, each ProofpointPODMessage_CL record may carry a sender_s (sender email domain hashed), recipient list, subject, and any detected threat type (Phish/Malware/Spam/Impostor) with associated threat hash or URL. Deployment: Proofpoint POD uses Sentinel’s codeless connector (an Azure Function behind the scenes). You must provide Proofpoint API credentials (Cluster ID and API token) in the connector UI. The connector periodically calls the Proofpoint SIEM API to fetch new log events (typically in 1–2 hour batches). The data lands in the above tables. (Older custom logic-app approaches similarly parse JSON output from the /v2/siem/messages endpoints.) Proofpoint TAP (Targeted Attack Protection) Connector Proofpoint TAP provides user-click and message-delivery events. Its connector creates four tables: ProofPointTAPMessagesDeliveredV2_CL, ProofPointTAPMessagesBlockedV2_CL, ProofPointTAPClicksPermittedV2_CL, and ProofPointTAPClicksBlockedV2_CL. The message tables report emails with detected threats (URL or attachment defense) that were delivered or blocked by TAP. They include the same fields as POD (message GUID, sender, recipients, subject, threat campaign ID, scores, attachments info). The click tables log when users click on URLs: each record has the URL, click timestamp (clickTime), the user’s IP (clickIP), user-agent, the message GUID, and the threat ID/category. These fields allow you to see who clicked which malicious link and when. As the connector description notes, these logs give “visibility into Message and Click events in Microsoft Sentinel” for hunting. Deployment: The TAP connector also uses the codeless framework. You supply a TAP API service principal and secret (proofpoint SIEM API credentials) in the Sentinel content connector. The function app calls TAP’s /v2/siem/clicks/blocked, /permitted, /messages/blocked, and /delivered endpoints. The Proofpoint SIEM API limits queries to 1-hour windows and 7-day history, with no paging (all events in the interval are returned). (A Logic App approach could also be used, as shown in the Tech Community blog: one HTTP GET per event type and a JSON Parse before sending to Log Analytics.) Mimecast Secure Email Gateway Connector The Mimecast connector ingests the Secure Email Gateway (SEG) logs and targeted-threat (TTP) logs. Inbound, outbound and internal mail events from the Mimecast MTA (receipt, processing, delivery stages) are pulled via the API. Typical fields include the unique message ID (aCode), sender, recipient, subject, attachment count/names, and the policy actions or holds (e.g. spam quarantine). For example, the Mimecast “Process” log shows AttCnt, AttNames, and if the message was held (Hld) for review. Delivery logs include the success/failure and TLS details. In addition, Mimecast TTP logs are collected: URL Protect logs (when a user clicks a blocked URL) include the clicked URL (url), category (urlCategory), sender/recipient, and block reason. Impersonation Protect logs capture spoofing detections (e.g. if an internal name is impersonated), with fields like Sender, Recipient, Definition and Action (hold/quarantine). Attachment Protect logs record malicious file detections (filename, hash, threat type). Deployment: Like Proofpoint, Mimecast’s connector uses Azure Functions via the Sentinel content hub. You install the Mimecast solution, open the connector page, then enter Azure app credentials and Mimecast API keys (API Application ID/Key and Access/Secret for the service account). As shown in the deployment guide, you must provide the Azure Subscription, Resource Group, Log Analytics Workspace and the Azure Client (App) ID, Tenant ID and Object ID of the admin performing the setup. On the Mimecast side, you supply the API Base URL (regional), App ID/Secret and user Access/Secret. The connector creates a Function App that polls Mimecast’s SIEM APIs on a cron schedule (default every 30 minutes). You can optionally specify a start date for backfilling up to 7 days of logs. The default tables are MimecastSIEM_CL (for email flow logs) and MimecastDLP_CL (for DLP/TTP events), though custom names can be set. Ingestion Considerations Data Latency: All these connectors are pull-based and typically run on a schedule (often 30–60 minutes). For example, the Proofpoint POD docs note hourly log increments, and Mimecast logs are aggregated every 30 minutes. Expect a delay of up to an hour or more from event occurrence to Sentinel ingestion. Schema Nuances: The APIs often return nested arrays and optional fields. For instance, the Proofpoint blog warns that some JSON fields can be null or vary in type, so the parse schema should account for all possibilities. Similarly, Mimecast logs come in pipe-delimited or JSON format, with values sometimes empty (e.g. no attachments). In KQL, use tostring() or parse_json() on the raw _CL columns, and mv-expand on any multivalue fields (like message parts or threat lists). Table Names: Use the connector’s tables as listed. For Proofpoint: ProofpointPODMailLog_CL and ProofpointPODMessage_CL; for TAP: ProofPointTAPMessagesDeliveredV2_CL, ProofPointTAPMessagesBlockedV2_CL, ProofPointTAPClicksPermittedV2_CL, ProofPointTAPClicksBlockedV2_CL. For Mimecast SEG/TTP: MimecastSIEM_CL (seg logs) and MimecastDLP_CL (TTP logs). API Behavior: The Proofpoint TAP API has no paging. Be aware of timezones (Proofpoint uses UTC) and use the Sentinal ingestion TimeGenerated or event timestamp fields for binning. Detection Engineering and Correlation To detect phishing effectively, we correlate these email logs with identity, endpoint and intel data: Identity (Azure AD): Mail logs contain recipient addresses and (hashed) sender user parts. A common tactic is to correlate SMTP recipients or sender domains with Azure AD user records. For example, join TAP clicks by recipient to the user’s UPN. The Proofpoint logs also include the clicker’s IP (clickIP); we can match that to Azure AD sign-in logs or VPN logs to find which device/location clicked a malicious link. Likewise, anomalous Azure AD sign-ins (impossible travel, MFA failure) after a suspicious email can strengthen the case. Endpoints (Defender): Once a user clicks a bad link or opens a malicious attachment (captured in TAP or Mimecast logs), watch for follow-on behaviors. For instance, use Sentinel’s DeviceSecurityEvents or DeviceProcessEvents to see if that user’s machine launched unusual processes. The threatID or URL hash from email events can be looked up in Defender’s file data. Correlate by username (if available) or IP: if the email log shows a link click from IP X, see if any endpoint alerts or logon events occurred from X around the same time. As the Mimecast integration touts, this enables “correlation across Mimecast events, cloud, endpoint, and network data”. Threat Intelligence: Use Sentinel’s ThreatIntelligenceIndicator tables or Microsoft’s TI feeds to tag known bad URLs/domains in the email logs. For example, join ProofPointTAPClicksBlockedV2_CL on the clicked url against ThreatIntelligenceIndicator (type=URL) to automatically flag hits. Proofpoint’s logs already classify threats (malware/phish) and provide a threatID; one can enrich that with external intel (e.g. check if the hash appears in TI feeds). Mimecast’s URL logs include a urlCategory field, which can be mapped to known malicious categories. Automated playbooks can also pull Intel: e.g. use Sentinel’s TI REST API or Azure Sentinel watchlists containing phishing domains to annotate events. In summary, a robust detection strategy might look like: (1) Identify malicious email events (high phish scores, quarantines, URL clicks). (2) Correlate these events by user with Azure AD logs (did the user log in from a new IP after a phish click?). (3) Correlate with endpoint alerts (Defender found malware on that device). (4) Augment with threat intelligence lookups on URLs and attachments from the email logs. By linking the Proofpoint/Mimecast signals to identity and endpoint events, one can detect the full attack chain from email compromise to endpoint breach. KQL Query Here are representative Kusto queries for common phishing scenarios (adapt table/field names as needed): Malicious URL Click Detection: Identify users who clicked known-malicious URLs. For example, join TAP click logs to TI indicators:This flags any permitted click where the URL matches a known threat indicator. Alternatively, aggregate by domain: let TI = ThreatIntelligenceIndicator | where Active == true and _EntityType == "URL"; ProofPointTAPClicksPermittedV2_CL | where url_s != "" | project ClickTime=TimeGenerated, Recipient=recipient_s, URL=url_s, SenderIP=senderIP_s | join kind=inner TI on $left.URL == TI._Value | project ClickTime, Recipient, URL, Description=TI.Description This flags any permitted click where the URL matches a known threat indicator. Alternatively, aggregate by domain: ProofPointTAPClicksPermittedV2_CL | extend clickedDomain = extract(@"https?://([^/]+)", 1, url_s) | summarize ClickCount=count() by clickedDomain | where clickedDomain has "maliciousdomain.com" or clickedDomain has "phish.example.com" Quarantine Spike (Burst) Detection: Detect sudden spikes in quarantined messages. For example, using POD mail log:This finds hours with an unusually high number of held (quarantined) emails, which may indicate a phishing campaign. You could similarly use ProofPointTAPMessagesBlockedV2_CL. ProofpointPODMailLog_CL | where action_s == "Held" | summarize HeldCount=count() by bin(TimeGenerated, 1h) | order by TimeGenerated desc | where HeldCount > 100 Targeted User Phishing: Find if a specific user received multiple malicious emails. E.g., for user email address removed for privacy reasons:This lists recent phish attempts targeting Username. You might also join with TAP click logs to see if she clicked anything. ProofpointPODMessage_CL | where recipient has "email address removed for privacy reasons" | where array_length(threatsInfoMap) > 0 and threatsInfoMap_classification_s == "Phish" | project TimeGenerated, sender_s, subject_s, threat=threatsInfoMap_threat_s Campaign-Level Analysis: Group emails by Proofpoint campaign ID to see scope of each campaign:This shows each campaign ID with how many unique recipients were hit and one example subject. Combining TAP and POD tables on GUID_s or QID_s can further link click events back to the originating message/campaign. ProofpointPODMessage_CL | mv-expand threatsInfoMap | summarize Recipients=make_set(recipient), Count=dcount(recipient) by CampaignID=threatsInfoMap_campaignId_s | project CampaignID, RecipientCount=Count, Recipients, SampleSubject=any(subject_s) Each query can be refined (for instance, filtering only within a recent time window) and embedded in Sentinel Analytics rules or hunting. The key is using the connectors’ fields – URLs, sender/recipient addresses, campaign IDs – to pivot between email data and other security signals.2.2KViews8likes1Comment
Looking for a simple deployment guide
MS Learn is a great starting point, but it just doesn't seem to cover the steps needed to get up and running safely. I have concerns about adding or setting something that suddenly creates a vulnerability or exposure. Where is the installation guide that installs and configures the solution then tells you, "You are now protected". Do I really want to set my own policies? Why aren't the default set of rules good enough, safe enough. I can't have a solution that is so complicated I need to hire a team to manage it 24 hours a day. I am okay investigating an alert and helping a user solve a pop-up question. Why is every major corporation around the world required to re-invent the same or similar policies the company next door is creating to make this tool work? I want to onboard all of our Intune devices and monitor anything that CAN'T be stopped by default security measures. Just the fact that Sentinel appears to be changing as an embedded tool within Defender gives me hope that this will be getting closer to a more manageable tool. But that still seems a way off. I am ready to do the reading and research to get this set up but I am hoping for a guide that is specific enough to achieve a final result. Thank for understanding my challenges here.505Views1like2CommentsPending Approval/Provisioning for Microsoft Defender XDR Lab/Trial Environment
Hello Microsoft Community Team, On June 26, 2026, our organization applied for a Microsoft 365 Developer Environment / Free Trial to support evaluation of the Microsoft Defender XDR Lab environment. To date, the environment has not been provisioned, and we have not received any status updates or confirmation. Impact: Current Status: We are currently utilizing our production environment to test project capabilities, which poses risks and limitations. Future Intent: Our organization plans to transition to a full, paid Business/Enterprise purchase immediately upon proving the platform’s benefits. Urgency: This delay is stalling our evaluation phase. We urgently need this environment onboarded and activated so we can proceed with deployment tests and subsequent procurement. Request: Please review the status of our registration and expedite the onboarding/provisioning of this developer environment. Thank you for your prompt assistance.455Views0likes1CommentMicrosoft 365 Developer E5 license lacking endpoints and device on defender portal
Dear Support Team, I am a microsoft certified trainer (MCT). I currently have a Microsoft 365 Developer E5 license assigned to my tenant. However, I have noticed that my Microsoft Defender portal (security.microsoft.com) is missing several critical features. For example, I cannot see the Endpoints or Devices menus, which is preventing me from implementing and testing Microsoft Defender for Endpoint. Additionally, my Azure tenant and Microsoft 365 tenant are separate. This has created challenges when configuring security services such as Microsoft Sentinel (SIEM), as certain prerequisites and integrations require configuration through the Microsoft Defender portal. Due to the missing Defender features, I am unable to complete the necessary setup. I would appreciate your assistance in understanding: Why the Endpoints and Devices sections are unavailable in my Defender portal despite having a Microsoft 365 Developer E5 license. Whether additional licensing, onboarding steps, or tenant configurations are required to enable Microsoft Defender for Endpoint features. How best to integrate or align my separate Azure and Microsoft 365 tenants to support services such as Microsoft Sentinel and Defender XDR. These issues are significantly impacting my ability to evaluate and implement Microsoft's security solutions. I would appreciate any guidance or recommendations to resolve them. Thank you for your assistance. Kind regards, [Your Name]437Views1like3CommentsCampaign-Centric Hunting with Microsoft Defender XDR and Microsoft Sentinel
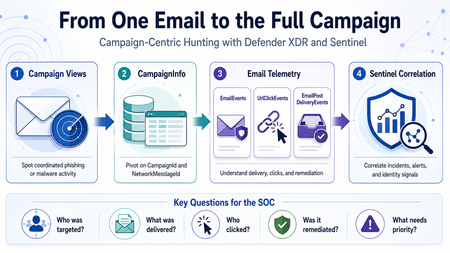
Phishing investigations usually start with one suspicious email. A user reports a message. An alert is generated. An analyst opens the email details, checks the sender, reviews the URL, and tries to understand whether the message is malicious. That is a normal starting point. However, in a real SOC investigation, one email is rarely the full story. Attackers usually operate in campaigns. They reuse sender infrastructure, similar subjects, URLs, payloads, templates, and delivery techniques. A single email may be only one part of a wider phishing or malware campaign targeting multiple users. This is why campaign-centric hunting is important. I wrote this article from the perspective of a SOC analyst who often needs to move quickly from a single suspicious email to the full campaign impact. The goal is simple: use Microsoft Defender XDR and Microsoft Sentinel together to understand who was targeted, what was delivered, who clicked, and what should be prioritized first. Why Campaign-Centric Hunting When investigating a phishing or malware email, analysts usually need to answer practical questions: How many users received messages from the same campaign? Were the messages blocked, junked, delivered, or remediated? Did any user click the URL? Did anyone click through a Safe Links warning? Were any priority or high-risk users affected? Was the email removed after delivery? Are there related Defender XDR or Sentinel incidents? If we only investigate one message, we may miss the bigger picture. Campaign-centric hunting helps the SOC move from this question: Is this email malicious? To this question: What is the full impact of this campaign? That shift is important because the response priority should be based on campaign impact, not only on a single alert. What Campaign Views Provides Campaign Views in Microsoft Defender for Office 365 help analysts investigate coordinated email attacks such as phishing and malware campaigns. From Campaign Views, analysts can review campaign-level information such as: Campaign name Campaign type Campaign subtype Targeted users Inboxed messages Clicked users Visited links Sender domains Sender IPs Payload URLs Delivery actions Campaign timeline Campaign flow This is useful during triage because it quickly shows whether an email is part of a wider attack. For example, one reported phishing message may look small at first. But if Campaign Views shows that the same campaign targeted 50 users, delivered messages to 15 inboxes, and had 2 users click the URL, the investigation becomes much more urgent. Where CampaignInfo Fits The CampaignInfo table gives analysts a KQL-based way to query campaign-related data. Some useful fields are: Field Purpose CampaignId Unique identifier for the campaign CampaignName Name of the campaign CampaignType Campaign category, such as Phish or Malware CampaignSubtype Additional context, such as brand being phished or malware family NetworkMessageId Unique identifier for the email message RecipientEmailAddress Recipient affected by the campaign Timestamp Time when the event was recorded For correlation, the most important field is usually: NetworkMessageId This field can help connect campaign data with other Defender XDR email tables, including: EmailEvents UrlClickEvents EmailPostDeliveryEvents EmailAttachmentInfo EmailUrlInfo This makes CampaignInfo a useful pivot table for campaign-level hunting. Important note: CampaignInfo is currently documented as Preview. Before using these queries in production analytics rules, validate the table availability, schema, and results in your own tenant. Practical Scenario An analyst receives a phishing alert in Microsoft Defender XDR. The alert is related to a user who received a suspicious email with a credential-harvesting URL. The analyst opens Campaign Views and sees that the message belongs to a wider phishing campaign. At that point, the investigation should not stop with the original user. The analyst should now ask: Who else received this campaign? How many messages were delivered? Which users clicked? Did any users click through the Safe Links warning? Were the messages removed after delivery? Are there related incidents in Microsoft Sentinel? The investigation flow could look like this: Start from Campaign Views in Microsoft Defender XDR. Identify the campaign details. Use CampaignInfo to list affected users and messages. Join with EmailEvents to validate delivery status. Join with UrlClickEvents to identify user interaction. Join with EmailPostDeliveryEvents to confirm remediation. Review related Microsoft XDR incidents in Microsoft Sentinel. Prioritize response based on campaign impact. Query 1: List Recent Campaigns The first query gives a simple overview of recent campaigns. CampaignInfo | where Timestamp > ago(14d) | summarize FirstSeen = min(Timestamp), LastSeen = max(Timestamp), AffectedUsers = dcount(RecipientEmailAddress), Messages = dcount(NetworkMessageId) by CampaignId, CampaignName, CampaignType, CampaignSubtype | order by LastSeen desc This helps analysts quickly identify campaigns that affected the organization during the selected period. Useful questions to ask from this output: Which campaigns are most recent? Which campaigns affected the most users? Are the campaigns phishing, malware, or spam? Is there a specific brand or malware family in the subtype? Are similar campaigns appearing repeatedly? Query 2: Understand Delivery Impact After identifying campaigns, the next step is to understand delivery impact. A campaign that was fully blocked is different from a campaign that reached user inboxes. let Campaigns = CampaignInfo | where Timestamp > ago(14d) | project CampaignId, CampaignName, CampaignType, CampaignSubtype, NetworkMessageId, RecipientEmailAddress; Campaigns | join kind=leftouter ( EmailEvents | where Timestamp > ago(14d) | project NetworkMessageId, RecipientEmailAddress, Subject, SenderFromAddress, SenderFromDomain, SenderIPv4, DeliveryAction, DeliveryLocation, ThreatTypes, DetectionMethods, Timestamp ) on NetworkMessageId, RecipientEmailAddress | summarize Messages = dcount(NetworkMessageId), AffectedUsers = dcount(RecipientEmailAddress), Subjects = make_set(Subject, 5), SenderDomains = make_set(SenderFromDomain, 10), SenderIPs = make_set(SenderIPv4, 10) by CampaignId, CampaignName, CampaignType, CampaignSubtype, DeliveryAction, DeliveryLocation | order by AffectedUsers desc, Messages desc This query helps separate campaigns that were blocked from campaigns that actually reached users. From a SOC perspective, delivered messages deserve closer attention, especially if they reached the inbox. Query 3: Identify Users Who Clicked Campaign URLs Delivery is important, but clicks usually increase the priority of the incident. This query joins campaign data with UrlClickEvents. let Campaigns = CampaignInfo | where Timestamp > ago(14d) | project CampaignId, CampaignName, CampaignType, CampaignSubtype, NetworkMessageId, RecipientEmailAddress; Campaigns | join kind=inner ( UrlClickEvents | where Timestamp > ago(14d) | project NetworkMessageId, AccountUpn, Url, ActionType, IsClickedThrough, ThreatTypes, DetectionMethods, IPAddress, Workload, ClickTime = Timestamp ) on NetworkMessageId | summarize FirstClick = min(ClickTime), LastClick = max(ClickTime), ClickEvents = count(), ClickedUsers = dcount(AccountUpn), ClickThroughUsers = dcountif(AccountUpn, IsClickedThrough == true), ClickedUrls = make_set(Url, 10), SourceIPs = make_set(IPAddress, 10) by CampaignId, CampaignName, CampaignType, CampaignSubtype | order by ClickThroughUsers desc, ClickedUsers desc, LastClick desc This query helps identify campaigns where users interacted with the payload. If a user clicked a phishing URL, the next step should usually include identity-focused investigation, such as reviewing sign-in activity, MFA status, session activity, and possible risky sign-ins. Query 4: Focus on Click-Through Events Safe Links may block access to a malicious site. In some cases, however, a user may continue through a warning page. Those cases should be reviewed carefully. let Campaigns = CampaignInfo | where Timestamp > ago(30d) | project CampaignId, CampaignName, CampaignType, CampaignSubtype, NetworkMessageId, RecipientEmailAddress; Campaigns | join kind=inner ( UrlClickEvents | where Timestamp > ago(30d) | where IsClickedThrough == true | project NetworkMessageId, AccountUpn, Url, ActionType, ThreatTypes, IPAddress, ClickTime = Timestamp ) on NetworkMessageId | project ClickTime, CampaignId, CampaignName, CampaignType, CampaignSubtype, AccountUpn, RecipientEmailAddress, Url, ActionType, ThreatTypes, IPAddress | order by ClickTime desc This is one of the most useful views during incident response. A click-through event does not automatically mean compromise, but it is a strong reason to investigate the user account further. Query 5: Confirm Post-Delivery Remediation A malicious message may be delivered first and removed later by ZAP, AIR, or manual remediation. This query joins CampaignInfo with EmailPostDeliveryEvents. let Campaigns = CampaignInfo | where Timestamp > ago(30d) | project CampaignId, CampaignName, CampaignType, CampaignSubtype, NetworkMessageId, RecipientEmailAddress; Campaigns | join kind=leftouter ( EmailPostDeliveryEvents | where Timestamp > ago(30d) | project NetworkMessageId, RecipientEmailAddress, RemediationTime = Timestamp, Action, ActionType, ActionTrigger, ActionResult, DeliveryLocation, SourceLocation ) on NetworkMessageId, RecipientEmailAddress | summarize RemediatedMessages = dcountif(NetworkMessageId, isnotempty(ActionType)), RemediationTypes = make_set(ActionType, 10), RemediationResults = make_set(ActionResult, 10), LastRemediation = max(RemediationTime) by CampaignId, CampaignName, CampaignType, CampaignSubtype | order by LastRemediation desc This helps answer a very important question: Were the delivered malicious messages actually removed? This is useful for both SOC triage and reporting because it shows not only detection, but also response. Query 6: Campaign Blast Radius Summary The following query combines campaign, delivery, click, and remediation data into one campaign-level view. let TimeRange = 30d; let Campaigns = CampaignInfo | where Timestamp > ago(TimeRange) | project CampaignId, CampaignName, CampaignType, CampaignSubtype, NetworkMessageId, RecipientEmailAddress; let Delivery = EmailEvents | where Timestamp > ago(TimeRange) | summarize DeliveryActions = make_set(DeliveryAction, 10), DeliveryLocations = make_set(DeliveryLocation, 10), DeliveredMessages = dcountif(NetworkMessageId, DeliveryAction =~ "Delivered"), JunkedMessages = dcountif(NetworkMessageId, DeliveryAction =~ "Junked"), BlockedMessages = dcountif(NetworkMessageId, DeliveryAction =~ "Blocked"), Subjects = make_set(Subject, 5), SenderDomains = make_set(SenderFromDomain, 10) by NetworkMessageId, RecipientEmailAddress; let Clicks = UrlClickEvents | where Timestamp > ago(TimeRange) | summarize ClickEvents = count(), ClickThroughEvents = countif(IsClickedThrough == true), FirstClick = min(Timestamp), LastClick = max(Timestamp), ClickedUrls = make_set(Url, 10) by NetworkMessageId; let Remediation = EmailPostDeliveryEvents | where Timestamp > ago(TimeRange) | summarize RemediationActions = make_set(ActionType, 10), LastRemediation = max(Timestamp) by NetworkMessageId, RecipientEmailAddress; Campaigns | join kind=leftouter Delivery on NetworkMessageId, RecipientEmailAddress | join kind=leftouter Clicks on NetworkMessageId | join kind=leftouter Remediation on NetworkMessageId, RecipientEmailAddress | summarize AffectedUsers = dcount(RecipientEmailAddress), Messages = dcount(NetworkMessageId), DeliveredMessages = sum(DeliveredMessages), JunkedMessages = sum(JunkedMessages), BlockedMessages = sum(BlockedMessages), TotalClickEvents = sum(ClickEvents), ClickThroughEvents = sum(ClickThroughEvents), Subjects = make_set(Subjects, 10), SenderDomains = make_set(SenderDomains, 10), ClickedUrls = make_set(ClickedUrls, 10), RemediationActions = make_set(RemediationActions, 10), LastClick = max(LastClick), LastRemediation = max(LastRemediation) by CampaignId, CampaignName, CampaignType, CampaignSubtype | extend SuggestedPriority = case( ClickThroughEvents > 0, "High", TotalClickEvents > 0, "Medium", DeliveredMessages > 0, "Medium", "Low" ) | order by SuggestedPriority asc, AffectedUsers desc, Messages desc This type of query can be useful during hunting sessions, incident review, and campaign reporting. The goal is not only to collect more data. The goal is to help the analyst decide what needs attention first. Correlating Campaign Activity with Microsoft Sentinel When Microsoft Defender XDR is connected to Microsoft Sentinel, incidents and alerts can be synchronized into the Sentinel incident queue. This allows the SOC to correlate campaign-related email activity with other security signals, such as: Suspicious sign-ins Identity alerts Endpoint alerts Cloud app activity OAuth consent activity Data exfiltration attempts Related Microsoft XDR incidents For example, if a user clicked a phishing URL, the SOC can then review whether the same user had suspicious sign-in activity shortly after the click. The following query is a simple starting point for reviewing Microsoft XDR incidents in Microsoft Sentinel. SecurityIncident | where TimeGenerated > ago(30d) | where ProviderName == "Microsoft XDR" | where Title has_any ("phish", "phishing", "email", "malware", "campaign") | summarize Incidents = count(), HighSeverity = countif(Severity == "High"), MediumSeverity = countif(Severity == "Medium"), Closed = countif(Status == "Closed"), Active = countif(Status == "Active") by bin(TimeGenerated, 1d) | order by TimeGenerated desc This query does not replace campaign hunting. It simply helps analysts understand how email-related activity is represented in the Sentinel incident queue. Suggested SOC Workflow A practical campaign-centric workflow could look like this: Step 1: Start from Campaign Views Review campaigns with delivered messages, clicked users, visited links, or high user impact. Step 2: Pivot to KQL Use CampaignInfo to list campaign-related messages and affected recipients. Step 3: Validate Delivery Join with EmailEvents to confirm whether messages were blocked, junked, delivered, or replaced. Step 4: Review User Interaction Join with UrlClickEvents to identify users who clicked URLs or clicked through Safe Links warnings. Step 5: Confirm Remediation Join with EmailPostDeliveryEvents to confirm whether delivered messages were removed after delivery. Step 6: Correlate in Sentinel Review related Microsoft XDR incidents and correlate with identity, endpoint, and cloud activity. Step 7: Decide Response Depending on the impact, the SOC may decide to: Escalate the incident Notify affected users Review user sign-ins Revoke user sessions Reset passwords Block sender domains or URLs Submit false negatives Create a watchlist for related indicators Tune analytics rules or response processes Suggested Priority Logic Not every campaign needs the same level of response. A simple triage model could be: Condition Suggested priority Campaign blocked before delivery Low Campaign delivered to junk Low to Medium Campaign delivered to inbox Medium Campaign delivered to multiple inboxes Medium to High User clicked URL High User clicked through warning High Priority account clicked High Click followed by suspicious sign-in Critical This model should be adapted to each organization’s risk profile and response process. Limitations and Things to Validate Before using this approach in production, validate the following: Defender for Office 365 Plan 2 availability Campaign Views permissions CampaignInfo table availability Defender XDR connector configuration Advanced hunting event streaming Field names in your environment Retention period Data latency Join behavior using NetworkMessageId Whether click events can be joined to email metadata in all cases One important limitation is that some URL click events may not join cleanly with email metadata. For example, clicks from Drafts or Sent Items may not have the same message metadata available for correlation. Also, because CampaignInfo is currently documented as Preview, I would avoid depending on it alone for critical production automation without testing and validation.418Views0likes0CommentsOperational Notes on Microsoft Security Copilot Agents in Defender XDR and Microsoft Entra ID
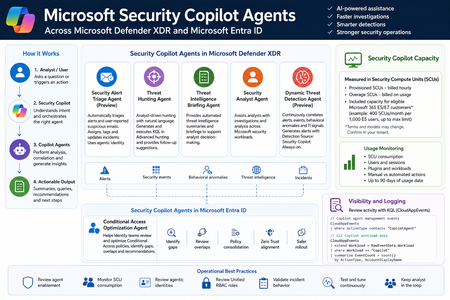
Microsoft Security Copilot is now becoming more visible inside day-to-day security operations, especially through embedded experiences and agent-based workflows across Microsoft Defender XDR, Microsoft Entra ID, Microsoft Intune, and Microsoft Purview. Instead of looking at Security Copilot only as a standalone prompt interface, SOC and identity teams should also understand how Security Copilot agents are deployed, how they consume Security Compute Units, how they appear in operational workflows, and where activity can be monitored. This post summarizes practical observations from a security operations perspective, with a focus on Microsoft Defender XDR, Microsoft Entra ID, usage monitoring, and KQL-based activity review. Licensing & Capacity Units Requirements Requires eligible Microsoft security licensing, typically: Microsoft 365 E5 Microsoft 365 E7 Security Compute Units (SCUs) Security Copilot capacity is measured using Security Compute Units (SCUs). SCUs are billed based on provisioned capacity. Indicative pricing: $4 per Provisionied SCU/hour $6 per Overage SCU/hour Billing is calculated hourly, based on the amount of SCUs provisioned. Included Capacity Organizations with: 1,000 Microsoft 365 E5 licenses Receive: 400 included SCUs Included SCUs are shared across the tenant within a common capacity pool. Scaling SCU capacity can be scaled dynamically based on operational requirements and workload demand. Data Retention Security Copilot session and interaction data without active SCU-backed retention is typically retained for: 90 days Security Copilot Agents - Microsoft Defender This section outlines the Microsoft Security Copilot agents currently available in the Microsoft Defender portal. NameKey characteristics Security Alert Triage Agent (Preview) Manual setup from Defender portal Automatically creates Unified RBAC custom role Runs automatically when a user reports a suspicious email or when a new supported alert is generated, supported alert sources: MDI, MDC, MDO If an alert tuning rule is enabled, it will be automatically disabled when the agent is deployed. Creates and connects with agentic user account: Phishing Triage Agent (Security Copilot) Automatic alert assignment to SecurityCopilotAgentUser-db16fec3-f1fb-4632-843e-46d07408c584@<tenant-domain>Alert was assigned to Phishing Triage Agent (Security Copilot). Adds Tag Agent to the created Incidents Threat Hunting Agent Manual setup from Defender portal Automatically creates Unified RBAC custom role This agent runs manually. There isn't an automatic trigger. Creates and connects with agentic user account: Threat Hunting Agent (Security Copilot) Analyst Questions in natural language Generates and executed KQL queries in Advanced hunting Provides charts, dynamic follow-up questions and remediation actions recommendations No activity is identified from agent's identity during agent execution Threat Intelligence Briefing Agent Manual setup from Defender portal Provides automated TI briefing summary Configured from https://security.microsoft.com/securitysettings/defender/agent_configuration-threatintelligencebriefingagent Security Analyst Agent Manual setup from Defender portal Dynamic Threat Detection Agent (Preview) Automatically enabled always-on, runs continuously in the background Correlates: Alerts, Security events, Behavioral anomalies, TI signals Generates Alerts with Detection Source: Security Copilot The Alerts can be correlated with existing Multi-Stage Incidents No agentic user account identity is used by this agent Available free of charge during public preview, will begin consuming Security Compute Units (SCUs) once generally available (GA) Incidents handled by Security Alert Triage Agent: Alerts created by Dynamic Threat Detection Agent: Execution of Threat Hunting Agent: View agents in use: https://security.microsoft.com/security-copilot/agents View Unified RBAC custom roles: https://security.microsoft.com/mtp_roles View Security Copilot user identities in Microsoft Entra ID: Notes: CloudAppEvents activity logs only from the following agents: Phishing Triage Agent Conditional Access Optimization Agent Security Copilot Agents - Microsoft Entra ID Conditional Access Optimization Agent Usage Monitoring Sign-in to Security Copilot portal using Global Admin account and navigate to the following location: https://securitycopilot.microsoft.com/usage-monitoring Reference: https://learn.microsoft.com/en-us/copilot/security/manage-usage Logging Activity Copilot Agents Management: CloudAppEvents | where ActionType contains "CopilotAgent" | extend AgentName = RawEventData.AgentName | extend Workload = RawEventData.Workload | extend ResultStatus = RawEventData.ResultStatus | project TimeGenerated, ActionType, ResultStatus, AgentName, Application, Workload All Copilot Workload data: CloudAppEvents | extend Workload = RawEventData.Workload | where Workload == "Copilot" | summarize EventCount = count() by ActionType, AccountDisplayName803Views3likes1Comment
SessionID in IdentityLogonEvents?
Hi, The SessionId information is not available in IdentityLogonEvents. The SessionID data can only be found in the XDR table AADSignInEventsBeta. According to the documentation of that table "All sign-in schema information will eventually move to the IdentityLogonEvents table". I cannot find the SessionID in Sentinel anywhere else than in CloudAppEvents. Is this expected? How are we supposed to investigate stolen sessions without the sessionId information in Sentinel?501Views1like1CommentIdentity Attack Graph in Microsoft Sentinel
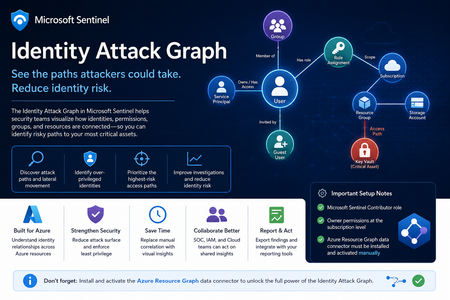
Identity is now one of the most important attack surfaces in cloud security. In many real-world incidents, attackers do not rely only on malware or network movement. Instead, they abuse identities, permissions, role assignments, group memberships, service principals, and misconfigured access paths to move from an initial compromise to high-value resources. This is why the new Identity Attack Graph in Microsoft Sentinel is an important capability. It helps security teams visualize how identities are connected to Azure resources and how an attacker could potentially move from one identity to another resource through permissions and relationships. What is the Identity Attack Graph? The Identity Attack Graph in Microsoft Sentinel provides a visual way to understand how identities, permissions, groups, and Azure resources are connected. Instead of manually checking multiple portals, logs, and role assignments, the graph helps analysts understand relationships such as: Which identities have access to specific Azure resources Which users or service principals are over-privileged Which groups provide indirect access to sensitive resources Which identities may have a path to critical assets What the potential blast radius of a compromised identity could be How attackers could move laterally through identity and permission relationships This is especially useful because identity risk is often not obvious when looking at a single user, group, or role assignment in isolation. The real risk usually appears when these relationships are connected together. A user may not directly have access to a sensitive resource, but the user may be a member of a group that has access to another resource, which then has permissions that create a path toward a high-value asset. The Identity Attack Graph helps expose these hidden relationships. Why this matters In many Azure environments, permissions grow over time. Users change roles, groups are reused, emergency access is granted, service principals are created, and temporary permissions are not always removed. As a result, organizations often end up with: Too many privileged identities Unused or stale permissions Service principals with excessive access Guest users with unnecessary permissions Groups that provide indirect access to sensitive resources Subscription-level roles that are broader than required Lack of visibility into who can reach critical assets Traditional investigation usually requires analysts to move between several places, including Microsoft Entra ID, Azure RBAC, Azure Activity logs, Sentinel queries, Defender XDR, and Azure Resource Graph. The Identity Attack Graph reduces this complexity by presenting identity relationships as a connected graph. This makes it easier to answer practical security questions such as: “What can this identity access?” “What happens if this user is compromised?” “Which identities have a path to critical resources?” “Which access path should we remediate first?” “Which permissions create the highest risk?” “Why does this identity have access to this asset?” Key use cases The feature can support several important identity security and cloud security scenarios. 1. Attack path discovery Security teams can use the graph to identify how an attacker could move from a compromised identity to a sensitive Azure resource. This is useful during both proactive assessments and active incident response. For example, if a user account is suspected to be compromised, the graph can help identify which resources may be reachable through that identity’s direct or indirect permissions. 2. Blast-radius analysis When an identity is compromised, one of the first questions is: What could the attacker access with this identity? The Identity Attack Graph can help analysts understand the potential impact of a compromised user, group, service principal, or managed identity. This can help with containment, prioritization, and communication with stakeholders. 3. Over-privileged identity detection The graph can help identify identities that have more permissions than they need. Include: Users with Owner or Contributor access at subscription level Service principals with broad permissions Guest users with privileged access Groups that grant access to sensitive resources Identities that have access to multiple critical assets This is useful for enforcing least privilege and reducing identity attack surface. 4. Privileged access review IAM and cloud security teams can use the graph to support access reviews. Instead of only reviewing a list of role assignments, teams can understand the real impact of those permissions. This helps answer: Is this role assignment still required? Does this group create unnecessary risk? Does this identity have access to critical resources? Is this access direct or inherited? Is this path expected or suspicious? 5. Incident response and threat hunting For SOC teams, the graph can support investigations involving: Suspicious sign-ins Compromised users Privilege escalation Suspicious role assignments Lateral movement Service principal abuse Unusual access to sensitive resources The graph does not replace logs or hunting queries, but it gives analysts a faster way to understand relationships and prioritize what to investigate next. Important prerequisites and setup notes During my evaluation, there were a few important setup requirements that should be clearly highlighted. Microsoft Sentinel permissions The environment must already be onboarded to Microsoft Sentinel, and the user testing or configuring the feature must have the appropriate Microsoft Sentinel permissions. The documented role requirement includes Microsoft Sentinel Contributor. However, in my experience, this is not always enough for the full onboarding and validation experience. Subscription-level Owner permission One important prerequisite that should be clearly mentioned is that Owner permissions at the Azure subscription level may be required. This is especially important during onboarding and activation, because the graph depends on access to Azure resource and permission relationships. If the user does not have sufficient subscription-level permissions, some setup steps or visibility into resources and relationships may not work as expected. Recommended permission note: In addition to Microsoft Sentinel permissions, ensure that the user configuring the preview has Owner permissions at the subscription level for the subscriptions that should be represented in the graph. This should be made very clear in the onboarding documentation to avoid confusion during deployment. Required data connector: Azure Resource Graph Another very important setup step is the Azure Resource Graph data connector. The Azure Resource Graph connector must be: Installed manually Activated manually Connected to the relevant Sentinel workspace This is a key point. The connector is not automatically enabled just because the Identity Attack Graph feature is available. Without this connector, Sentinel may not have the required Azure resource relationship data needed to build a useful graph. Why Azure Resource Graph is important Azure Resource Graph provides visibility across Azure resources, subscriptions, and relationships. For an identity attack graph, this data is essential. The graph needs to understand not only identities, but also the resources those identities can reach. This may include: Subscriptions Resource groups Storage accounts Key Vaults Virtual machines Managed identities Role assignments Resource relationships Resource hierarchy Critical assets Without Azure Resource Graph data, the attack graph may not provide the full picture of how identities connect to Azure resources. For this reason, I believe the onboarding instructions should explicitly state: The Azure Resource Graph data connector must be manually installed and activated before using the Identity Attack Graph. Recommended onboarding checklist Before using the Identity Attack Graph, I would recommend validating the following: Requirement Recommendation Microsoft Sentinel workspace Ensure the workspace is active and accessible Sentinel role Microsoft Sentinel Contributor or equivalent access Subscription permissions Owner permissions at subscription level Azure Resource Graph connector Manually install and activate the connector Azure RBAC visibility Ensure access to relevant role assignments Microsoft Entra ID visibility Ensure identity and group data is available Resource visibility Validate that relevant subscriptions and resources are visible Data freshness Allow enough time for data collection and graph population This checklist can help avoid issues where the feature appears available but does not show the expected relationships. How the Identity Attack Graph improves investigation Before using a graph-based approach, an analyst often needs to manually collect and correlate data from multiple sources. A typical investigation may include: Checking the user in Microsoft Entra ID Reviewing group memberships Reviewing Azure RBAC assignments Checking subscription-level access Looking at resource-level permissions Reviewing PIM activations Searching Sentinel logs Running KQL queries Checking Azure Activity logs Validating access with cloud or IAM teams This process can be time-consuming. The Identity Attack Graph helps reduce this effort by showing relationships visually. This allows the analyst to understand the possible path faster and decide where to focus. For example, instead of manually asking: “Does this user have access to this resource through any group, role, or inherited permission?” The graph can help show the relationship directly. This is valuable because many risky permissions are indirect. The user may not have direct access, but may inherit access through a group, role assignment, nested relationship, or service principal path. Where validation is still needed Although the graph provides strong visibility, I would still validate findings before taking remediation action. This is especially important because removing access can affect business operations or production systems. I would still validate with: Microsoft Sentinel KQL queries Microsoft Entra sign-in logs Microsoft Entra audit logs Azure Activity logs Azure RBAC role assignments PIM activation history Defender XDR signals Defender for Cloud recommendations Azure Resource Graph queries IAM team input Cloud platform team input Application owner confirmation The graph is very useful for discovery and prioritization, but final remediation decisions should still be validated. GQL and graph-based investigation One of the interesting aspects of this feature is the use of graph-based thinking. Security teams are already familiar with query languages such as KQL for log analytics. However, graph investigation is different. KQL is excellent for searching and analyzing events over time, such as sign-ins, alerts, audit logs, and activity logs. Graph Query Language, or GQL, is designed for querying connected data. Instead of only asking what happened at a specific time, graph queries help answer how entities are connected. In identity security, this is very powerful because the risk often exists in the relationship between objects. Graph entities include: Users Groups Service principals Managed identities Roles Subscriptions Resource groups Azure resources Permissions Sessions Attack paths Graph relationships include: User is member of group Group has role assignment Identity has access to resource Service principal owns application Managed identity can access Key Vault User can escalate privilege Identity can reach critical asset This allows analysts to ask more relationship-focused questions, such as: Which identities can reach this resource? What is the shortest path from this user to a critical asset? Which groups create privileged access? Which service principals have paths to sensitive resources? Which identities have indirect access through nested relationships? Which attack paths include subscription Owner or Contributor permissions? KQL vs GQL: why both are useful KQL and GQL serve different but complementary purposes. Area KQL GQL / Graph Querying Main purpose Analyze logs and events Analyze relationships and paths Best for Time-based investigation Connected identity/resource investigation question “Did this user sign in from a risky location?” “What resources can this user reach?” Data model Tables Nodes and edges Common use Detection, hunting, analytics Attack path discovery, relationship mapping Strength Event correlation Path discovery In practice, security teams need both. KQL can identify a suspicious sign-in. The Identity Attack Graph can show what the compromised identity could access. KQL can then be used again to validate whether the attacker interacted with those resources. This creates a strong workflow between event-based detection and relationship-based investigation. Graph investigation scenarios The following are conceptual are the types of graph questions that would be useful in identity attack path analysis. Find paths from a user to critical resources A useful graph query would help answer: Show me all paths from this user to critical Azure resources. This could help determine whether a compromised identity has a direct or indirect route to sensitive assets. Find identities with paths to Key Vaults Key Vaults often contain secrets, certificates, and keys. A graph query could help identify: Which users, groups, service principals, or managed identities have a path to Key Vault resources? This would be useful for prioritizing access review and remediation. Find subscription-level privileged identities Subscription-level roles are high-impact because they can provide broad access. A graph query could help find: Which identities have Owner or Contributor access at subscription level? This is especially important because subscription-level permissions can create wide attack paths. Find indirect access through groups Many access paths are created through group membership. A graph query could help answer: Which users have access to this resource through group membership? This can help IAM teams clean up excessive or unnecessary group-based access. Find service principals with broad access Service principals are often used for automation and applications, but they can become high-risk if over-privileged. A useful query would identify: Which service principals have broad access to subscriptions or critical resources? This is important because service principal compromise can lead to significant impact. How GQL can improve analyst workflows Adding strong GQL support to the graph explorer would make the feature more powerful for advanced users. You could use graph queries to: Search for specific paths Filter by identity type Filter by role Filter by resource type Find shortest paths Find high-risk paths Exclude known approved paths Focus on critical assets Query only privileged relationships Identify unexpected permission chains This would help both SOC analysts and cloud security engineers move from visual exploration to repeatable analysis. A SOC analyst may want a quick visual graph during an incident, while a cloud security engineer479Views3likes0Comments