microsoft fabric
30 Topics
Implementing Data Vault 2.0 on Fabric Data Warehouse
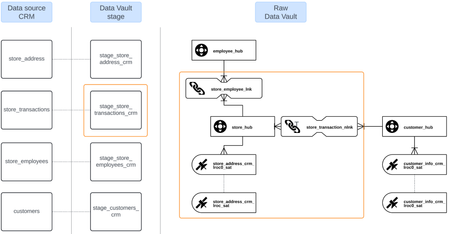
In the previous articles of this series, we have discussed how to model Data Vault on Microsoft Fabric. Our initial focus was on the basic entity types including hubs, links, and satellites; advanced entity types, such as non-historized links and multi-active satellites and the third article was modeling a more complete model, including a typical modeling process, for Microsoft Dynamics CRM data.13KViews1like1CommentDecision Guide for Selecting an Analytical Data Store in Microsoft Fabric
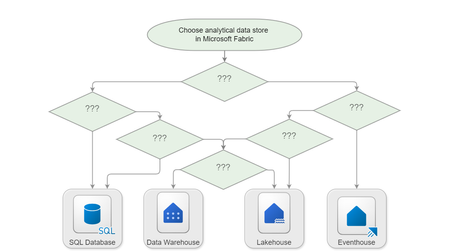
Learn how to select an analytical data store in Microsoft Fabric based on your workload's data volumes, data type requirements, compute engine preferences, data ingestion patterns, data transformation needs, query patterns, and other factors.11KViews15likes5CommentsAI-Ready Infrastructure Design - A pattern for Enterprise Scale
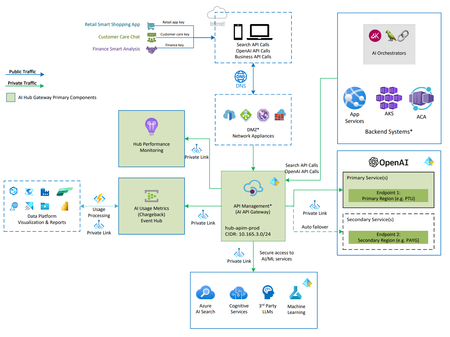
AI Hub Gateway Solution Accelerator – a comprehensive reference architecture designed to address Decentralized AI Management related challenges head-on. This innovative solution provides a set of guidelines and best practices for implementing a central AI API gateway, empowering various line-of-business units to leverage Azure AI services efficiently and securely.11KViews3likes1CommentRediscover your data’s value by skilling up on Microsoft Fabric
Check out the latest Microsoft Fabric learning modules, skilling exercises, training offers, and live workshops with Azure experts to accelerate your enterprise organization's data potential with Microsoft Fabric10KViews0likes0Comments
Simplifying Migration to Fabric Real-Time Intelligence for Power BI Real Time Reports
Power BI with real-time streaming has been the preferred solution for users to visualize streaming data. Real-Time streaming in PowerBI is being retired. We recommend users to start planning the migration of their data processing pipeline to Fabric Real-Time Intelligence.8.7KViews2likes1CommentEfficient Log Management with Microsoft Fabric
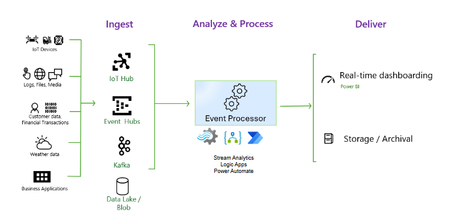
Introduction In the era of digital transformation, managing and analyzing log files in real-time is essential for maintaining application health, security, and performance. There are many 3rd party solutions in this area allowing collecting / processing storing, analyzing and acting upon this data source. But sometimes as your systems scale, those solution can become very costly, their cost model increases based on the amount of ingested data and not according to the real resources utilization or customer value This blog post explores a robust architecture leveraging Microsoft Fabric SaaS platform focused on its Realtime Intelligence capabilities for efficient log files collection processing and analysis. The use cases can vary from simple application errors troubleshooting, to more advanced use case such as application trends detection: detecting slowly degrading performance issues: like average user session in the app for specific activities last more than expected to more proactive monitoring using log based KPIs definition and monitoring those APIS for alerts generation Regarding cost , since Fabric provides a complete separation between compute and storage you can grow your data without necessarily growing your compute costs and you still pay for the resources that re used in a pay as you go model. Architecture Overview The proposed architecture integrates Microsoft Fabric’s Real time intelligence (Realtime Hub) with your source log files to create a seamless, near real-time log collection solution It is based on Microsoft Fabric: a SAAS solution which is a unified suite integrating several best of breed Microsoft analytical experiences. Fabric is a modern data/ai platform based on unified and open data formats (parquet/delta) allowing both classical data lakes experiences using both traditional Lakehouse/warehouse SQL analytics as well as real-time intelligence on semi structured data , all in on a lake-centric SaaS platform. Fabric's open foundation with built-in governance enables you to connect to various clouds and tools while maintaining data trust. This is High level Overview of Realtime Intelligence inside Fabric Log events - Fabric based Architecture When looking in more details a solution for log collection processing storage and analysis we propose the following architecture Now let's discuss it in more details: General notes: Since Fabric is a SAAS solution, all the components can be used without deploying any infrastructure in advance, just by a click of a button and very simple configurations you can customize the relevant components for this solution The main components used in this solution are Data Pipeline Onelake and Eventhouse Our data source for this example is taken from this public git repo: https://github.com/logpai/loghub/tree/master/Spark The files were taken and stored inside an S3 bucket to simulate the easiness of the data pipeline integration to external data sources. A typical log file looks like this : 16/07/26 12:00:30 INFO util.Utils: Successfully started service 'sparkDriverActorSystem' on port 59219. 16/07/26 12:00:30 INFO spark.SparkEnv: Registering MapOutputTracker 16/07/26 12:00:30 INFO spark.SparkEnv: Registering BlockManagerMaster 16/07/26 12:00:30 INFO storage.DiskBlockManager: Created local directory at /opt/hdfs/nodemanager/usercache/curi/appcache/application_1460011102909_0176/blockmgr-5ea750cb-dd00-4593-8b55-4fec98723714 16/07/26 12:00:30 INFO storage.MemoryStore: MemoryStore started with capacity 2.4 GB Components Data Pipeline First challenge to solve is how to bring the log files from your system into Fabric this is the Log collection phase: many solutions exist for this phase each with its pros and cons In Fabric the standard approach to bring data in is by use of Copy Activity in ADF or in its Fabric SAAS version is now called Data Pipeline: Data pipeline is a low code / no code tool allowing to manage and automate the process of moving and transforming data within Microsoft Fabric, a serverless ETL tool with more than 100 connectors enabling integration with a wide variety of data sources, including databases, cloud services, file systems, and more. In addition, it supports an on prem agent called self-hosted integration runtime, this agent that you install on a VM, acts as a bridge allowing to run your pipeline on a local VM and securing your connection from on prem network to the cloud Let’s describe in more details our solution data pipeline: Bear in mind ADF is very flexible and supports reading at scale from a wide range of data sources / files integrated as well to all major cloud vendors from blob storage retrieval : like S3, GCS, Oracle Cloud, File systems, FTP/SFTP etc so that even if your files are generated externally to Azure this is not an issue at all. Visualization of Fabric Data Pipeline Log Collection ADF Copy Activity: Inside Data pipeline we will create an Activity called Copy Activity with the following basic config Source: mapped to your data sources: it can be azure blob storage with container containing the log files, other cloud object storage like S3 or GCS , log files will be retrieved in general from a specific container/folder and are fetched based on some prefix/suffix in the file name. To support incremental load process we can configure it to delete the source files that it reads so that once the files are successfully transferred to their target they will be automatically deleted from their source . On the next iteration pipeline will not have to process the same files again. Sink: Onelake/Lakehouse folder: we create ahead of time a Lakehouse which is an abstract data container allowing to hold and manage at scale your data either structured or unstructured, we will then select it from the list of connectors (look for Onelake/Lakehouse) Log Shippers: This is an optional component, sometimes it is not allowed for the ETL to access your OnPrem Vnet , in this case tools like Fluentd , Filebeat , Open Telemetry collector used to forward your application collected logs to the main entry point of the system: the Azure Blob Storage. Azcopy CLI: if you don’t wish to invest into expensive tools and all you need to copy your data in a scale/secure manner to Azure Storage, you might consider create your own log shipping solution based on the free Azcopy tool together withs some basic scripting around it for scheduling: Azcopy is a command-line utility designed for high-performance uploading, downloading, and copying data to and from Microsoft Azure Blob and File storage. Fabric first Activity : Copy from Source Bucket to Lakehouse Log Preparation Upon log files landing in the azure blob storage, EventStream can be used to trigger the Data Pipeline that will handle the data preparation and loading phase. So what is Data preparation phase’s main purpose? After the log files land in the storage and before they are loaded to the realtime logs database the KQL Database , it might be necessary to transform the data with some basic manipulations . The reasons for that might be different A Few examples Bad data formats: for example, sometimes logs files contain problematic characters like new lines inside a row (stack trace error message with new lines as part of the message field of the record) Metadata enrichment: sometimes the log file names contain in their name some meaningful data : for example file name describes the originating process name / server name , so this metadata can be lost once the file content is loaded into database Regulation restrictions: sometimes logs contain private data like names, credit card numbers, social security number etc called PII that must be removed , hashed or encrypted before the load to database In our case we will be running a pyspark notebook who reads the files from Onelake folder, fixes the new lines inside a row issue, and create new files in another Onelake folder, we call this notebook with a base parameter called log_path that defines the log files location on the Onelake to read from Fabric second Activity : Running the Notebook Log Loading Inside Data pipeline , the last step, after the transformation phase, we call again the Copy data activity but this time source and sink are differen: Source: Lakehouse folder (previous notebook output) Sink: Evenhouse specific Table (created ahead of time): it is basically an empty table (lograw) Visualization of Fabric last Activity : Loading to EventHouse In summary for this stage the log collection and preparation: we broke this into 3 data pipeline activities: Copy Activity: Read the log files from source: This is the first step of the log ingestion pipeline it is running inside our orchestrator Data pipeline. Run Notebook Activity : Transform the log files : this is the execution of a single or chain of notebooks Copy Activity : Load the log files into destination datatbase : KQL inside Evenhouse : the logs database table called lograw, it is a specific table created ahead of time inside EventHouse Database Inside The Eventhouse We needed to create a KQL database with a table to hold the raw ingested log records KQL datbase is a scalable and efficient storage solution for log files, optimized for high-volume data ingestion and retrieval. Eventhouses and KQL databases operate on a fully managed Kusto engine. With an Eventhouse or KQL database, you can expect available compute for your analytics within 5 to 10 seconds. The compute resources grow with your data analytic needs. Log Ingestion to KQL Database with Update Policy We can separate the ETL transformation logic of what happens to the data before, it reaches the Eventhouse KQL database and after that. Before it reached the database , the only transformation we did was calling during the data pipeline a notebook to handle the new lines merge logic, This cannot be easily done as part of the database ingestion logic simply because when we try to load the files with new lines as part of a field of a record , it breaks the convention and what happens is that the ingestion process creates separate table records for each new line of the exceptions stacktrace. On the other hand, we might need to define basic transformation rules: such as date formatting, type conversion (string to numbers) , parse and extract some interesting value from a String based on regular exception, create JSON (dynamic type) of a hierarchical string (XML / JSON string etc) for all these transformations we can work with what is called an update policy we can define a simple ETL logic inside KQL database as explained here During this step we create from logsraw staging table a new table called logparsed , that will be our destination final table for the log queries. Those are the KQL Tables defined to hold the log files .create table logsraw ( timestamp:string , log_level:string, module:string, message:string) .create table logsparsed ( formattedDatetime:datetime , log_level:string, log_module:string, message:string) This is the update policy that automatically converts data from, the staging table logsraw to the destination table logparsed .create-or-alter function parse_lograw() { logsraw | project formattedtime = todatetime(strcat("20", substring(timestamp, 0, 2), "-", substring(timestamp, 3, 2), "-", substring(timestamp, 6, 2), "T", substring(timestamp, 9, 8))), log_level, logmodule=module, message } .alter table logsparsed policy update @'[{ "IsEnabled": true, "Source": "logsraw", "Query": "parse_lograw()", "IsTransactional": true, "PropagateIngestionProperties": true}]' Since we don't need to retain the data in the staging table (lograw) we can define a retention policy of 0 TTL like this : .alter-merge table logsraw policy retention softdelete = 0sec recoverability = disabled Query Log files After data is ingested and transformed it lands in a basic logs table that is schematized : logparsed, in general we have some common fields that are mapped to their own columns like : log level (INFO/ ERROR/ DEBUG) , log category , log timestamp (a datetime typed column) and log message which can be in general either a simple error string or a complex JSON formatted string in which case it is usually preferred to be converted to dynamic type that will bring additional benefits like simplified query logic, and reduced data processing (to avoid expensive joins) Example for Typical Log Queries Category Purpose KQL Query Troubleshooting Looking for an error at specific datetime range logsparsed | where message contains "Exception" and formattedDatetime between ( datetime(2016-07-26T12:10:00) .. datetime(2016-07-26T12:20:00)) Statistics Basic statistics Min/Max timestamp of log events logsparsed | summarize minTimestamp=min(formattedDatetime), maxTimestamp=max(formattedDatetime) Exceptions Stats Check Exceptions Distributions logsparsed | extend exceptionType = case(message contains "java.io.IOException","IOException", message contains "java.lang.IllegalStateException","IllegalStateException", message contains "org.apache.spark.rpc.RpcTimeoutException", "RpcTimeoutException", message contains "org.apache.spark.SparkException","SparkException", message contains "Exception","Other Exceptions", "No Exception") | where exceptionType != "No Exception" | summarize count() by exceptionType Log Module Stats Check Modules Distribution logsparsed | summarize count() by log_module | order by count_ desc | take 10 Realtime Dashboards After querying the logs, it is possible to visualize the query results in Realtime dashboards, for that all what’s required Select the query Click on Pin to Dashboard After adding the queries to tiles inside the dashboard this is a typical dashboard we can easily build: Realtime dashboards can be configured to be refreshed in Realtime like illustrated here: in which case user can very easily configure how often to refresh the queries and visualization : at the extreme case it can be as low as Continuus There are many more capabilities implemented in the Real-Time Dashboard, like data exploration Alerting using Data Activator , conditional formatting (change items colors based on KPIs threshold) and this framework and capabilities are heavily invested and keep growing. What about AI Integration ? Machine Learning Models: Kusto supports out of the box time series analysis allowing for example anomaly detection: https://learn.microsoft.com/en-us/fabric/real-time-intelligence/dashboard-explore-data and clustering but if it’s not enough for you, you can always mirror the data of your KQL tables into Onelake delta parquet format by selecting OneLake availability This configuration will create another copy of your data in open format delta parquet : you have it available for any Spark/Python/SparkML/SQL analytics for whatever machine learning exploration and ML modeling you wish to explore train and serve This is illustrated here : Bear in mind , there is no additional storage cost to turn on OneLake availability Conclusion A well-designed real-time intelligence solution for log file management using Microsoft Fabric and EventHouse can significantly enhance an organization’s ability to monitor, analyze, and respond to log events. By leveraging modern technologies and best practices, organizations can gain valuable insights and maintain robust system performance and security.7.4KViews1like0CommentsApproaches to Integrating Azure Databricks with Microsoft Fabric: The Better Together Story!
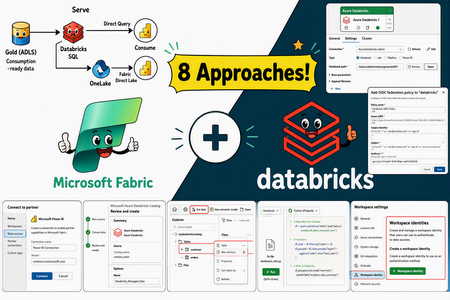
Azure Databricks and Microsoft Fabric can be combined to create a unified and scalable analytics ecosystem. This document outlines eight distinct integration approaches, each accompanied by step-by-step implementation guidance and key design considerations. These methods are not prescriptive—your cloud architecture team can choose the integration strategy that best aligns with your organization’s governance model, workload requirements and platform preferences. Whether you prioritize centralized orchestration, direct data access, or seamless reporting, the flexibility of these options allows you to tailor the solution to your specific needs.7.3KViews9likes1CommentExternal Data Sharing With Microsoft Fabric
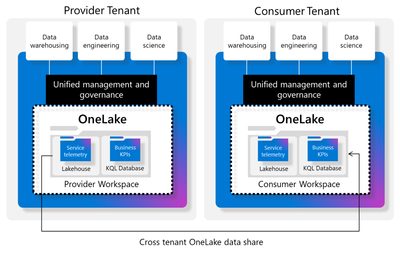
The demands and growth of data for external analytics consumption is rapidly growing. There are many options to share data externally and the field is very dynamic. One of the most frictionless and easy onboarding steps for external data sharing we will explore is with Microsoft Fabric. This external data allows users to share data from their tenant with users in another Microsoft Fabric tenant.6.8KViews3likes2CommentsTableau to Power BI Migration: Semantic Layer-First Approach for Cloud Architects
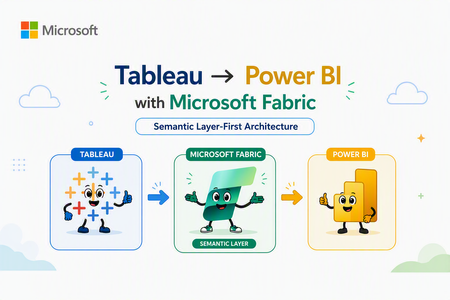
Author's: Mahjabin Ahmed, Yassine El Ouardi, Lavanya Sreedhar LavanyaSreedhar, Peter Lo PeterLo, Aryan Anmol aryananmol, Shreya Harvu shreyaharvu and Rafia Aqil Rafia_Aqil In this guide, we provide practical guidance for migrating from Tableau to Power BI, with a focus on technical best practices and architecture. Unifying business intelligence on the Microsoft Fabric platform, enterprises gain closer integration with Microsoft 365 (Teams, Copilot, Excel). For cloud solution architects and BI developers, a successful migration is not just about rebuilding dashboards in a new tool. It requires thoughtful architectural planning and a shift to a more model-centric approach to BI. Why Semantic Layer-First Architecture Matters The Traditional Migration Challenge Most Tableau to Power BI migrations follow a dashboard-centric approach: teams attempt to replicate existing Tableau workbooks, calculated fields, and LOD (Level of Detail) expressions directly into Power BI reports. While this may seem efficient initially, it creates significant downstream challenges: Duplicated logic: Each report embeds its own calculations and business rules, leading to conflicting KPIs across the organization Maintenance overhead: Changes to business logic require updating dozens or hundreds of individual reports Governance gaps: Without centralized definitions, semantic drift occurs—different teams calculate "Revenue" or "Active Customer" differently Scalability issues: As data volumes grow, report-level transformations become performance bottlenecks The Semantic Layer-First Alternative Microsoft's recommended approach centers on semantic models (formerly called datasets)—centralized, governed data models that separate business logic from visualization. In this architecture: The payoff is substantial: when data evolves or business rules change, you update the semantic model once, and all dependent reports automatically reflect the changes—no manual redesign required. Understanding Migration Complexity: Simple to Very Complex Dashboards Not all Tableau dashboards are created equal. The migration strategy should align with dashboard complexity, and the semantic layer approach becomes increasingly valuable as complexity grows. Follow a Step-by-Step Migration Strategy Migrating from Tableau to Power BI is not a one-click effort – it requires a mix of automated and manual refactoring, plus a sound change management plan. Below are key strategies and best practices for a successful migration: Audit your Tableau estate: Start by taking inventory of all existing Tableau workbooks, data sources, and dashboards. Determine what needs to be migrated (focus on high-value, widely used reports first) and identify any redundant or obsolete content that can be retired rather than converted. Conduct a proof-of-concept (PoC): Before migrating everything, pick a representative complex dashboard (or a subset of your data) and perform a pilot migration. This will help you validate that Power BI can connect to your data (e.g. setting up the Power BI gateways for on-premises sources), test performance (Import vs DirectQuery modes), and experiment with replicating key visuals or calculations. Use the PoC to uncover any surprises early – for example, test that any Level of Detail expressions or table calculations in Tableau can be re-created in DAX. The lessons learned here should inform your overall project plan. Use a phased migration approach: Plan to run Tableau and Power BI in parallel for some period, rather than switching everything at once. Migrate in waves – for example, by business unit or subject area – and incorporate user feedback as you go. This phased approach reduces risk and allows your team to improve the process with each iteration. It also gives end users time to adjust gradually. Migrate high-impact dashboards first: Prioritize the migration of key reports and dashboards that are critical to the business or have the most usage. Delivering these early wins will not only surface any technical challenges to solve but will also help demonstrate the value of Power BI’s capabilities to stakeholders. Early success builds buy-in and momentum for the rest of the migration. Reimagine (don’t just replicate) the experience: It’s rarely possible – or desirable – to exactly re-create every Tableau visualization pixel-for-pixel in Power BI. Embrace the opportunity to focus on business questions and improve user experience with Power BI’s features. For example, rather than replicating a complex Tableau workaround, you might implement a cleaner solution in Power BI using native features (like bookmarks, drilldowns, or simpler navigation between pages). Engage business users and subject matter experts during this redesign to ensure the new reports meet their needs. Enable dataset reusability: One major benefit of the Power BI approach is the ability to create shared datasets and dataflows. As you migrate, look for opportunities to create central semantic models (datasets) that can serve multiple reports. For instance, if several Tableau workbooks are all using similar data about sales, you can create one central Sales dataset in Power BI. Report creators across the organization can then build different Power BI reports on that single dataset without duplicating data or logic. This reduces maintenance and promotes a “build once, reuse often” strategy. Provide training and support: Expect a learning curve for teams moving to Power BI – especially those who are very fluent in Tableau. Plan for user upskilling and training programs. Establish a support community or office hours where new users can ask questions and get help. If possible, identify Power BI champions or recruit a Power BI Center of Excellence (COE) team who can guide others. During the transition, ensure there are subject matter experts (SMEs) available to address questions and validate that the new reports are correct. Manage change and expectations: It’s important to communicate why the organization is moving to Power BI (e.g. benefits like deeper integration, lower TCO, better governance) to get buy-in from end users. Some users may be resistant to change, especially if they’ve invested a lot of time in mastering Tableau. Prepare to handle varying responses – emphasize the personal benefits (like improved performance, new capabilities, or career growth with popular skills) to encourage adoption. Also, involve influential business users early and gather their feedback, so they feel ownership in the new solution. Establish governance from Day 1: Don’t wait until after migration to think about governance. Use this chance to set up Power BI governance aligned to best practices. Decide on important aspects such as workspace naming conventions, who can create or publish content, how you’ll monitor usage and costs, and how to manage data access and security (for example, designing a strategy for RLS/OLS/CLS, and deciding when to use per-user datasets vs. organizational semantic models). Good governance will ensure your shiny new Power BI environment doesn’t sprawl into chaos over time. Allow time for adjustment and iteration: Finally, be patient and iterative. Depending on the scale of your organization and the number of Tableau assets, a full migration can take months or even a year or more. Plan realistic transition periods where both systems might coexist. Continuously refine your approach with each wave of migration. Power BI’s frequent update cadence (monthly releases) means new features may emerge even during your project – stay updated, as new capabilities could simplify your migration (for example, the introduction of field parameters or Copilot might let you modernize certain Tableau features more easily). Reimagine (don’t just replicate) the experience (Step 5): Phase 1: Assessment and Planning 1. Audit Your Tableau Estate Inventory all workbooks, data sources, and calculated fields Identify high-traffic dashboards (prioritize for early migration) Categorize by complexity (Simple/Medium/Complex/Very Complex) 2. Design Your Semantic Architecture Map Tableau data sources to Power BI data sources (DirectQuery, Import, or Direct Lake) Plan star schema for fact/dimension tables Identify shared calculations that should live in semantic models vs. report-specific logic 3. Choose Storage Modes Source Type Recommended Mode Rationale Databricks Delta Lake Direct Lake Real-time analytics, no refresh lag Azure SQL Database DirectQuery or Import Based on data volume and refresh SLAs On-Premises SQL Server Import (via Gateway) Network latency considerations Excel/CSV files Import Small reference data Phase 2: Build the Semantic Layer 1. Create Star Schema Data Models Tableau often relies on flat, denormalized datasets. Power BI performs best with star schemas: Fact tables: Transactional data (sales, orders, events) with foreign keys to dimensions Dimension tables: Descriptive attributes (customers, products, dates) with primary keys Relationships: One-to-many from dimension to fact, leveraging bidirectional filtering sparingly 2. Migrate Calculations to DAX Measures Convert Tableau calculated fields to DAX measures in the semantic model: --Example of DAX: -- Define as measure: Total Revenue = SUMX( 'Sales', 'Sales'[Quantity] * 'Sales'[Unit Price] ) 2.1 Use Copilot to Accelerate DAX Development Leverage Copilot in Power BI Desktop to generate and validate DAX: Describe the calculation in natural language Copilot suggests DAX syntax Review, test, and refine 2.2 Document your Semantic Model Invest in creating an AI-ready foundation for your semantic model. AI systems need to understand unique business contexts in order to prioritize correct information to provide consistent and reliable responses to your end users. Name Tables and Columns Clearly: Avoid ambiguity in your semantic model. Use human-readable, business-friendly names. Avoid abbreviations, acronyms, or technical terms. This improves Copilot’s ability to interpret user intent. Create Meaningful Measures: Define reusable DAX measures for key business metrics (e.g., Revenue, Profit Margin). AI features rely on these to generate insights and summaries. Document Semantic Model objects: Add descriptions and synonyms to your Tables, Columns and measures. This enhances natural language querying and improves Copilot’s contextual understanding. Build an AI Data Schema: prepare your semantic model for AI by utilizing tooling features such as Prep data for AI. Phase 3: Understanding Migration Complexity: Simple to Very Complex Dashboards Not all Tableau dashboards are created equal. The migration strategy should align with dashboard complexity, and the semantic layer approach becomes increasingly valuable as complexity grows. 1. Dashboard Conversion Best Practices Think in "pages" not "sheets": Power BI reports combine multiple visuals per page; group related visuals logically Use slicers for interactivity: Replace Tableau filters with Power BI slicers and filter pane Leverage bookmarks for navigation: Create dynamic report experiences with show/hide containers Simple Complexity Level Category Tableau Feature Power BI Equivalent Microsoft Fabric Enhancements Best Practice Notes Data Model Single custom SQL Power Query for data shaping and ETL. OneLake Shortcuts for unified data access. Use star schema for optimized performance; push logic into the semantic layer rather than visuals. Calculations Basic IF/ELSE, SUM Data Analysis Expressions (DAX) for measures and calculated columns. Copilot for Power BI to assist with DAX creation. Fabric IQ for natural language queries. Centralize calculations in semantic models for consistency and governance. Medium Complexity Level Category Tableau Feature Power BI Equivalent Fabric Enhancements Best Practice Notes Data Model Multiple custom SQL (up to 3) Connect live to databases (Azure Databricks): DirectQuery in Power BI Connect with cloud data sources: Power BI data sources OneLake Shortcuts for unified access without databricks compute cost. Semantic Models can combine multiple sources. Optimize with star schema; Prefer OneLake Shortcuts for performance; avoid heavy transformations in visuals. Calculations Nested IFs, CASE Data Analysis Expressions (DAX) for measures and calculated columns. Copilot for Power BI to assist with DAX creation. Fabric Data Agent for conversational BI. Fabric IQ for natural language queries: Fabric IQ Centralize logic in semantic models; use Copilot for automation and validation; keep calculations reusable. Reporting Tooltip format in Bar and Map visuals Select All/Clear option for Single Select dropdown Standard tooltips offer help tooltips, text, and background formatting. Dynamic tooltip will be able to create the Tooltip page and reuse it in multiple visuals The customization is so much better than the OOB tooltips Create report tooltip pages in Power BI - Power BI | Microsoft Learn Use Clear All Slicers Button. Disable Single Select, Add Clear All Slicers button, Customize the Button and Use the Button Complex Complexity Level Category Tableau Feature Power BI Equivalent Fabric Enhancements Best Practice Notes Data Model Multiple sources Create relationship using more than one column Composite Models in Power BI (DirectQuery + Import) for combining multiple sources, also connect to various cloud services. Dataflows for pre-processing. Power BI allows a relationship between 2 tables based on only one active column. OneLake Shortcuts for unified access without Azure Databricks compute cost; Microsoft Fabric Dataflows Gen2 offers multiple ways to ingest, transform, and load data efficiently. Consolidate sources into semantic models; use Direct Lake for performance; Plan and design data model to comply with star schema supported by Power BI Relationship DAX USERELATIONSHIP DAX for activating relationships in Power BI for a specific calculation Calculations LOD, window functions Data Analysis Expressions (DAX) for measures and calculated columns. Copilot to assist with complex DAX. Fabric IQ Ontology for semantic alignment. Change how visuals interact in a Power BI report. Centralize calculations in semantic layer; use variables in DAX for readability and performance. Fabric Data Agent for a conversational BI. Very Complex Complexity Level Category Tableau Feature Power BI Equivalent Fabric Enhancements Best Practice Notes Data Model Multi-source, Excel, SQL Composite Models in Power BI (DirectQuery + Import) for combining multiple sources, also connect to various cloud services. Dataflows for pre-processing. OneLake Shortcuts for unified access; Connector overview build-in support. Mirroring for real-time sync. Combine multiple sources into well-structured semantic models for consistency and optimized performance. Calculations Predictive logic Data Analysis Expressions (DAX) for measures and calculated columns. Fabric AutoML, ML models, AI Insights, Python/R, Notebook‑based ML (Spark/Scikit‑Learn), Fabric AI Functions, Fabric IQ Ontology Fabric Data Agent for a conversational BI. Centralize logic in semantic models; leverage Copilot for automation and parameter-driven workflows. Prepare for Copilot. 2. Tableau Feature Equivalents Tableau Feature Power BI Equivalent Microsoft Learn Link Calculated Fields DAX Measures DAX Documentation Parameters Field Parameters / Bookmarks Use report readers to change visuals Actions Drillthrough / Bookmarks Drillthrough Tableau Prep Power Query / Dataflows Differences between Dataflow Gen1 and Dataflow Gen2 Tableau Server Power BI Service What is Power BI? Overview of Components and Benefits Phase 4: Governance and Deployment Workspace Planning (Dev / Test / Prod Separation) A proper workspace strategy is essential for governed deployments in Fabric and Power BI. Fabric supports separate Development, Test, and Production stages using Deployment Pipelines, enabling controlled promotions of semantic models, reports, dataflows, notebooks, lakehouses, and other items. You can assign each workspace to a pipeline stage (Dev → Test → Prod) to ensure safe lifecycle management. Sensitivity Labeling (Microsoft Purview Information Protection) Sensitivity labels allow governed classification and protection of data across Fabric items. Sensitivity labels can be applied directly to Fabric items (semantic models, reports, dataflows, etc.) through the item's header flyout or the item settings. Labels from Microsoft Purview Information Protection enforce data access rules and help organizations meet compliance requirements. Endorsement & Certification (Promoted, Certified, Master Data) Endorsement improves discoverability and trust in shared organizational content. Promoted: Item creators mark content as recommended for broader use. Certified: Administrators or authorized reviewers validate content meets organizational quality standards. Master Data: Indicates authoritative single‑source‑of‑truth items such as semantic models or lakehouses. All Fabric items except dashboards can be promoted or certified; data‑containing items can be designated as Master Data. Monitoring & Capacity Planning Determine the appropriate size for fabric capacity when migrating from Tableau to PowerBI. The Fabric SKU Estimator can generate a SKU recommendation (estimate) for your capacity requirements. Ensuring performance and cost efficiency requires ongoing monitoring of your Fabric capacity. Microsoft recommends evaluating workloads using Fabric Capacity Metrics and planning SKU sizes based on real usage. Fabric uses bursting and smoothing to handle spikes while enforcing capacity limits. Monitoring helps identify high compute usage, background refreshes, and interactive workloads to optimize performance. Fabric Data Source Connections (OneLake+ Manage Connections) Microsoft Fabric is designed as an end‑to‑end analytics platform that integrates data from many different source systems into a unified environment powered by OneLake, Data Factory, Real‑Time Analytics, Dataflows , Lakehouses, Warehouses, and Mirrored Databases. The Strategic Advantage: Semantic Layer + Fabric IQ The semantic layer-first approach sets the foundation for the next evolution in enterprise analytics. Fabric IQ (announced at Ignite 2025) is Microsoft's semantic intelligence platform that auto-elevates semantic models into ontologies—structured knowledge graphs that power AI agents, Copilot experiences, and cross-domain data reasoning. What this means for your migration: Semantic models you build today become the foundation for AI-driven analytics tomorrow Data Agents can reason across multiple semantic models, answering questions that span domains Business users transition from "report consumers" to "data explorers" via natural language interfaces Conclusion: Build for the Future, Not Just for Today Migrating from Tableau to Power BI is more than a technology swap—it's an opportunity to re-architect your analytics strategy for the cloud-native, AI-powered era. The semantic layer-first approach requires upfront investment in data modeling, DAX expertise, and Fabric platform adoption. But the payoff is transformative: Consistency: Single source of truth for all business metrics Scalability: Semantic models that serve hundreds of reports and thousands of users Agility: Changes to business logic propagate instantly across the enterprise Future-readiness: Foundation for Fabric IQ, Data Agents, and AI-driven insights Start your migration with the end in mind: not just convert dashboards, but a modern, governed, AI-ready analytics platform that scales with your business. Addressing Key Migration Concerns (1) Why a semantic‑layered model approach is better than recreating Tableau dashboards A semantic‑layered modeling approach is the optimal strategy for migration and is significantly more effective than attempting to recreate Tableau dashboards exactly as they exist. By contrast, Power BI and Fabric encourage a semantic model–first architecture, where all business rules, relationships, calculations, and transformations are centralized in a governed model that serves many dashboards. The approach not only provides consistency and reuse across the enterprise but also ensures that report authors build on a single certified version of the truth. (2) How semantic-layered model approach reduces the constant redesign caused by changing data needs. A semantic‑layered modeling approach directly addresses concern about constant changes and frequent redesigns of dashboards when data evolves. With a semantic layer, changes are absorbed in the model layer—so the logic is updated once and flows automatically into all dependent reports. Combined with Fabric features like OneLake shortcuts, Direct Lake mode, and centralized governance, the semantic layer drastically reduces breakage, minimizes rework, and ensures scalability as data continues to grow and shift. Additional Resources Direct Lake in Microsoft Fabric Create Fabric Data Agents OneLake Shortcuts Write DAX queries with Copilot - DAX Prepare Your Data for AI - Power BI | Microsoft Learn5KViews4likes3Comments