log data
228 Topics
Sentinel - Defender for Cloud P2 Benefit
Hi all, To receive the the benefit of the Sentinel / Defender for Cloud P2 500mb benefit is the following correct: Enabled Defender for Cloud P2 on the server or via Azure Arc (these are mainly on-prem servers. Create a DCR rule to collect events and send to our Sentinel Workspace. Enable Defender on the Sentinel workspace (not subscription) Defender for Servers is far more work than it should be!49Views0likes2Comments
SentinelHealth: Scheduled Rule Retry Logging Does Not Match Docs
## Objective I am working on a health checks architecture for Microsoft Sentinel analytic rules. The goal is to build a set of monitoring queries/approaches that cover rule execution failures, configuration issues (entity mapping, partial success), rule audit tracking, and auto-disabled rule detection. ## My Current Approach So far I have built monitoring for the following areas using the SentinelHealth and SentinelAudit tables: - Scheduled rule window failures (retry exhaustion) - NRT rule execution delays (cumulative delay over 25 minutes) - Partial success and configuration issues (entity mapping drops, alert size limits, semantic errors) with transient error codes filtered out - Auto-disabled rules detection - Rule disable/delete audit tracking via SentinelAudit + AzActivity ## The Issue: Scheduled Rule Retry Logging The documentation at https://learn.microsoft.com/en-us/azure/sentinel/monitor-analytics-rule-integrity#scheduled-rules states that when a scheduled rule fails, it is retried 5 more times on the same window (6 total attempts). It also provides this query to detect completely skipped windows: ```kql _SentinelHealth() | where SentinelResourceType == @"Analytics Rule" | where SentinelResourceKind == "Scheduled" | where Status != "Success" | extend startTime = tostring(ExtendedProperties["QueryStartTimeUTC"]) | summarize failuresByStartTime = count() by startTime, SentinelResourceId | where failuresByStartTime == 6 | summarize count() by SentinelResourceId ``` This query assumes that each retry attempt is logged as a separate event in SentinelHealth, all sharing the same QueryStartTimeUTC. You would then count 6 failure records per startTime to identify a fully skipped window. However, in practice I am seeing different behavior. I ran a diagnostic query with a 90-day lookback (480 non-success events total, 73 unique rules). Every single event had a count of 1 per unique (SentinelResourceName, startTime) combination. No grouping of retries was observed at all. I then found an actual failed-window event that confirms this. Here is the record: - Rule: Port scan detected (ASIM Network Session schema) - Status: Failure - Description: "Rule's scheduled run at 06/01/2026 10:43:55 failed after numerous attempts. It will be re-executed over the next scheduled time." - Issue Code: SemanticErrorInQuery - Only 1 SentinelHealth record exists for this failed window The Description field says "failed after numerous attempts" which indicates the retries happened internally, but only one consolidated Failure event was written to SentinelHealth after all retries were exhausted. The individual retry attempts do not appear as separate records. This means the failuresByStartTime == 6 query from the documentation would never match this pattern, because there is only 1 record per failed window, not 6. ## Why This Matters Yes, completely skipped windows are rare. In my 90-day dataset most failures were permanent types (SemanticErrorInQuery, QueryGeneralError) that would not benefit from retries anyway. But they still happen, and if a tenant experiences a transient issue that causes a higher rate of failed windows, the documented query would silently return nothing. For my health checks I have rewritten the detection to simply look for Status == "Failure" with Description containing "failed after numerous attempts" which matches the actual consolidated event Sentinel writes. ## Questions Is the documented failuresByStartTime == 6 query still accurate? Or has the retry logging behavior changed to write a single consolidated event per failed window? Are there specific failure types or conditions where individual retries are logged as separate events? Perhaps transient failures behave differently from permanent ones in this regard? For anyone else building health monitoring on SentinelHealth - am I missing any important use cases beyond what I described above? Any clarification would be appreciated.79Views0likes1Comment
XdrLogRaider Defender XDR portal telemetry
A Microsoft Sentinel custom data connector that ingests Microsoft Defender XDR portal-only telemetry — configuration, compliance, drift, exposure, governance — that public Microsoft APIs (Graph Security, Microsoft 365 Defender, MDE) don't expose. https://github.com/akefallonitis/xdrlograider— Defender XDR portal telemetry Happy Hunting 🥳 🎉120Views0likes2CommentsSentinel Foundry - MCP Server (Preview) (Github Community Release)
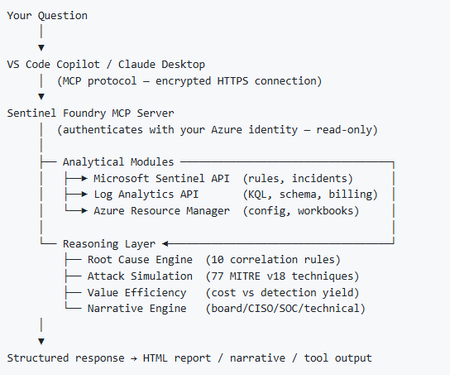
I’ve been cooking something that a lot of people in SOC have been struggling with — especially on the engineering side of Microsoft Sentinel. Thanks to the Microsoft Security team for shaping the capabilities of Sentinel even better with Sentinel Data Lake & Modern SecOps. Today’s the day I can finally share it. Note: This is not an official Microsoft product, but it is designed to make the Sentinel Build even better (complement) with much more intelligence. 🚀 Sentinel Foundry is now in public preview with 43 tools. (Sentinel Foundry - MCP Server) It’s an MCP server built to act like the brain of a strong Sentinel engineer — helping make building, improving, and operating Sentinel far more practical, faster, and honestly more enjoyable. For a lot of teams, the challenge is not understanding what Sentinel can do. The hard part is the engineering work around it: -> Deciding what data should actually be ingested -> Building a clean, scalable Sentinel foundation -> Writing useful detections instead of noisy ones -> Balancing security value with cost -> Turning ideas into deployable engineering outputs That is exactly why I built Sentinel Foundry to help communities grow stronger. It helps with the real engineering tasks behind Sentinel — from architecture thinking to detection design, deployment planning, ingestion strategy, automation ideas, and many of the workflows outlined in the GitHub project. How does it work? Here’s one of the flagship prompts I ran with it: “Give me a complete security posture report for our workspace. Score each pillar and tell me what to prioritise.” And within seconds, it produced a structured engineering blueprint that would normally take a lot longer to pull together manually. You can see the example prompts here in what it can do: https://github.com/prabhukiranveesam/Sentinel-Foundry#what-can-it-do I want building Sentinel to feel less like repetitive engineering overhead — and more like real security engineering that is fast, creative, and enjoyable. If you work with Sentinel as a SOC L2 analyst, engineer, detection engineer, consultant, or architect, I’d genuinely love for you to try it and tell me what you think. 🔗 Public Preview: https://github.com/prabhukiranveesam/Sentinel-Foundry This is just the start of an AI era — and I’m excited to keep shaping it with more powerful features over the coming days. This is very easy to set up and will be available to all of you at no cost during this month as part of the public preview, and your feedback is extremely valuable to shape this as a powerful solution.631Views0likes1CommentSentinel datalake: private link/private endpoint
Has anyone already configured Sentinel Datalake with a private link/private endpoint setup? I can't find any instructions for this specific case. Can I use the wizard in the Defender XDR portal, or does it require specific configuration steps? Or does it require configuring a private link/private endpoint setup on the Datalake component after activation via the wizard?205Views0likes2CommentsRSAC 2026: What the Sentinel Playbook Generator actually means for SOC automation
RSAC 2026 brought a wave of Sentinel announcements, but the one I keep coming back to is the playbook generator. Not because it's the flashiest, but because it touches something that's been a real operational pain point for years: the gap between what SOC teams need to automate and what they can realistically build and maintain. I want to unpack what this actually changes from an operational perspective, because I think the implications go further than "you can now vibe-code a playbook." The problem it solves If you've built and maintained Logic Apps playbooks in Sentinel at any scale, you know the friction. You need a connector for every integration. If there isn't one, you're writing custom HTTP actions with authentication handling, pagination, error handling - all inside a visual designer that wasn't built for complex branching logic. Debugging is painful. Version control is an afterthought. And when something breaks at 2am, the person on call needs to understand both the Logic Apps runtime AND the security workflow to fix it. The result in most environments I've seen: teams build a handful of playbooks for the obvious use cases (isolate host, disable account, post to Teams) and then stop. The long tail of automation - the enrichment workflows, the cross-tool correlation, the conditional response chains - stays manual because building it is too expensive relative to the time saved. What's actually different now The playbook generator produces Python. Not Logic Apps JSON, not ARM templates - actual Python code with documentation and a visual flowchart. You describe the workflow in natural language, the system proposes a plan, asks clarifying questions, and then generates the code once you approve. The Integration Profile concept is where this gets interesting. Instead of relying on predefined connectors, you define a base URL, auth method, and credentials for any service - and the generator creates dynamic API calls against it. This means you can automate against ServiceNow, Jira, Slack, your internal CMDB, or any REST API without waiting for Microsoft or a partner to ship a connector. The embedded VS Code experience with plan mode and act mode is a deliberate design choice. Plan mode lets you iterate on the workflow before any code is generated. Act mode produces the implementation. You can then validate against real alerts and refine through conversation or direct code edits. This is a meaningful improvement over the "deploy and pray" cycle most of us have with Logic Apps. Where I see the real impact For environments running Sentinel at scale, the playbook generator could unlock the automation long tail I mentioned above. The workflows that were never worth the Logic Apps development effort might now be worth a 15-minute conversation with the generator. Think: enrichment chains that pull context from three different tools before deciding on a response path, or conditional escalation workflows that factor in asset criticality, time of day, and analyst availability. There's also an interesting angle for teams that operate across Microsoft and non-Microsoft tooling. If your SOC uses Sentinel for SIEM but has Palo Alto, CrowdStrike, or other vendors in the stack, the Integration Profile approach means you can build cross-vendor response playbooks without middleware. The questions I'd genuinely like to hear about A few things that aren't clear from the documentation and that I think matter for production use: Security Copilot dependency: The prerequisites require a Security Copilot workspace with EU or US capacity. Someone in the blog comments already flagged this as a potential blocker for organizations that have Sentinel but not Security Copilot. Is this a hard requirement going forward, or will there be a path for Sentinel-only customers? Code lifecycle management: The generated Python runs... where exactly? What's the execution runtime? How do you version control, test, and promote these playbooks across dev/staging/prod? Logic Apps had ARM templates and CI/CD patterns. What's the equivalent here? Integration Profile security: You're storing credentials for potentially every tool in your security stack inside these profiles. What's the credential storage model? Is this backed by Key Vault? How do you rotate credentials without breaking running playbooks? Debugging in production: When a generated playbook fails at 2am, what does the troubleshooting experience look like? Do you get structured logs, execution traces, retry telemetry? Or are you reading Python stack traces? Coexistence with Logic Apps: Most environments won't rip and replace overnight. What's the intended coexistence model between generated Python playbooks and existing Logic Apps automation rules? I'm genuinely optimistic about this direction. Moving from a low-code visual designer to an AI-assisted coding model with transparent, editable output feels like the right architectural bet for where SOC automation needs to go. But the operational details around lifecycle, security, and debugging will determine whether this becomes a production staple or stays a demo-only feature. Would be interested to hear from anyone who's been in the preview - what's the reality like compared to the pitch?Solved231Views0likes1Comment
Ingest Microsoft XDR Advanced Hunting Data into Microsoft Sentinel
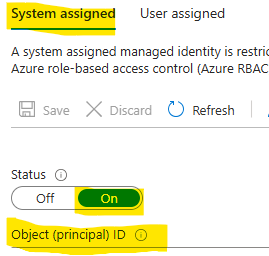
I had difficulty finding a guide that can query Microsoft Defender vulnerability management Advanced Hunting tables in Microsoft Sentinel for alerting and automation. As a result, I put together this guide to demonstrate how to ingest Microsoft XDR Advanced Hunting query results into Microsoft Sentinel using Azure Logic Apps and System‑Assigned Managed Identity. The solution allows you to: Run Advanced Hunting queries on a schedule Collect high‑risk vulnerability data (or other hunting results) Send the results to a Sentinel workspace as custom logs Create alerts and automation rules based on this data This approach avoids credential storage and follows least privilege and managed identity best practices. Prerequisites Before you begin, ensure you have: Microsoft Defender XDR access Microsoft Sentinel deployed Azure Logic Apps permission Application Administrator or higher in Microsoft Entra ID PowerShell with Az modules installed Contributor access to the Sentinel workspace Architecture at a Glance Logic App (Managed Identity) ↓ Microsoft XDR Advanced Hunting API ↓ Logic App ↓ Log Analytics Data Collector API ↓ Microsoft Sentinel (Custom Log) Step 1: Create a Logic App In the Azure Portal, go to Logic Apps Create a new Consumption Logic App Choose the appropriate: Subscription Resource Group Region Step 2: Enable System‑Assigned Managed Identity Open the Logic App Navigate to Settings → Identity Enable System‑assigned managed identity Click Save Note the Object ID This identity will later be granted permission to run Advanced Hunting queries. Step 3: Locate the Logic App in Entra ID Go to Microsoft Entra ID → Enterprise Applications Change filter to All Applications Search for your Logic App name Select the app to confirm it exists Step 4: Grant Advanced Hunting Permissions (PowerShell) Advanced Hunting permissions cannot be assigned via the portal and must be done using PowerShell. Required Permission AdvancedQuery.Read.All PowerShell Script # Your tenant ID (in the Azure portal, under Azure Active Directory > Overview). $TenantID=”Your TenantID” Connect-AzAccount -TenantId $TenantID # Get the ID of the managed identity for the app. $spID = “Your Managed Identity” # Get the service principal for Microsoft Graph by providing the AppID of WindowsDefender ATP $GraphServicePrincipal = Get-AzADServicePrincipal -Filter "AppId eq 'fc780465-2017-40d4-a0c5-307022471b92'" | Select-Object Id # Extract the Advanced query ID. $AppRole = $GraphServicePrincipal.AppRole | ` Where-Object {$_.Value -contains "AdvancedQuery.Read.All"} # If AppRoleID comes up with blank value, it can be replaced with 93489bf5-0fbc-4f2d-b901-33f2fe08ff05 # Now add the permission to the app to read the advanced queries New-AzADServicePrincipalAppRoleAssignment -ServicePrincipalId $spID -ResourceId $GraphServicePrincipal.Id -AppRoleId $AppRole.Id # Or New-AzADServicePrincipalAppRoleAssignment -ServicePrincipalId $spID -ResourceId $GraphServicePrincipal.Id -AppRoleId 93489bf5-0fbc-4f2d-b901-33f2fe08ff05 After successful execution, verify the permission under Enterprise Applications → Permissions. Step 5: Build the Logic App Workflow Open Logic App Designer and create the following flow: Trigger Recurrence (e.g., every 24 hours Run Advanced Hunting Query Connector: Microsoft Defender ATP Authentication: System‑Assigned Managed Identity Action: Run Advanced Hunting Query Sample KQL Query (High‑Risk Vulnerabilities) Send Data to Log Analytics (Sentinel) On Send Data, create a new connection and provide the workspace information where the Sentinel log exists. Obtaining the Workspace Key is not straightforward, we need to retrieve using the PowerShell command. Get-AzOperationalInsightsWorkspaceSharedKey ` -ResourceGroupName "<ResourceGroupName>" ` -Name "<WorkspaceName>" Configuration Details Workspace ID Primary key Log Type (example): XDRVulnerability_CL Request body: Results array from Advanced Hunting Step 6: Run the Logic app to return results In the logic app designer select run, If the run is successful data will be sent to sentinel workspace. Step 7: Validate Data in Microsoft Sentinel In Sentinel, run the query: XDRVulnerability_CL | where TimeGenerated > ago(24h) If data appears, ingestion is successful. Step 8: Create Alerts & Automation Rules Use Sentinel to: Create analytics rules for: CVSS > 9 Exploit available New vulnerabilities in last 24 hours Trigger: Email notifications Incident creation SOAR playbooks Conclusion By combining Logic Apps, Managed Identities, Microsoft XDR, and Microsoft Sentinel, you can create a powerful, secure, and scalable pipeline for ingesting hunting intelligence and triggering proactive detections.288Views1like1CommentMcasShadowItReporting / Cloud Discovery in Azure Sentinel
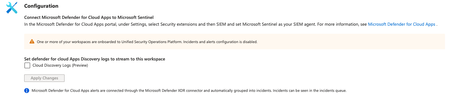
Hi! I´m trying to Query the McasShadowItReporting Table, for Cloud App DISCOVERYs The Table is empty at the moment, the connector is warning me that the Workspace is onboarded to Unified Security Operations Platform So I cant activate it here I cant mange it via https://security.microsoft.com/, too The Documentation ( https://learn.microsoft.com/en-us/defender-cloud-apps/siem-sentinel#integrating-with-microsoft-sentinel ) Leads me to the SIEM Integration, which is configured for (for a while) I wonder if something is misconfigured here and why there is no log ingress / how I can query them312Views0likes1Comment
CrowdStrike API Data Connector (via Codeless Connector Framework) (Preview)
API scopes created. Added to Connector however only streams observed are from Alerts and Hosts. Detections is not logging? Anyone experiencing this issue? Github has post about it apears to be escalated for feature request. CrowdStrikeDetections. not ingested Anyone have this setup and working?688Views0likes2Comments