kql
3 Topics
At-Scale Failure Reporting for Azure Update Manager
Introduction Azure Update Manager simplifies patching across Azure virtual machines and Azure Arc-enabled servers by providing a centralized platform for patch assessment and installation. However, as environments scale, a key challenge emerges—efficiently identifying and troubleshooting patch failures across large fleets of machines. While Azure Update Manager surfaces detailed error messages in the Azure portal, this information is typically available only at an individual machine level. In enterprise environments managing hundreds or thousands of systems, drilling into each VM to find error details quickly becomes impractical. In this article, we walk through a real-world use case and demonstrate how to leverage Azure Resource Graph (ARG) to extract failed machines along with their error details for a specific maintenance run—using a single query. The Challenge: Scaling Patch Failure Visibility In a large enterprise deployment, Azure Update Manager was configured to manage patching across: Windows and Linux virtual machines Azure cloud VMs and Arc-enabled on‑premises servers Multiple regions and subscriptions While patching operations were largely successful, a subset of machines experienced failures. The key challenges faced by the operations team were: Error messages were visible only by drilling into each failed VM in the portal No built‑in way to aggregate failures across all machines Lack of a simple mechanism to export: Failed VMs Error codes Error messages The team needed a scalable, query‑driven approach to analyze failures across an entire maintenance run. Key Insight: Where Azure Update Manager Stores Data Azure Update Manager does not rely on Log Analytics to store operational results. Instead: Patch assessment and installation results are stored in Azure Resource Graph Azure Resource Graph acts as a centralized, queryable store for update operations This design enables powerful querying without requiring additional ingestion, configuration, or cost overhead. Understanding Maintenance Runs and Correlation IDs Each Azure Update Manager maintenance run generates a unique identifier: properties.correlationId represents the maintenance (schedule) run ID All machines involved in the same patch cycle share this ID This allows all machines within a single patch execution to be correlated and queried collectively. The Solution: Query Failed VMs with Error Messages Azure Resource Graph allows querying failures at scale using the maintenanceresources dataset. Core Query (Kusto Query Language) 1 maintenanceresources 2 | where type =~ "microsoft.maintenance/applyupdates" 3 | where tostring(properties.correlationId) contains "<YourMaintenanceRunID>" 4 | where tostring(properties.status) =~ "Failed" 5 | project properties.resourceId, properties.errorCode, properties.errorMessage What This Query Delivers All machines that failed in a specific maintenance run Error codes for troubleshooting Full error messages that are otherwise visible only in the Azure portal Note: Property names for error information can vary by environment. Validate available fields using Azure Resource Graph Explorer and adjust the project clause if required. Sample Output (Conceptual) Resource ID Error Code Error Message vm-01 0x80244007 Windows Update API failed vm-02 0x80072f8f Connectivity issue vm-03 1C WSUS configuration issue Advanced Scenario: Automatically Detecting the Latest Failed Maintenance Run In real-world scenarios, you may not always know the maintenance run ID. The following query dynamically identifies the most recent maintenance run that had failures, and then retrieves all failed machines from that run. 1 // Step 1: Identify the latest maintenance run ID with failures 2 let lastFailedRun = toscalar( 3 maintenanceresources 4 | extend runId = extract(@"applyupdates/(\d+)$", 1, properties.correlationId) 5 | where type =~ "microsoft.maintenance/applyupdates" 6 | where tostring(properties.status) =~ "Failed" 7 | order by tostring(properties.startDateTime) desc 8 | take 1 9 | project runId 10 ); 11 // Step 2: Query all failed VMs from that run 12 maintenanceresources 13 | where type =~ "microsoft.maintenance/applyupdates" 14 | where tostring(properties.correlationId) contains lastFailedRun 15 | where tostring(properties.status) =~ "Failed" 16 | project properties.resourceId, properties.errorCode, properties.errorMessage This approach is ideal for automation, scheduled reporting, and dashboard scenarios. Why This Approach Matters Operational Efficiency Eliminates manual portal navigation Provides consolidated failure insights in seconds Scalability Works across large, distributed environments Supports both Azure and hybrid (Arc‑enabled) machines Automation Ready Can be integrated into scripts, dashboards, and reporting pipelines Enables proactive monitoring and alerting scenarios Best Practices for Enterprise Patch Reporting To maximize the value of this approach: Capture and track maintenance run IDs Use Azure Resource Graph as the primary reporting layer Build reusable queries for different patch scenarios Export reports for compliance and auditing Correlate failures with root‑cause trends over time Conclusion As organizations scale patching operations with Azure Update Manager, visibility, speed, and automation become essential. While the Azure portal is effective for per‑machine troubleshooting, it is not optimized for fleet‑level analysis. Azure Resource Graph fills this gap by enabling a shift from manual troubleshooting to automated, query‑driven failure analysis at scale. By adopting this approach, teams can significantly improve operational efficiency, reduce mean time to resolution, and build a more mature patch management strategy. Final takeaway: Don’t rely only on the portal Leverage Azure Resource Graph to operationalize patch insights at enterprise scale References Azure Update Manager – Query resources with Azure Resource Graph https://learn.microsoft.com/azure/update-manager/query-logs Azure Update Manager – Troubleshooting guide https://learn.microsoft.com/azure/update-manager/troubleshoot Sample Azure Resource Graph queries for Azure Update Manager https://github.com/MicrosoftDocs/azure-docs/blob/main/articles/update-manager/sample-query-logs.md
Optimizing Microsoft Sentinel: Resolving AMA-Induced Syslog & CEF Duplicates
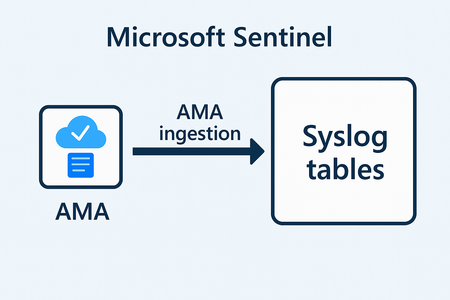
2) Recommended Solutions When collecting both Syslog and CEF logs from the same Linux collector using the Azure Monitor Agent (AMA) in Microsoft Sentinel, duplicate log entries can occur. These duplicates arise because the same event may be ingested through both the Syslog and CEF pipelines, leading to redundancy in the Log Analytics Workspace (LAW). The following solutions aim to eliminate or reduce duplicate log ingestion, ensuring that: CEF events are parsed correctly and only once. Syslog data remains clean and non-redundant. Storage and analytics efficiency is improved. Alerting and incident investigation are not skewed by duplicate entries. Each option provides a different strategy based on your environment’s flexibility and configuration capabilities—from facility-level separation, to ingestion-time filtering, to daemon-side log routing. Option 1: Facility Separation (Preferred) Configure devices to emit CEF logs on a dedicated facility (for example, 'local4'), and adjust the Data Collection Rules (DCRs) so that the CEF stream includes only that facility, while the Syslog stream excludes it. This ensures CEF events are parsed once into 'CommonSecurityLog' and never land in 'Syslog'. CEF via AMA DCR (include only CEF facility): { "properties": { "dataSources": { "syslog": [ { "streams": ["Microsoft-CommonSecurityLog"], "facilityNames": ["local4"], "logLevels": ["*"], "name": "cefDataSource" } ] }, "dataFlows": [ { "streams": ["Microsoft-CommonSecurityLog"], "destinations": ["laDest"] } ] } } Syslog via AMA DCR (exclude CEF facility): { "properties": { "dataSources": { "syslog": [ { "streams": ["Microsoft-Syslog"], "facilityNames": [ "auth","authpriv","cron","daemon","kern","mail", "syslog","user","local0","local1","local2","local3", "local5","local6","local7" ], "logLevels": ["*"], "name": "syslogDataSource" } ] }, "dataFlows": [ { "streams": ["Microsoft-Syslog"], "destinations": ["laDest"] } ] } } Option 2: Ingest-time Transform (Drop CEF from Syslog) If facility separation is not feasible, apply a transformation to the Syslog stream in the DCR so that any CEF-formatted messages are dropped during ingestion. Syslog stream transformKql: { "properties": { "dataFlows": [ { "streams": ["Microsoft-Syslog"], "transformKql": "source | where not(SyslogMessage startswith 'CEF:')", "destinations": ["laDest"] } ] } } Option 3: Daemon-side Filtering/Rewriting (rsyslog/syslog-ng) Filter or rewrite CEF messages before AMA sees them. For example, route CEF messages to a dedicated facility using syslog-ng and stop further processing: # Match CEF filter f_cef { message("^CEF:"); }; # Send CEF to local5 and stop further processing log { source(s_src); filter(f_cef); rewrite { set_facility(local5); }; destination(d_azure_mdsd); flags(final); } 3) Verification Steps with KQL Queries Detect CEF messages that leaked into Syslog: Syslog | where TimeGenerated > ago(1d) | where SyslogMessage startswith "CEF:" | summarize count() by Computer | order by count_ desc Estimate duplicate count across Syslog and CommonSecurityLog: let sys = Syslog | where TimeGenerated > ago(1d) | where SyslogMessage startswith "CEF:" | extend key = hash_sha256(SyslogMessage); let cef = CommonSecurityLog | where TimeGenerated > ago(1d) | extend key = hash_sha256(RawEvent); cef | join kind=innerunique (sys) on key | summarize duplicates = count() Note : You should identify the RawEvent that might be causing the duplicates. 3.1) Duplicate Detection Query Explained This query helps quantify duplicate ingestion when both Syslog and CEF connectors ingest the same events. It works as follows: Build the Syslog set (sys): Filter the 'Syslog' table for the last day and keep only messages that start with 'CEF:'. Compute a SHA-256 hash of the entire message as a stable join key ("key"). Build the CEF set (cef): Filter the 'CommonSecurityLog' table for the last day and compute a SHA-256 hash of the 'RawEvent' field as the same-style join key. Join on the key: Use 'join kind=innerunique' to find messages that exist in both sets (i.e., duplicates). Summarize: Count the number of matching rows to get a duplicate total. 4) Common Pitfalls - Overlapping DCRs applied to the same collector VM causing overlapping facilities/severities. - CEF and Syslog using the same facility on sources, leading to ingestion on both streams. - rsyslog/syslog-ng filters placed after AMA’s own configuration include (ensure your custom rules run before '10-azuremonitoragent.conf'). 5) References - Microsoft Learn: Ingest syslog and CEF messages to Microsoft Sentinel with AMA (https://learn.microsoft.com/en-us/azure/sentinel/connect-cef-syslog-ama)