hyperscale
45 TopicsDatabase Hub in Fabric: Now in Public Preview -Turn Database Signals into Guided Action
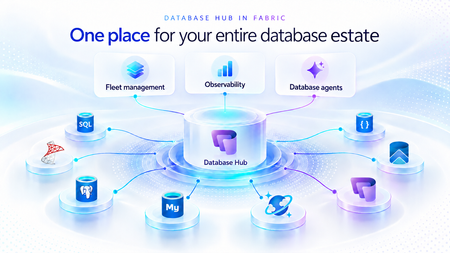
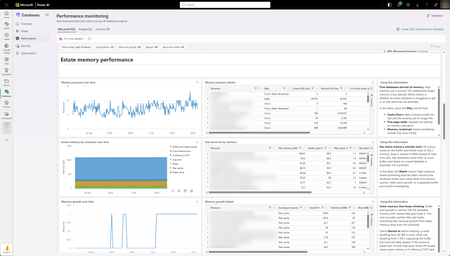
As applications grow, so does the database estate behind them. What starts with a handful of databases can become hundreds or thousands of resources spread across services, subscriptions, and environments. For the teams responsible for keeping them healthy, the challenge is no longer just collecting signals. It is knowing what needs attention, why it matters, and what to do next. Now in public preview, Database Hub in Microsoft Fabric brings inventory, health, performance, security, and optimization insights into one connected experience. It helps administrators and developers see the bigger picture, identify affected resources, and move from estate-wide visibility to focused investigation, without losing the context that brought them there. The preview brings together supported resources across Azure SQL Database, SQL Server enabled by Azure Arc, Azure Database for PostgreSQL, Azure Cosmos DB, and SQL database in Fabric. Available capabilities and signals vary by service and preview configuration. Database Hub Overview brings together estate-wide findings and cross-engine performance trends to help you prioritize what needs attention. Start with what needs your attention When you manage a large database estate, another dashboard is only useful if it helps you decide where to spend your time. The Overview page provides that starting point, bringing together findings across security, performance, and optimization. It distinguishes Issues, which require timely attention, from Suggestions, which highlight opportunities to improve your estate over time. You might begin with a security configuration that needs review or a performance signal that warrants investigation. Selecting a finding opens Estate with the relevant filters already applied, so you can see the affected resources rather than search for them again. The result is a more direct path from “something needs attention” to “these are the resources I should investigate.” Overview highlights issues across Security, Performance, and Optimization, with affected-resource counts and direct links to investigate further. Bring your estate into one view, and make it relevant to you The Estate experience brings supported resources into a unified inventory, scoped to your existing permissions. Search and filters help you narrow that inventory to the service, subscription, or resource group you manage. This is especially useful when your responsibilities span database engines. You can begin with a broader view, then focus on Azure SQL databases, Arc-enabled SQL Server resources, or Azure Database for PostgreSQL flexible servers without rebuilding the resource list in separate portals. Each resource brings its associated Issues and Suggestions into context. Open a finding to review the affected resource, supporting information, and recommended next step. The inventory also respects the resource model of each service. For example, the PostgreSQL view represents flexible server instances, rather than every database hosted within them. A unified view does not mean moving your databases. Your Azure resources remain in their existing subscriptions, and on-premises SQL Server instances remain on-premises, connected through Azure Arc. Database Hub brings operational context together; it does not require relocating or mirroring your application data into Fabric. Estate brings resource inventory, Issues, and Suggestions into one view, with quick actions to continue investigation in the Azure portal, VS Code, or SSMS. Understand security posture and performance in context Database Hub helps you identify configurations worth reviewing and resources that need a closer look. For security, supported signals can include Microsoft Entra authentication, customer-managed keys, and auditing coverage, depending on the database service. These findings provide a starting point for investigation, not a blanket judgment that every flagged resource is insecure or noncompliant. For example, a suggestion to review customer-managed keys should be evaluated against your organization’s requirements. A resource using service-managed keys is still encrypted at rest. For performance, built-in dashboards bring supported utilization and activity signals into view, including CPU, memory, storage, I/O, and connections. Review trends across your estate, then narrow the scope and time range to investigate individual resources. Metric availability varies by engine and monitoring configuration; missing data should not be interpreted as good health. For supported SQL monitoring scenarios, you can also create a custom monitoring dashboard from a template and tailor its charts and layout to the resources your team follows regularly. Together, these experiences help answer two practical questions: Where is pressure building, and where is there an opportunity to improve? Performance summaries highlight recent capacity signals and trends across Microsoft SQL, PostgreSQL, and Cosmos DB. The Security dashboard summarizes Microsoft Entra authentication, audit logging, and customer-managed key coverage, helping you identify configurations that warrant review across your estate. The Performance monitoring dashboard combines memory-pressure trends, resource-level details, and interpretation guidance to help focus your investigation. Move from a finding to an informed next step Estate-wide visibility is the beginning of an investigation, not a replacement for database expertise. When a finding needs deeper analysis, Database Hub helps you review the evidence and continue in the appropriate native experience, such as the Azure portal or SQL Server Management Studio (SSMS). Engine-specific diagnostics and configuration changes remain in the tools designed for that work. Consider a performance issue that occurred before an administrator could inspect it. In supported agent-assisted scenarios, captured incident evidence can help establish what happened, when it happened, and which queries or sessions were involved. That context gives the administrator a more informed starting point for investigation. The operator remains in control: review the evidence, evaluate the recommendation, and apply authorized changes through the appropriate service tools. The preview investigation workflow does not automatically remediate issues, and existing permissions and approval requirements continue to apply. Bring database expertise into agent-assisted workflows We are also making database operational intelligence available through agent skills: reusable capabilities that agents can call to support observability, monitoring, diagnostics, optimization, and other database operations. Database Hub provides estate context; skills provide a way to bring database expertise into an agent-assisted investigation. This creates a foundation for helping teams move from identifying an affected resource to understanding its signals and evaluating the next step. We’re building toward making this expertise available in the AI companions and development tools teams already use, with recommendations grounded in evidence, the specific database, and your organization’s operational controls. If we take a step back, our broader vision brings together a free, extensible Database Hub experience, agentic observability, and OneLake integration, all within Microsoft Fabric. It’s a foundation for connecting database operations with analytics and AI and helping teams turn signals into informed action. Get started with Database Hub Start with the Database Hub documentation to review preview availability, supported services, and setup requirements. Ask your Fabric administrator to enable the preview where required, confirm that you have the appropriate resource permissions, and complete any service-specific monitoring prerequisites. Then open Microsoft Fabric, select Databases in the left navigation, and begin with Overview. Choose a finding, explore the affected resources in Estate, and follow the evidence into your next investigation. For more details on supported services and getting set up, the Database Hub documentation is also available on Microsoft Learn. Learn more What is Database Hub in Fabric? Enable performance monitoring for Microsoft SQL Performance Monitoring for Azure SQL in Database Hub894Views5likes1Comment🔐 Public Preview: Backup Immutability for Azure SQL Database LTR Backups
The Ransomware Threat Landscape Ransomware attacks have become one of the most disruptive cybersecurity threats in recent years. These attacks typically follow a destructive pattern: Attackers gain unauthorized access to systems. They encrypt or delete critical data. They demand ransom in exchange for restoring access. Organizations without secure, tamper-proof backups are often left with no choice but to pay the ransom or suffer significant data loss. This is where immutable backups play a critical role in defense. 🛡️ What Is Backup Immutability? Backup immutability ensures that once a backup is created, it cannot be modified or deleted for a specified period. This guarantees: Protection against accidental or malicious deletion. Assurance that backups remain intact and trustworthy. Compliance with regulatory requirements for data retention and integrity. 🚀 Azure SQL Database LTR Backup Immutability (Public Preview) Microsoft has introduced backup immutability for Long-Term Retention (LTR) backups in Azure SQL Database, now available in public preview. This feature allows organizations to apply Write Once, Read Many (WORM) policies to LTR backups stored in Azure Blob Storage. Key Features: Time-based immutability: Locks backups for a defined duration (e.g., 30 days). Legal hold immutability: Retains backups indefinitely until a legal hold is explicitly removed. Tamper-proof storage: Backups cannot be deleted or altered, even by administrators. This ensures that LTR backups remain secure and recoverable, even in the event of a ransomware attack. 📜 Regulatory Requirements for Backup Immutability Many global regulations mandate immutable storage to ensure data integrity and auditability. Here are some key examples: Region Regulation Requirement USA SEC Rule 17a-4(f) Requires broker-dealers to store records in WORM-compliant systems. FINRA Mandates financial records be preserved in a non-rewriteable, non-erasable format. HIPAA Requires healthcare organizations to ensure the integrity and availability of electronic health records. EU GDPR Emphasizes data integrity and the ability to demonstrate compliance through audit trails. Global ISO 27001, PCI-DSS Require secure, tamper-proof data retention for audit and compliance purposes. Azure’s immutable storage capabilities help organizations meet these requirements by ensuring that backup data remains unchanged and verifiable. 🕒 Time-Based vs. Legal Hold Immutability ⏱️ Time-Based Immutability Locks data for a predefined period (e.g., 30 days). Ideal for routine compliance and operational recovery. Automatically expires after the retention period. 📌 Legal Hold Immutability Retains data indefinitely until the hold is explicitly removed. Used in legal investigations, audits, or regulatory inquiries. Overrides time-based policies to ensure data preservation. Both types can be applied to Azure SQL LTR backups, offering flexibility and compliance across different scenarios. 🧩 How Immutability Protects Against Ransomware Immutable backups are a critical component of a layered defense strategy: Tamper-proof: Even if attackers gain access, they cannot delete or encrypt immutable backups. Reliable recovery: Organizations can restore clean data from immutable backups without paying ransom. Compliance-ready: Meets regulatory requirements for data retention and integrity. By enabling immutability for Azure SQL LTR backups, organizations can significantly reduce the risk of data loss and ensure business continuity. ✅ Final Thoughts The public preview of backup immutability for Azure SQL Database LTR backups is a major step forward in ransomware resilience and regulatory compliance. With support for both time-based and legal hold immutability, Azure empowers organizations to: Protect critical data from tampering or deletion. Meet global compliance standards. Recover quickly and confidently from cyberattacks. Immutability is not just a feature—it’s a foundational pillar of modern data protection. Documentation is available at - Backup Immutability for Long-Term Retention Backups - Azure SQL Database | Microsoft Learn842Views4likes1Comment
Introducing the Azure SQL hub: A simpler, guided entry into Azure SQL
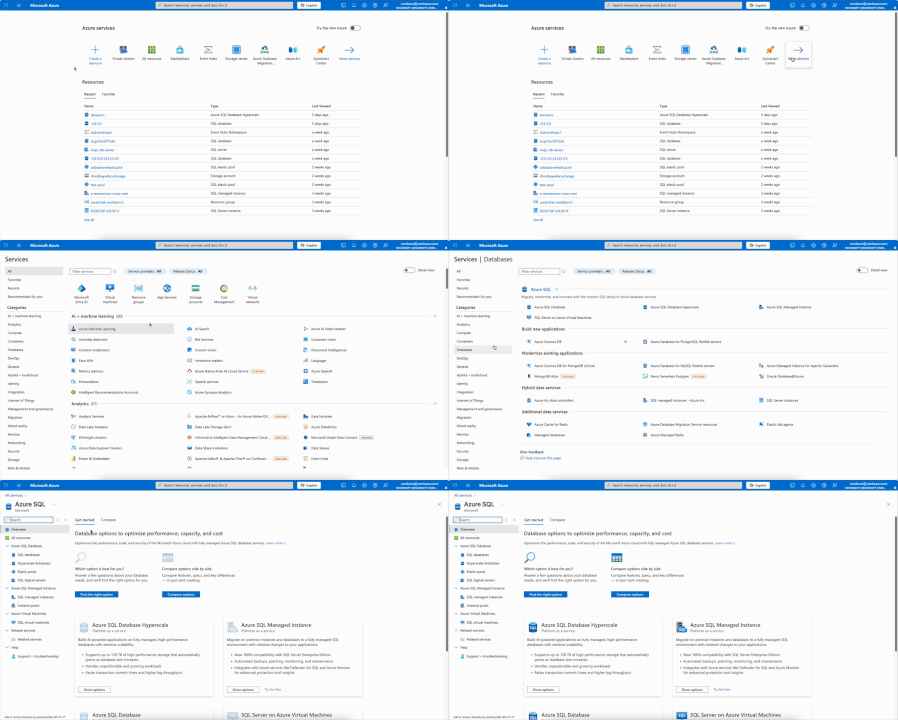
Choosing the right Azure SQL service can be challenging. To make this easier, we built the Azure SQL hub, a new home for everything related to Azure SQL in the Azure portal. Whether you’re new to Azure SQL or an experienced user, the hub helps you find the right service quickly and decide, without disrupting your existing workflows. For existing users: Your current workflows remain unchanged. The only visible update is a streamlined navigation pane where you access Azure SQL resources. For new users: Start from the Azure SQL hub home page. Get personalized recommendations by answering a few quick questions or chatting with Azure portal Copilot. Or compare services side by side and explore key resources, all without leaving the portal. This is one way to find it: Searching for "azure sql" in main search box or marketplace is also efficient way to get to Azure SQL hub Answer a few questions to get our recommendation and use Copilot to refine your requirements. Get a detailed side-by-side comparison without leaving the hub. Still deciding? Explore a selection of Azure SQL services for free. This option takes you straight to the resource creation page with a pre-applied free offer. Try the Azure SQL hub today in the Azure portal, and share your feedback in the comments!2.4KViews4likes1Comment
Public Preview: Performance monitoring for Azure SQL in Database Hub
We're excited to announce the public preview of performance monitoring for Azure SQL in Database Hub in Fabric. Performance monitoring brings the health and performance of your SQL estate into Database Hub. You see every supported database in one place and quickly spot the ones that need attention. It works across: Azure SQL Database Azure SQL Managed Instance (coming soon) SQL Server on Azure Virtual Machines SQL Server enabled by Azure Arc Microsoft collects performance-related telemetry, runs the pipeline, and stores the data for you. There's nothing you need to deploy and nothing to operate. Turn it on, and your SQL resources show up on the Performance page in Database Hub, which is free. This post is a deep dive on the performance part of Database Hub. For the full tour, including the Overview, Estate, and Security pages, read Database Hub in Fabric: Now in Public Preview. Get started in three steps Open Database Hub in Fabric. During the preview, a Fabric administrator needs to turn on the Database Hub tenant setting. See the prerequisites. Turn on performance monitoring for your SQL resources. See Enable performance monitoring for Microsoft SQL. Go to the Performance page to see which databases need your attention. See your entire database estate in Database Hub Performance monitoring powers the Performance page in Database Hub. Database Hub is built for when you need to look across all your databases, not just one at a time. It brings your database estate across Azure, on-premises, and other clouds into one place, including: Azure SQL and SQL Server enabled by Azure Arc Azure Database for PostgreSQL Azure Cosmos DB The Performance page comes with prebuilt dashboards, so you can see performance at a glance without building anything yourself. The dashboards are designed to quickly answer two questions: Are my databases healthy? Which ones need my attention? From there, you can drill into resource usage, waits, and session activity to understand what's driving a change in performance. With Database Hub, you can: Get estate-wide visibility into health and performance across database types Investigate the root cause of performance issues across many databases Use AI-assisted analysis to find and explain issues faster To learn more, see What is Database Hub in Fabric? Why we built this Monitoring SQL performance at scale often meant building and running your own monitoring stack. Before you could effectively answer, "Which of my databases need attention right now?" you typically had to: Deploy and configure a collection resource, such as a watcher or an agent Build a telemetry pipeline to move the data Provision a data store, and then pay for it, secure it, and keep it running Build dashboards on top of all of it Repeat for every new server, database, or region That's a lot of work before you see your first chart. And every step is another thing that can break, drift, or quietly stop collecting data. Customers are also turning to AI to make sense of their database estate. They want an AI agent that can spot a performance problem, explain what's causing it, and recommend a fix. But an AI agent is only as good as the data it can reach. It operates best with one consistent source of performance data across every database, not a patchwork of tools and data stores. We heard this feedback loud and clear from customers. You told us you love having at-scale dashboards and ownership of your performance data. You also told us that setting up a telemetry stack was time-consuming, scale limits got in the way, and running the data store added operational burden and cost overhead. One customer put it simply: they wanted to spend less time managing their telemetry infrastructure and more time managing and improving their databases. Performance monitoring keeps the parts you valued and removes the infrastructure you had to manage. That's why it feeds Database Hub directly. You get one place to see your whole estate, and your AI agents get one consistent source of performance data. No infrastructure to manage (or pay for) With performance monitoring, there's no monitoring infrastructure for you to deploy, size, or run. It's all managed by Microsoft, with no scale limits on how many targets you can monitor. Telemetry is collected close to the database engine and sent to a Microsoft-managed telemetry pipeline and data store. Access to that data is governed by Azure role-based access control (RBAC), so people only see telemetry for the resources they already have access to. Consistent telemetry across your SQL estate Performance monitoring collects the same core set of performance data across every supported SQL deployment, whether it runs in Azure, on-premises, or in another cloud. That means one mental model and one set of dashboards in Database Hub, instead of a different tool for every flavor of SQL. The preview collects performance-related telemetry, including: CPU and memory utilization Wait statistics Active sessions Storage I/O and database storage utilization Performance counters Client connections Database properties Availability group, replica, and database replica health Go beyond Database Hub with KQL Database Hub covers the most common performance questions. When you need a view that Database Hub doesn't show, you can query the same telemetry directly with Kusto Query Language (KQL). The telemetry is available through a Microsoft-managed, RBAC-governed endpoint, so you don't need to create or pay for your own Azure Data Explorer cluster. Use it to: Build your own Real-Time Dashboards and reports Connect tools you already use, such as Grafana or Power BI Give an AI agent access to investigate performance across your estate To get started, see Query performance monitoring telemetry. It includes the schema, connection steps, and ready-to-run starter queries. Turn on performance monitoring How you turn on performance monitoring depends on the resource type. For all of the steps in one place, see Enable performance monitoring for Microsoft SQL. Resource type How monitoring is enabled in preview Step-by-step guidance Azure SQL Database Add an extended property to each database you want to monitor. You can also select Enable Performance Monitoring in Database Hub. Azure SQL Database Azure SQL Managed Instance (coming soon) Coming soon Coming soon SQL Server on Azure VMs Turn on a feature flag in the SQL IaaS Agent extension. SQL Server on Azure VMs SQL Server enabled by Azure Arc On by default once the server is connected to Azure Arc. SQL Server enabled by Azure Arc To view performance monitoring data, you need: The Reader role, or a role with higher privileges, on each subscription that contains the resources you want to view. The Microsoft.AzureArcData resource provider registered on each subscription. For steps, see Register the Azure resource provider. Availability Performance monitoring is available in public preview in select Azure regions. For the current list of supported regions, see Regional availability and data handling. Learn more Database Hub in Fabric: Now in Public Preview What is Database Hub in Fabric? Enable performance monitoring for Microsoft SQL Query performance monitoring telemetry Supplemental Terms of Use for Microsoft Azure Previews2.3KViews3likes5CommentsPublic Preview - Data Virtualization for Azure SQL Database
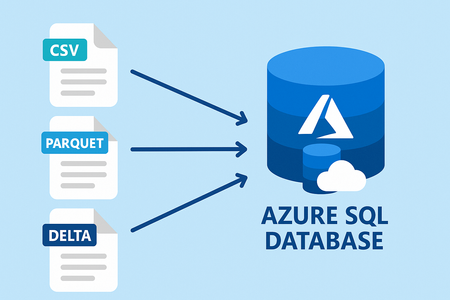
Data virtualization, now in public preview in Azure SQL Database, enables you to leverage all the power of Transact-SQL (T-SQL) and seamlessly query external data from Azure Data Lake Storage Gen2 or Azure Blob Storage, eliminating the need for data duplication, or ETL processes, allowing for faster analysis and insights. Integrate external data, such as CSV, Parquet, or Delta files, with your relational database while maintaining the original data format and avoiding unnecessary data movement. Present integrated data to applications and reports as a standard SQL object or through a normal SELECT command. Data Virtualization for Azure SQL Database supports SAS tokens, Managed Identity, and User identity for secure access. Data Virtualization for Azure SQL Database will introduce and expand support for: Database Scoped Credential. External Data Source. External File Format - with support for Parquet, CSV, and Delta. External Tables. OPENROWSET. Support metadata functions and JSON functions. For enhanced security and flexibility Data Virtualization for Azure SQL Database supports three authentication methods: Shared access signature. Managed identity (system assigned managed identity and user-assigned managed identity). User identity. Key Benefits Just like in SQL Server 2022 and Azure SQL Managed Instance the key benefits of Data Virtualization for Azure SQL Database are: Seamless Data Access: Query external CSV, Parquet, and Delta Lake tables using T-SQL as if they were native tables within Azure SQL Database. Allowing for off-loading cold data while keeping it easily accessible. Enhanced Productivity: Reduce the time and effort required to integrate and analyze data from multiple sources. Cost Efficiency: Minimize the need for data replication and storage costs associated with traditional data integration methods. Real-Time Insights: Enable real-time data querying and insights without delays caused by data movement or synchronization. Security: Leverage SQL Server security features for granular permissions, credential management, and control. Example Data Virtualization for Azure SQL Database is based on the same core principles as SQL Server’s PolyBase feature. With support for Azure Data Lake Gen 2, using prefix adls:// and Azure Blob Storage, using prefix abs://. For the following example we are going to use Azure Open Datasets, more specifically NYC yellow taxi trip records open data set which allows public access. For private data sources customers can leverage multiple authentication methods like SAS Tokens, Managed Identity and User Identity. -- Create Azure Blob Storage (ABS) data source CREATE EXTERNAL DATA SOURCE NYCTaxiExternalDataSource WITH ( LOCATION = 'abs://nyctlc@azureopendatastorage.blob.core.windows.net'); -- Using OPENROWSET to read Parquet files from the external data source SELECT TOP 10 * FROM OPENROWSET( BULK '/yellow/puYear=*/puMonth=*/*.parquet', DATA_SOURCE = 'NYCTaxiExternalDataSource', FORMAT = 'parquet' ) AS filerows; -- Or using External Tables CREATE EXTERNAL FILE FORMAT DemoFileFormat WITH (FORMAT_TYPE = PARQUET); --Create external table CREATE EXTERNAL TABLE tbl_TaxiRides ( vendorID VARCHAR(100) COLLATE Latin1_General_BIN2, tpepPickupDateTime DATETIME2, tpepDropoffDateTime DATETIME2, passengerCount INT, tripDistance FLOAT, puLocationId VARCHAR(8000), doLocationId VARCHAR(8000), startLon FLOAT, startLat FLOAT, endLon FLOAT, endLat FLOAT, rateCodeId SMALLINT, storeAndFwdFlag VARCHAR(8000), paymentType VARCHAR(8000), fareAmount FLOAT, extra FLOAT, mtaTax FLOAT, improvementSurcharge VARCHAR(8000), tipAmount FLOAT, tollsAmount FLOAT, totalAmount FLOAT ) WITH ( LOCATION = 'yellow/puYear=*/puMonth=*/*.parquet', DATA_SOURCE = NYCTaxiExternalDataSource, FILE_FORMAT = DemoFileFormat ); SELECT TOP 10 * FROM tbl_TaxiRides; You can also use these capabilities in combination with other metadata functions like sp_describe_first_result_set, filename(), and filepath(). Getting started Data Virtualization for Azure SQL Database is currently available in select regions, with broader availability coming soon across all Azure regions Data Virtualization for Azure SQL Database is based on the same core principles as SQL Server’s PolyBase feature. To know more and get started with Data Virtualization for Azure SQL Database.2.5KViews3likes1CommentImproving the conversion to Hyperscale with greater efficiency
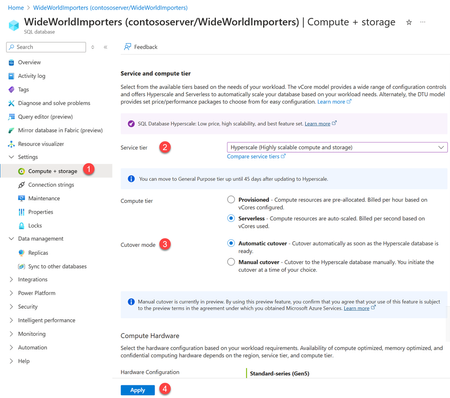
Update: On 09 April 2025 we announced the general availability this improvement. For more details, please read the GA announcement. We are thrilled to announce the latest improvement in the Azure SQL Database conversion process to Hyperscale. This update, now available in public preview, streamlines the database conversion process, reducing downtime and offering greater control and visibility to our customers. Let’s dive into the enhancements and what they mean for you. Overview We have heard feedback from customers about possible improvements we could make while converting their databases to Hyperscale. Customers complained about longer than expected downtime during conversion, no insights into the current state of conversion, and unpredictable cutover time. We acted on the feedback and made several key improvements in this release. 1. Shorter cutover time One of the most significant enhancements in this improvement is the reduction in cutover times when converting a database to Hyperscale. This improvement ensures that the cutover process is faster and more efficient, minimizing downtime and connectivity disruptions. Based on our telemetry, cutover time 99 th percentile has been reduced from ~6 minutes to less than ~1 minute. 2. Support for higher log generation rate During the migration, the new process supports a higher log generation rate on the source database, ensuring that the conversion can handle more write intensive workloads and complete successfully. In the previous version we saw that the database conversions were not able to finish when log generation on the source was more than 8 MiBps continuously, throughout the conversion process. With this improvement we can now support up to 50 MiBps log generation on source and still succeed. This was achieved by improving synchronizing mechanisms between source and destination while conversion is in progress. 3. Manual cutover A new option introduced with this improvement is manual cutover. This allows customers to initiate the conversion process and pause it when the database is ready to cutover to Hyperscale, giving them up to 72 hours to perform the cutover at a time that best suits their operational needs. If the manual cutover is not completed within the given timeframe, the process is automatically canceled, and the database remains on the original service tier, without any data loss. If the new parameter is not passed, then the cutover experience would be the same as earlier i.e. automatic cutover as soon as Hyperscale database is ready. 4. Granular progress reporting Another improvement in the conversion process is that now customers can monitor the entire conversion process at a granular level. Whether using T-SQL, REST API, PowerShell, Azure CLI or Azure portal, detailed progress information about conversion phases is available, providing greater transparency and control over the process. Customer feedback Throughout the private preview phase, we have received overwhelmingly positive feedback from several customers about this improvement. John Nafa, Cloud Architect, Asurgent says: The new database conversion experience from Microsoft has been incredibly seamless and efficient, making the conversion process to Azure SQL Database Hyperscale smooth and straightforward. The progress reporting and manual cutover features were especially valuable, providing real-time insights and ensuring a smooth transition. It’s been a pleasure working with this improvement, and I’m excited to see it become available to a wider audience. Get started Out of the four key improvements mentioned above, most are automatic. To utilize the manual cutover option, you need to use a new optional parameter in T-SQL, PowerShell, Azure CLI, or REST API while initiating the conversion process. Azure portal also provides a new option to select manual cutover. Granular progress reporting is available irrespective of the cutover mode. Use manual cutover Let us go through new options available in various interfaces with this improvement. Azure Portal To use manual cutover, a new Cutover mode option is provided in the Azure portal. The following screenshot shows the steps to convert a database to Hyperscale. The new option is shown under step 3. If you have not seen this option in the Azure portal yet, don’t worry. We are enabling this capability now and you can expect it to be available within days. Commands A new parameter has been introduced in each interface to initiate the conversion process with the manual cutover option. The following table provides sample commands to convert a database named WideWorldImporters on a logical server called contososerver to an 8-vcore serverless Hyperscale database. Method Command T-SQL ALTER DATABASE WideWorldImporters MODIFY (EDITION = 'Hyperscale', SERVICE_OBJECTIVE = 'HS_S_Gen5_8') WITH MANUAL_CUTOVER PowerShell Set-AzSqlDatabase -ResourceGroupName "ResourceGroup01" -ServerName "contososerver" -DatabaseName "WideWorldImporters" -Edition "Hyperscale" -requestedServiceObjectiveName "HS_S_Gen5_2" -ManualCutover Azure CLI az sql db update --resource-group ResourceGroup01 --server contososerver --name WideWorldImporters --edition Hyperscale --service-objective HS_S_Gen5_2 --manual-cutover Note: Additional parameters like backup storage redundancy or zone redundancy etc. can also be added. Refer documentation Set-AzSqlDatabase (Az.Sql) | Microsoft Learn (for PowerShell) and az sql db | Microsoft Learn (for Azure CLI). REST API also has new properties manualCutover and performCutover. Refer Databases - Create Or Update - REST API (Azure SQL Database) | Microsoft Learn for more details. Monitor the conversion progress The progress during this conversion can be monitored using various interfaces. Detailed phase information is available in the Dynamic Management View (DMV) sys.dm_operation_status for those using T-SQL. Similar command options are available for PowerShell and Azure CLI users. Azure Portal Progress of the conversion process can be seen by clicking on Details hyperlink as shown in the below screenshot at step 2. Monitoring programmatically As a part of this improvement, we have introduced new columns in the sys.dm_operation_status DMV called phase_code, phase_desc and phase_info which are populated during conversion process. Refer to documentation for more details. Similarly, new output columns, phase and phaseInformation, are available if using PowerShell under OperationPhaseDetails and if using Azure CLI under operationPhaseDetails. Here is the quick reference for commands via various interfaces. Method Command T-SQL SELECT state_desc, phase_code, phase_desc, JSON_VALUE(phase_info, '$.currentStep') AS currentStep, JSON_VALUE(phase_info, '$.totalSteps') AS totalSteps, phase_info, start_time, error_code, error_desc, last_modify_time FROM sys.dm_operation_status WHERE resource_type = 0 AND operation='ALTER DATABASE' AND major_resource_id = 'WideWorldImporters' PowerShell (Get-AzSqlDatabaseActivity -ResourceGroupName "ResourceGroup01" -ServerName "contososerver" -DatabaseName "WideWorldImporters").OperationPhaseDetails Azure CLI (az sql db op list --resource-group ResourceGroup01 --server contososerver --database WideWorldImporters | ConvertFrom-Json).operationPhaseDetails.phase Perform manual cutover The manual cutover, if specified, can be performed using the Azure portal or programmatically, ensuring a smooth transition to the Hyperscale tier. Azure Portal Cutover can be initiated from the same screen where progress of conversion is reported. Commands Here is the quick reference of the commands to perform cutover. Method Command T-SQL ALTER DATABASE WideWorldImporters PERFORM_CUTOVER PowerShell Set-AzSqlDatabase -ResourceGroupName "ResourceGroup01" -ServerName "contososerver" -DatabaseName "WideWorldImporters" -PerformCutover Azure CLI az sql db update --resource-group ResourceGroup01 --server contososerver --name WideWorldImporters --perform-cutover Conclusion This update marks a significant step forward in the Hyperscale conversion process, offering faster cutover time, enhanced control with a manual cutover option, and improved progress visibility. We encourage you to try these features and provide your valuable feedback and help us refine this feature for general availability. You can contact us by commenting on this blog post and we’ll be happy to get back to you. Alternatively, you can also email us at sqlhsfeedback AT microsoft DOT com. We are eager to hear from you all!3.3KViews3likes0CommentsShrink for Azure SQL Database Hyperscale is now generally available
Today we are thrilled to announce General Availability (GA) of the database shrink in Azure SQL Database Hyperscale. This milestone marks another significant improvement in our Hyperscale service, providing our customers with more flexibility and efficiency in managing their database storage. Overview Database shrink in Azure SQL Database allows customers to reclaim unused space within their databases to optimize storage costs. Now this is available in Hyperscale service tier too. This feature has been highly anticipated by many customers, and we are excited to deliver it with robust capabilities and seamless user experience. This improvement needs no new learnings as the same DBCC SHRINKDATABASE and DBCC SHRINKFILE commands are used. Database shrink was first announced for Hyperscale in public preview during last year. During the preview phase, we received invaluable feedback from our customers, which helped us refine and enhance this capability. We are grateful for the active participation and insights shared by the customers, which played a crucial role in shaping the feature. Key features Storage Optimization: Database shrink effectively reclaims unused space, reducing the allocated storage footprint of your database. Cost Efficiency: By optimizing storage usage, customers can potentially lower their storage costs. Ease of Use: The feature uses the same syntax as what is available in other service tiers and in SQL Server. So, customers are able to seamlessly use existing scripts, minimizing disruption during adoption. How to use To help you get started with the shrink functionality, we have provided comprehensive documentation including example scripts. Here are the basic steps to implement database shrink in your Hyperscale database: Connect to your Hyperscale database through your preferred management tool such as SQL Server Management Studio, Azure Data Studio etc. Evaluate the free space available in the database. Execute the shrink command using the provided T-SQL (DBCC SHRINKDATABASE and DBCC SHRINKFILE). Optionally, you can monitor the shrink process through DMV to ensure successful completion. Review the reclaimed space and rerun by adjusting the parameters, if necessary. Conclusion The release of database shrink in Hyperscale is a testament to our commitment to continuous improvement in Hyperscale service tier. The General Availability of database shrink in Azure SQL Database Hyperscale is a major milestone, and we are excited to see the positive impact it will have on your database management. You can contact us by adding to this blog post and we’ll be happy to get back to you. Alternatively, you can also email us at sqlhsfeedback AT microsoft DOT com. We are eager to hear from you all!5.8KViews3likes2CommentsPublic Preview: Alerts for Azure SQL Database in Database Hub, powered by Fabric Activator
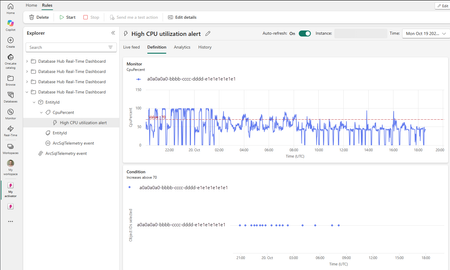
We're excited to announce the public preview of alerts for Azure SQL Database in Database Hub, powered by Fabric Activator. Last month, we brought performance monitoring for Azure SQL to Database Hub. That gave you one place to see how your databases are performing. Alerts are the next step. Instead of waiting for someone to spot a problem on a dashboard, Database Hub now watches your telemetry and tells you when a database needs attention. With alerts in Database Hub, you can: Create an alert on a database in a few clicks, starting from a built-in template Turn a chart on the Performance page into an alert that covers many databases at once Take action when an alert fires, from a Teams message to a Power Automate flow Why we built this When we talk with customers about database monitoring, the first question after "Can I see it?" is almost always "Can it alert me when something's wrong?" Setting up performance alerts for SQL at scale usually meant: Deploying a monitoring resource to collect telemetry Running a data store to hold it Setting up identities and permissions so the alerting service could read it Writing and maintaining alert queries for every new database We wanted alerting to work the way performance monitoring does in Database Hub. Turn it on, and it just works. Rather than build a new alerting engine, we built on Fabric Activator. Activator is the no-code detection and alerting engine that Fabric customers already use to keep an eye on their Fabric workloads. Today, teams use it to: Get alerted when a pipeline fails or a semantic model refresh doesn't finish Watch live data in eventstreams and Real-Time Dashboards Respond automatically, from a Teams message to a notebook or a Power Automate flow Now we've brought those same capabilities to the SQL resources in Database Hub. Database Hub brings the database context and the telemetry. Activator brings the rules engine and the actions. You don't have to learn a new alerting tool. Your database alerts live right alongside the rest of your Fabric alerts. Two ways to create an alert 1. Start from a template This is the fastest way to get started. Go to the Estate page in Database Hub. Hover over an Azure SQL database and open the quick actions menu. Select Set alert from template. Pick a template. Each template covers a common performance problem and comes with a default condition you can tune. For the current list of templates, see Alert templates. The query and the database are already filled in for you. All you need to decide is: How often to check. You can go as often as every minute. The condition thresholds for when to alert. Keep the default threshold or tune it for your workload. What to do when the alert fires (more details in the next section). Then select Create. 2. Alert on a Performance chart Sometimes you don't care which database it is. You just want to know when any of your databases are in trouble. Hover over a chart on the Performance page and select the lightning bolt icon. The query behind the chart becomes the query for your alert. For example, you can get notified whenever any of your databases have had high CPU for more than 5 minutes. Chart alerts cover every resource on the chart. That includes SQL Server on Azure VMs and SQL Server enabled by Azure Arc, even though templates for them aren't available yet. Choose what happens when an alert fires A notification is a good start. But Activator can do a lot more than send a message. Here are a few examples of what you can do when an alert fires: Send a Teams message, such as a post in your on-call channel Send an email Run a Fabric notebook that collects extra diagnostics for the affected database, so the evidence is waiting for you when you start investigating Trigger a Power Automate flow, such as opening an incident in the IT service management (ITSM) tool you already use Activator can also run other Fabric items, like pipelines and Spark jobs. For the full list of actions, see Configure actions for Activator rules. Every notification links you straight into Activator. There you'll see: The metric trend, with your threshold drawn on the chart Exactly when the condition was met The rule's run history, so you can confirm it's checking as often as you expect No identities or credentials to manage When you enable performance monitoring, telemetry is sent to a Microsoft-managed pipeline and data store. Activator rules query that data store, not your databases. That means: There are no additional credentials or identities to create on your databases Alert queries don't add load to your databases Alert rules run with your identity. You can alert on telemetry for any resource where you have the Reader role on its subscription. Keep in mind that anyone who can open your rule, or who receives its notifications, sees the telemetry it returns. They don't need their own access to those resources. Choose your workspace and recipients accordingly. Things to know during the preview Alerts run on Fabric capacity. Database Hub is free. Activator rules run in a Fabric workspace and use that workspace's capacity. Standard Activator capacity usage applies. See all your alerts in one place. The Rules page in Real-Time hub shows every Activator rule you have access to across workspaces. That includes the ones you create from Database Hub. Low end-to-end latency. How quickly an alert fires depends on two intervals: Collection interval. Each type of telemetry is collected on its own schedule. Fast-moving metrics like CPU are collected every 10 to 15 seconds. For the interval for each table, see Query performance monitoring telemetry. Query interval. Activator can run your alert query as often as every minute. What's next We're just getting started. Here's what we're working on: More templates for Azure SQL Database Templates for SQL Server on Azure VMs and SQL Server enabled by Azure Arc Templates for Azure SQL Managed Instance, once performance monitoring for Managed Instance is available Alerts for Azure Database for PostgreSQL and Azure Cosmos DB Handing an alert off to a database agent so it can start the investigation for you Get started Open Database Hub in Fabric. Turn on performance monitoring for your SQL resources. See Enable performance monitoring for Microsoft SQL. Make sure you have a Fabric workspace on a Fabric capacity to save your alerts in. A Fabric trial capacity works for trying it out. On the Estate page, hover over a database and open the quick actions menu. Then select Set alert from template. Pick a template and choose your action. Then select Create. For the full walkthrough, see Create Activator alerts for Microsoft SQL. Give it a try and let us know what you think in the comments. We especially want to hear which templates you want us to build next. Learn more Create Activator alerts for Microsoft SQL What is Fabric Activator? Public Preview: Performance monitoring for Azure SQL in Database Hub Database Hub in Fabric: Now in Public Preview Enable performance monitoring for Microsoft SQL Query performance monitoring telemetry78Views2likes2Comments