grafana
3 TopicsQwen3.8-Flash-Next on two H100s in an Azure Spot VM
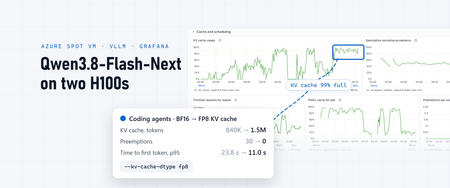
With 150,000 tokens of context, one request to Qwen3.8-Flash-Next decoded at about 200 tokens a second, and its first token arrived in under a second, because 95% of the prompt came from the cache. That held while the agents kept up to five requests running at once. At seven, one request in twenty waited 23 seconds or more for its first token. No error explained it; the dashboard did, one panel after another. This post covers how to run the model on two H100 GPUs in one Azure VM and how to observe it: which signals matter for this kind of model, three places where a standard dashboard misreads it, and one serving flag that made a measurable difference. My previous post, Qwen3.8-27B on a $2 H100 Azure Spot VM: does it pay off?, walks through the base setup (the VM, the Compose stack, the LiteLLM gateway and the OpenTelemetry pipeline into Application Insights and Grafana) in more detail; here I focus on what changes for a bigger model. What you're running Qwen3.8-Flash-Next is a mixture-of-experts (MoE) model from Qwen, released in August 2026 under the qwen-community-1.0 license. A few of its properties shape how you serve it: 125B parameters, 6B active per token. Each token passes through a small share of the experts, so decoding reads far less than the full weights. Mostly linear attention. Its 48 layers come in 12 blocks of three Gated DeltaNet layers, which keep a fixed-size state, and one Qwen Sparse Attention layer. Only those 12 sparse-attention layers keep a per-token KV cache. A 51B n-gram embedding table (20 million bigram and trigram entries), which vLLM keeps in host memory on H100 GPUs. A multi-token prediction (MTP) layer for speculative decoding, a 262,144-token context window (extendable to about one million with YaRN), and vision input. Thinking on by default, with a reasoning_effort setting ( xhigh by default, or medium or low ). Qwen's FP8 checkpoint, Qwen/Qwen3.8-Flash-Next-FP8 , is 185.6 GB, too much for one 94 GB H100 even with the n-gram table in host memory. Split across two with tensor parallelism, it fits with room left for the KV cache: Per GPU GiB Weights, n-gram table excluded, split in two 65.6 vLLM's share of the GPU at --gpu-memory-utilization 0.90 ~84 Left for the KV cache, activations and CUDA graphs ~18 Why not 4-bit weights? FP4 weights would save memory, but on an H100 they can be slower. The H100's tensor cores compute in FP8, not FP4, which arrived with Blackwell. NVIDIA publishes an NVFP4 checkpoint of this model, 132.7 GB, quantized for and tested on B200 and B300 GPUs, under the NVIDIA Open Model License in addition to Qwen's. vLLM v0.31.0 still loads it on an H100 by falling back to a Marlin kernel, which keeps the expert weights in 4 bits and unpacks them to BF16 for each matrix multiplication. That saves memory, not compute: the experts then multiply in BF16, whose peak rate on an H100 is half that of FP8. In that checkpoint, only the routed experts are FP4. Attention, the shared experts and the other layers stay in BF16, and the n-gram table and the MTP layer stay in FP8. My estimate from its file sizes: FP8 (this post) NVFP4 on H100 (estimate) Weights on the GPUs, n-gram table excluded 131 GiB ~76 GiB On one H100 Doesn't fit Only just: a few GiB left for the KV cache, about one long agent session KV cache on two H100s 1.5 million tokens, FP8 cache About three times as much Expert matrix math FP8 tensor cores BF16, after unpacking the weights Which way it goes depends on the workload. Decoding mostly reads weights, so smaller weights can keep it fast. Prefill is mostly math, and coding agents send long prompts, so a slower prefill shows up as a longer wait for the first token whenever the cache misses. A cache three times larger would miss less often. I haven't measured this trade; if you try it, the panels later in this post show it, with time to first token and computed prefill set against the prefix-cache hit rate. For one GPU today, see the one-GPU alternative near the end of this post. Step 1: Get a two-GPU Spot VM The size is Standard_NC80adis_H100_v5 : two H100 NVL GPUs with 94 GB each, 80 vCPUs and 640 GiB of memory. On October 12, 2026 it cost $3.22 an hour as an Azure Spot Virtual Machine in UK South, against $17.45 at the pay-as-you-go price: about 80% less, for capacity that Azure can take back with 30 seconds' notice (prices change; check the pricing page). In the two regions I compared, the Spot price was exactly twice the one-GPU size's. Spot draws on your regional low-priority vCPU quota. This size takes 80 vCPUs of it, which in my subscription left no room in the same region for the one-GPU VM from the previous post. Plan for evictions: my two VMs of this size in UK South zone 2 ran 6 h 17 min and 6 h 30 min before Azure reclaimed them. Both kept their disks under the Deallocate eviction policy, so a restart in place reloads the model from disk in a few minutes. The sample's infra/provision-spot-vm.sh creates this size, with the same private network as in the previous post: no public IP, outbound traffic through a NAT gateway, and administration through az vm run-command : LOCATION=southeastasia ZONE=2 infra/provision-spot-vm.sh Step 2: Prepare the host The host bootstrap is the same as for one GPU: the data disk, the NVIDIA datacenter driver (595 branch), Docker and the NVIDIA Container Toolkit, in about four minutes. Then check how the two GPUs are connected, because tensor parallelism exchanges data between them in every layer: $ nvidia-smi topo -m GPU0 GPU1 CPU Affinity NUMA Affinity GPU0 X NV12 0-39 0 GPU1 NV12 X 40-79 1 NV12 means an NVLink bridge with 12 links. nvidia-smi nvlink --status lists 18 links per GPU, 12 active at 26.6 GB/s each and 6 inactive. Remember those six; they come back in the monitoring section. Step 3: Serve it with vLLM NVIDIA's NGC vLLM container that served the 27B predates this model, so the stack uses vLLM's own vllm/vllm-openai:v0.31.0 image, which knows the architecture and its MTP layer. The flags follow vLLM's recipe for this model, adjusted for two GPUs: vllm serve /models/Qwen3.8-Flash-Next-FP8 \ --served-model-name qwen3.8-flash-next-vllm \ --tensor-parallel-size 2 \ --max-model-len 262144 \ --gpu-memory-utilization 0.90 \ --max-num-seqs 32 \ --max-num-batched-tokens 16384 \ --enable-prefix-caching \ --kv-cache-dtype fp8 \ --attention-config.indexer_kv_dtype fp8 \ --moe-backend triton \ --no-enable-flashinfer-autotune \ --spec-method mtp --spec-tokens 3 \ --reasoning-parser qwen3 \ --enable-auto-tool-choice --tool-call-parser qwen3_coder Flag Why --tensor-parallel-size 2 Splits every layer across the two GPUs. --gpu-memory-utilization 0.90 Under load each GPU reached 92 of 96 GB at this setting, so I left it there. --kv-cache-dtype fp8 , --attention-config.indexer_kv_dtype fp8 Stores the KV cache, and the sparse-attention indexer's, in FP8. The recipe's H100 command leaves these out; its H200 command, also a Hopper GPU, includes them. Why I added them is the subject of One flag, measured, below. --moe-backend triton , --no-enable-flashinfer-autotune The recipe's MoE kernels for Hopper GPUs. --spec-method mtp --spec-tokens 3 Speculative decoding with the model's MTP layer. --reasoning-parser qwen3 , --tool-call-parser qwen3_coder Thinking returned separately from the answer, and OpenAI-style tool calls. Two container settings matter as well. vLLM pins each GPU's share of the n-gram table in host memory, so the container needs ulimits: memlock: -1 , and the two tensor-parallel workers communicate through shared memory, so it needs ipc: host . On a new VM, the download takes about 20 minutes and loading about 4 more. The startup log then tells you the two numbers that decide everything later: Model loading took 65.58 GiB memory GPU KV cache size: 1,506,691 tokens, Maximum concurrency for 262,144 tokens per request: 5.75x Step 4: Check it The smoke test from the previous post (an exact answer, a required tool call and a decode-speed run) passes, and one request generates 260 tokens a second with thinking off, against 166 for the 27B on one GPU. A 45-case basic evaluation (math and logic with and without thinking, knowledge, instruction following, generated code run against tests, tool calls, and needle retrieval at 30K and 120K tokens) scores 44 of 45, the same as the 27B. An agentic coding evaluation on 10 short Terminal-Bench 2.0 tasks solved 8. Step 5: Observe it The telemetry pipeline is the one from the previous post: an OpenTelemetry Collector on the VM scrapes vLLM, LiteLLM and NVIDIA's DCGM exporter, reads host and container statistics, receives LiteLLM's spans and tails the container logs, and sends all of it to Application Insights, which stores the metrics in an Azure Monitor workspace as Prometheus data. Grafana reads both. Two things changed for this model. One dashboard for several models The collector stamps every metric, span and log record with an upstream_model label naming the model the VM serves. A model variable at the top of the dashboard filters every panel by it and lets you pick one model, several or all. With more than one, each graph draws a line per model, so the 27B and Flash-Next appear side by side. Two details made it work. The Azure Monitor workspace's label-values API requires exactly one metric name, so the variable's query is label_values(vllm:num_requests_running, upstream_model) . And the VM's cost is now computed from the GPUs reporting in each minute times a price per GPU-hour, so a one-GPU and a two-GPU model are both costed correctly from one price. Three numbers the dashboard got wrong at first Per-request speed. The usual formula, 1 / histogram_quantile(0.5, ...inter_token_latency_seconds...) , read a constant 57 tokens a second on this model while requests were really getting 150 to 260. Two things go wrong at once. With speculative decoding, vLLM records one inter-token interval per decode step, and each step produced about 2.4 tokens. And 99.7% of the steps landed in the histogram's 10–25 ms bucket, so the median is that bucket's midpoint, 17.5 ms, whatever the real speed. I used the same formula in the previous post's table; this one holds up better: (sum(rate(vllm:generation_tokens_total[5m])) > 0) / clamp_min(sum(avg_over_time(vllm:num_requests_running[5m])), 1) That's output tokens per second divided by the requests running. The clamp_min matters because the collector samples the running-request gauge every 15 seconds and misses short requests that start and end between samples. Without it, a minute of short requests read up to 668 tokens a second. GPU health. DCGM's health check reported Fail on a healthy VM. Its NVLink watch reports the six inactive links on each GPU as down ( dcgm_fr_nvlink_down ), while the bridge's 12 links are up. The dashboard's health tile now leaves that one error code out, which leaves the Warn that power throttling raises under normal load. Histogram means. OTLP histograms arrive in the Azure Monitor workspace as native histograms. histogram_quantile works on them, but histogram_sum , histogram_count and histogram_avg returned 0 or NaN for these metrics, so averages come from counter rates, as above, rather than from the histograms. The panels that matter for this model Question PromQL Are requests waiting, and for what? sum by (reason) (vllm:num_requests_waiting_by_reason) : capacity means the KV cache is full Is the KV cache holding the sessions? max(vllm:kv_cache_usage_perc) , and the prefix-cache hit rate sum(rate(vllm:prefix_cache_hits_total[5m])) / sum(rate(vllm:prefix_cache_queries_total[5m])) Is the GPU recomputing prompts? sum(rate(vllm:prompt_tokens_by_source_total{source="local_compute"}[5m])) against {source="local_cache_hit"} , and sum(increase(vllm:num_preemptions_total[5m])) How far does speculative decoding get? sum by (position) (rate(vllm:spec_decode_num_accepted_tokens_per_pos_total[5m])) / scalar(sum(rate(vllm:spec_decode_num_drafts_total[5m]))) What crosses the PCIe bus? sum(dcgm_fi_prof_pcie_rx_bytes) , host to GPU in bytes per second The spans complete the picture. Each LiteLLM call carries its input and output tokens, time to first token, duration and finish reason, so decode speed per call is output tokens / (duration - time to first token) , and you can group calls by prompt size. The spans also record each tool the client declares, which tells different agents apart without capturing a single prompt. Load it with coding agents A benchmark sends synthetic prompts at a fixed rate. Agents don't: their prompts grow with every turn, most of each prompt is the previous turn's, and between turns they run tools while the model waits. To see the model under that shape of load, I ran opencode, an open-source coding agent, as a load generator: one instance per local repository, each asked to review every file. Agents that can edit files and run commands shouldn't be pointed at a dozen repositories for a load test, so every instance ran with an inline configuration that limits it to read-only tools. Passed in OPENCODE_CONFIG_CONTENT , it overrides the global and project opencode config files; only managed settings rank higher. The sample's load-test/review-readonly.json is a copy of the one I ran that also defines the gateway as an OpenAI-compatible provider and keeps agents away from .env files: { "provider": { "litellm": { "npm": "@ai-sdk/openai-compatible", "name": "LiteLLM gateway", "options": { "baseURL": "{env:LOCAL_LLM_URL}/v1" }, "models": { "local-llm": { "name": "local-llm", "limit": { "context": 245760, "output": 16384 } } } } }, "model": "litellm/local-llm", "small_model": "litellm/local-llm", "permission": { "read": { "*": "allow", "*.env": "deny", "*.env.*": "deny", "*.env.example": "allow" }, "glob": "allow", "grep": "allow", "list": "allow", "todowrite": "allow", "edit": "deny", "bash": "deny", "webfetch": "deny", "websearch": "deny", "external_directory": "deny", "question": "deny", "task": "deny", "doom_loop": "deny" }, "mcp": { "playwright": { "enabled": false } }, "lsp": false, "formatter": false, "snapshot": false, "autoupdate": false, "share": "disabled" } List your own MCP servers under mcp the same way. To run one agent by hand: export LOCAL_LLM_URL=https://<your-domain>.ngrok-free.dev export OPENCODE_CONFIG_CONTENT="$(cat load-test/review-readonly.json)" cd ~/src/some-repo && opencode run --pure -m litellm/local-llm "Review every file in this repository." The sample's load-test/launch.sh starts one per folder you list, a few seconds apart, and stops launching when the workstation runs low on memory. Check it in a scratch folder first: ask an agent to create a file and run a command. In my test the agent wasn't offered those tools, and the folder stayed unchanged. Three settings in it matter beyond safety. The context limit tells opencode when to compact the conversation; without it, sessions grew until the gateway rejected them as too long. Denying task stops an agent from starting sub-agents, so each instance is one session; with sub-agents allowed, 29 instances had 69 requests in flight. And each instance took 0.7–0.9 GB of memory on my workstation, so the workstation, not the GPU, capped the first run at 46 agents. What the telemetry showed Decode speed barely depends on context length From the spans, here is the median decode speed of calls with at least 300 output tokens, by prompt size, next to the 27B's from the previous post's busy window: Prompt size Flash-Next, 1–2 requests at once Flash-Next, 3–5 at once 27B, about 3 at once Under 50K tokens 197–221 201 60–78 50–100K 192 183 63 150–200K 217 200 54 Over 200K 195 166 51 The 27B slowed by about a fifth as its prompts grew; Flash-Next held its speed. The architecture explains it: 36 of its 48 layers keep a fixed-size state, and the other 12 use sparse attention, so the work per token grows little with the context. The n-gram table shows up on the PCIe bus With the model decoding, DCGM reported 4.6–8.6 GB/s flowing from host to GPU over PCIe, rising and falling with the output rate and dropping to almost nothing when idle. On the 27B, which keeps everything in GPU memory, the same counter read 0.03 GB/s. The n-gram table is the part of this model that lives in host memory, so it's the likely source. That's at most an eighth of what the GPUs' PCIe 5.0 x16 links carry, so it isn't a bottleneck at this load, but it's worth a panel if you run more requests at once. Sessions, not requests, fill the KV cache Agentic traffic is mostly reused prompt. For hours, 88–95% of input tokens came from the prefix cache, and time to first token stayed under a second at 100,000 tokens and more. vLLM keeps each session's prompt in the cache between turns, so the next turn only processes what's new. That works only while every active session's prompt fits, including the sessions that are between turns, running tools. With the KV cache in BF16, the cache held 840,277 tokens. Here is what happened when the agents went from five requests running at once to seven, with prompts of about 110,000 tokens at the median and up to 230,000: 15 minutes to (UTC) Requests running, peak KV cache, peak Prefix-cache hits Input recomputed Preemptions Time to first token, p50 / p95 04:15 5 72% 91% 2.1M tokens 0 0.7 s / 2.7 s 04:30 7 97% 45% 9.0M tokens 4 1.4 s / 25.5 s 04:45 7 98% 50% 6.8M tokens 2 3.9 s / 23.2 s 05:00 7 99% 74% 5.2M tokens 24 0.6 s / 14.5 s At no point did vLLM run more than seven requests, against a limit of 32. The limit that mattered was memory: the sessions evicted each other's cached prompts, and each turn recomputed 100,000 tokens or more. The waiting-requests metric says so directly: up to four requests at a time waited, all with the reason label capacity . One flag, measured The KV cache in FP8 takes half the memory per token. With --kv-cache-dtype fp8 and --attention-config.indexer_kv_dtype fp8 , the cache grew from 840,277 to 1,506,691 tokens in the same memory, and from 3.2 to 5.75 full-length contexts. The weights don't change, and neither did the checks: 260 tokens a second for one request and 44 of 45 on the evaluation, including both long-context retrievals. Then I repeated the load on a fresh VM with eight of the read-only review agents described above, one session each. Their prompts grew to a median of 122,000 tokens and up to 235,000, a little larger than in the BF16 window. Measured the same way for both windows: BF16 cache, 04:15–05:00 FP8 cache, 07:23–07:38 Requests running, average / peak 3.3 / 7 6.4 / 8 Prompt size, p50 / max 112K / 229K 122K / 235K KV cache, peak 99% 88% Prefix-cache hits 58% 74% Preemptions 30 0 Time to first token, p50 / p95 / max 0.9 s / 23.8 s / 42.2 s 1.1 s / 11.0 s / 20.7 s Output tokens per second, all requests 219 415 Twice as many requests ran at once, the cache never filled, nothing was preempted, and the slowest first tokens arrived in half the time. The hit rate didn't climb back to 90%: review agents read new files on every turn, and no cache can serve tokens it hasn't seen. The two windows come from different agents, so take the comparison as indicative rather than exact; the cache panels tell the same story. Past the cache More agents don't help once the cache is full. With 46 agents on the FP8 cache, 21 requests ran and 24 waited for capacity, the cache stayed 97% full, and the prefix-cache hit rate fell to 0%. The GPUs spent their time on about 12,000 tokens a second of recomputed prompts against 400–450 of output, and the median time to first token passed 30 seconds. Stopping the agents didn't free the server right away either. Their disconnects didn't make it through the gateways to vLLM, which worked through the 35 requests the agents had left queued, a few minutes of work for nobody, before the next test could start. Rules of thumb Size by sessions, not requests. The number of agent sessions that stay cached is roughly the KV cache size divided by a typical session's context: about 1.5 million / 100,000–150,000, so 10 to 15 here. The startup log gives you the first number, and the spans give you the second. Watch why requests wait. vllm:num_requests_waiting_by_reason{reason="capacity"} rising means memory, which --max-num-seqs won't fix. Read prefix-cache hits and recomputed input together. A falling hit rate with rising computed input is the cache thrashing, and time to first token follows within minutes. Mind the thinking. 87–94% of output tokens were reasoning. For routine tool calls, a lower reasoning_effort is the client-side lever. The one-GPU alternative If one H100 is all you have, Strata, an open-source engine built for this model on consumer GPUs, runs Unsloth's ~4-bit GGUF on a single H100 NVL with every expert in GPU memory: 151 tokens a second for one request, 44 of 45 on the same evaluation and 9 of 10 agentic tasks. Concurrency is where it differs from vLLM: in version 0.1.42, four batch slots added only about 20% (177 tokens a second in total), and under the evaluation's mixed concurrent load they started failing requests, so I ran it one request at a time. Check newer releases if you need concurrency. Try it Sample code: wuyi-labs/2610-h100-qwen-38-flash-next, with provisioning, the vLLM Compose stack, the dashboard and the read-only opencode load test. The model: Qwen3.8-Flash-Next on Hugging Face and vLLM's recipe for it. The base setup: Qwen3.8-27B on a $2 H100 Azure Spot VM: does it pay off?, and Ingest OTLP data into Azure Monitor with the OpenTelemetry Collector. KV cache quantization: Quantized KV cache in vLLM. Load generation: opencode and its permissions. Spot: Azure Spot Virtual Machines and Linux VM pricing.37Views1like1CommentQwen3.8-27B on a $2 H100 Azure Spot VM: does it pay off?
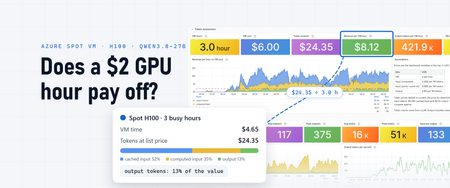
For three hours on the morning of October 9, a single H100 in Azure served 1,434 requests to Qwen3.8-27B: 168.7 million input tokens in, 1.27 million output tokens out. At a public list price for this model that day ($0.425 per million input tokens, $0.085 per million cached input tokens and $2.55 per million output tokens), those tokens are worth $24.35. The three hours of VM time cost $4.65 at that region's Spot price; the dashboard below counts them at a round $2 an hour. This post is the guide I'd have wanted before I started: how to run Qwen3.8-27B on an Azure GPU VM, how to tune it, and how to monitor it end to end, with metrics, logs and traces, using Application Insights and Grafana. The answer to the title comes at the end. The dashboard that measured it comes from the monitoring setup in the middle. What you're running Qwen3.8-27B is a 27-billion-parameter dense model from Qwen, released under the Apache 2.0 license. A few of its properties shape how you serve it: Hybrid attention. 48 of its 64 layers use Gated DeltaNet linear attention, which keeps a fixed-size state instead of a per-token KV cache. Only the 16 full-attention layers grow with the context, which is why long contexts fit on one GPU. A 262,144-token context window, which Qwen documents how to extend to about one million tokens with YaRN. Thinking on by default, with a per-request switch to turn it off. Multi-token prediction (MTP) layers, which vLLM can use for speculative decoding. Vision: it reads images and video as well as text. The GPU is a Standard_NC40ads_H100_v5 : one H100 NVL with 94 GB of memory and 40 vCPUs. Both official checkpoints fit on it: BF16 ( Qwen/Qwen3.8-27B ) FP8 ( Qwen/Qwen3.8-27B-FP8 ) Download 55.6 GB 30.9 GB Weights in GPU memory 51.9 GiB 29.0 GiB KV cache left over 805K tokens 1.45M tokens One request, 512 tokens, thinking off 124 tok/s 172 tok/s Use FP8. The H100 runs FP8 natively, each decode step reads fewer bytes, and the memory the smaller weights free up nearly doubles the KV cache. The NVFP4 builds you'll see in vLLM's recipes target Blackwell GPUs, since the H100 has no FP4 tensor cores. Step 1: Get a Spot H100 VM Azure Spot Virtual Machines sell spare capacity at a discount, with no SLA, and Azure can evict them with 30 seconds' notice. In October 2026 this size cost $1.55 to $1.84 an hour on Spot in the regions I settled on, which this post rounds to $2 (prices change; check the pricing page). Spot draws on your regional low-priority vCPU quota, 40 vCPUs for this size, not on the H100 family quota, which was zero in my subscription. Pick the region with data rather than habit. The sample's infra/spot-regions.sh lists each region's eviction-rate bucket and Spot price history, and the current placement score per zone; there's more on that in the Spot section below. Then create the VM with infra/provision-spot-vm.sh: LOCATION=southeastasia ZONE=2 IDENTITY_RG=rg-llm-telemetry infra/provision-spot-vm.sh In about five minutes that gives you: a resource group, a VNet and a network security group with only the default rules, which deny inbound traffic from the internet a NAT gateway for outbound traffic: Docker images, Hugging Face downloads and telemetry the VM: Ubuntu 24.04 and no public IP. It uses Trusted Launch with Secure Boot off, because Secure Boot rejects the unsigned NVIDIA kernel modules. It has a 512 GB data disk for weights and images, the Spot Deallocate eviction policy so an eviction keeps the disks, and a managed identity for telemetry With no public IP and no SSH, you administer the VM through az vm run-command , which the sample's scripts/vm-run.sh wraps: scripts/vm-run.sh <script> runs a local script on the VM as root and prints the output. Step 2: Prepare the host scripts/vm-run.sh scripts/bootstrap-host.sh The bootstrap takes about four minutes. It mounts the data disk at /data , installs the NVIDIA datacenter driver (the 595 branch with open kernel modules, which loads without a reboot), installs Docker Engine with its data root on /data , and registers the NVIDIA Container Toolkit with Docker. At the end, nvidia-smi should report one H100 NVL with 95,830 MiB. Step 3: Serve the model with vLLM The stack is a Docker Compose project: a one-shot job that downloads the pinned checkpoint, vLLM, a LiteLLM gateway, and optional overlays for telemetry and a public URL. The sample's scripts/deploy.sh, run with up , copies the folder to the VM through run-command and starts it in the background. On a new VM everything is healthy about 20 minutes later. Most of that is image pulls and the 31 GB download, and later restarts of the model take a few minutes. The model runs in NVIDIA's NGC vLLM container, release 26.07 (vLLM 0.24). One fix was needed there: tool calls failed with HTTP 500 because the bundled xgrammar 0.2.0 lacks a function vLLM's frontend imports, so the sample's image adds xgrammar 0.2.3. The checkpoint is pinned to a revision and downloaded once to the data disk, so restarts don't depend on Hugging Face. This is the serve command: vllm serve /models/Qwen3.8-27B-FP8 \ --served-model-name qwen3.8-27b \ --trust-remote-code \ --max-model-len 262144 \ --gpu-memory-utilization 0.93 \ --max-num-seqs 32 \ --max-num-batched-tokens 16384 \ --kv-cache-dtype fp8 \ --enable-prefix-caching \ --spec-method mtp --spec-tokens 3 \ --reasoning-parser qwen3 \ --enable-auto-tool-choice --tool-call-parser qwen3_coder \ --limit-mm-per-prompt '{"image":{"count":4,"width":1024,"height":1024},"video":0}' Flag Why --max-model-len 262144 The native context window. --gpu-memory-utilization 0.93 Lets vLLM use 93% of the GPU's memory. After the weights, that leaves 1.5 million tokens of KV cache, about 5.7 full-length requests at once. --max-num-seqs 32 Throughput barely grows beyond 32 concurrent requests on this GPU (measured below). --max-num-batched-tokens 16384 The prefill chunk per step. 32K gained nothing and cost 5% of the KV cache. --kv-cache-dtype fp8 Halves the KV cache's memory compared with BF16. --enable-prefix-caching Reuses the KV blocks of a repeated prefix instead of recomputing them. Agentic traffic resends long prefixes, so this matters: 88% of the input tokens in the busy window below came from the cache. --spec-method mtp --spec-tokens 3 Speculative decoding with the model's own MTP layers. vLLM's Qwen3.8 recipe writes the same setting as --speculative-config '{"method":"mtp","num_speculative_tokens":3}' . --reasoning-parser qwen3 Returns the thinking separately from the answer, so clients get a clean reply. --enable-auto-tool-choice --tool-call-parser qwen3_coder OpenAI-style tool calls. --limit-mm-per-prompt Up to four images per prompt, and no video. Step 4: Call it vLLM serves an OpenAI-compatible API, and so does the LiteLLM gateway in front of it, under one stable alias, local-llm , so clients don't change when the model does: curl http://127.0.0.1:4000/v1/chat/completions -H 'Content-Type: application/json' -d '{ "model": "local-llm", "messages": [{"role": "user", "content": "Explain prefix caching in two sentences."}], "temperature": 0.7, "top_p": 0.8, "presence_penalty": 1.5, "chat_template_kwargs": {"enable_thinking": false} }' Thinking is on unless a request turns it off with chat_template_kwargs . Qwen's model card recommends temperature 1.0, top_p 0.95 and top_k 20 with thinking on, and temperature 0.7, top_p 0.8, top_k 20 and presence_penalty 1.5 with it off. Tool calls work as they do with OpenAI: send tools , and the parser turns the model's tool-call markup into tool_calls . The sample's smoke test ( scripts/vm-run.sh scripts/smoke-test.sh ) checks an exact answer, a required tool call and the decode speed. On this VM, one request generates about 166 tokens a second with thinking off. The VM has no public IP, so the gateway is published through an ngrok tunnel with an IP allow-list. The gateway has no authentication of its own, so that allow-list is the only access control on the public URL. That suited my own tests. For anything more, add a LiteLLM key or an authentication policy at the tunnel. Step 5: Tune it Two settings were worth measuring. How many tokens to draft. Speculative decoding drafts tokens with the MTP layers and verifies them in one pass. On natural-language prompts with 512-token replies: Draft tokens 1 2 3 4 One request (tok/s) 105 131 151 146 32 requests (tok/s) 1,497 1,546 1,548 1,342 Three came out on top at both ends. vLLM warns that drafting more than one token reuses the same MTP layer and can lower acceptance, so watch the acceptance rate on the dashboard rather than trusting the setting. How many requests at once. On synthetic 2,000-token prompts, output grows to 32 concurrent requests and then flattens: 150 tokens a second at 1, 821 at 16, 1,187 at 32 and 1,212 at 48, while each stream slows from 150 to 25 tokens a second. On natural text, where more drafts are accepted, 32 requests reach about 1,550 output tokens a second. That's the measured ceiling: 5.6 million output tokens an hour, worth $14.23 an hour at $2.55 per million. Step 6: Monitor it: metrics, logs and traces A self-hosted model has no provider status page. When it's slow, you need to know whether the cause is the queue, the cache, the GPU or the client, and when it's idle, you're still paying for it. Azure Monitor ingests OpenTelemetry natively (generally available since June 2026), so one Application Insights resource can receive all three signals. Create the destination Create an Application Insights resource with OTLP support set to On. That provisions a Log Analytics workspace for logs and traces, an Azure Monitor workspace that stores metrics as Prometheus data, and the data collection endpoint and rule that route OTLP into them. Ingest OTLP data into Azure Monitor with the OpenTelemetry Collector walks through it. On the resource's Overview page, copy the OTLP connection info: the endpoint URLs for traces, logs and metrics, and the data collection rule ID. Give the VM's managed identity the Monitoring Metrics Publisher role on that data collection rule. The collector signs in with Microsoft Entra ID, so you don't have to store a key on the VM. The sample's infra/telemetry-identities.sh creates one identity per region you run in and assigns the role. Point a collector at it One OpenTelemetry Collector (the contrib distribution) runs next to the model and gathers everything: Metrics: it scrapes vLLM's and LiteLLM's Prometheus endpoints and NVIDIA's DCGM exporter for the GPU, and reads host and container statistics. Traces: LiteLLM sends its spans to the collector over OTLP. Each model call is a span with the token counts, time to first token and finish reason as gen_ai.* attributes. Logs: it tails every container's log, plus the host's syslog, where GPU Xid errors and out-of-memory kills appear. The part that talks to Azure Monitor is short (abridged from the sample's observability/otelcol/config.yaml, collector 0.161): extensions: azure_auth: managed_identity: client_id: ${env:TELEMETRY_UAMI_CLIENT_ID} scopes: [https://monitor.azure.com/.default] processors: resource: attributes: - {key: microsoft.applicationId, value: "${env:AZMON_APPLICATION_ID}", action: upsert} exporters: otlp_http/azuremonitor: traces_endpoint: ${env:AZMON_TRACES_ENDPOINT} logs_endpoint: ${env:AZMON_LOGS_ENDPOINT} metrics_endpoint: ${env:AZMON_METRICS_ENDPOINT} auth: authenticator: azure_auth Here's where each signal lands and how you query it: Signal Sources Stored in Query with Metrics vLLM, LiteLLM, GPU (DCGM), host, containers Azure Monitor workspace PromQL Traces LiteLLM request and model-call spans Application Insights (Log Analytics) KQL, or the Application Insights transaction view Logs every container, host syslog Application Insights (Log Analytics) KQL Four things that tripped me up Set microsoft.applicationId on everything you send. The data collection rule that Application Insights creates routes data on that resource attribute, which is why the processor above sets it on every resource. Metrics keep only a few resource attributes. The metrics rule keeps service.* , host.name and cloud.region , and drops the rest, so per-container series merged into one until a transform processor copied the container name onto each data point. The sample does the same for an upstream_model label, so a second model on the same VM shows up as its own series. In logs, fields you want to filter on also belong on the record, not the resource. OTLP histograms arrive as native histograms. histogram_quantile takes the bare metric name, with no _bucket suffix and no le label, and OpenTelemetry-native names keep their dots, so you write {__name__="system.cpu.utilization"} . Check what your spans carry. LiteLLM records the useful parts of each call (token counts, time to first token, finish reason) without prompts or responses when message capture is off. It still records every tool definition the client declares, though. Decide whether that's acceptable in your Application Insights resource, and choose the fields carefully before you share a dashboard. Build the dashboard in Grafana In Azure Managed Grafana, connect the Azure Monitor workspace as a Prometheus data source for the metrics (Connect Grafana to Azure Monitor managed service for Prometheus), and use the built-in Azure Monitor data source for KQL over the logs and traces. If you'd rather not run a Grafana instance, Azure Monitor dashboards with Grafana work in the Azure portal. You don't have to build the dashboard yourself. The one in these screenshots is in the sample repository as h100-llm.json. To use it: In Grafana, go to Dashboards > New > Import and upload the file. When it asks, enter your Application Insights resource ID. At the top of the dashboard, pick your Azure Monitor workspace's Prometheus data source and your Azure Monitor data source. It has ten rows: overview, token economics, throughput, the gateway, traffic and latency, cache and scheduling, the GPU, host and containers, the telemetry pipeline itself, and traces and logs. These are the questions I look at first: Question PromQL How long until the first token? histogram_quantile(0.95, sum(rate(vllm:time_to_first_token_seconds[5m]))) How fast does one request generate? 1 / histogram_quantile(0.5, sum(rate(vllm:inter_token_latency_seconds[5m]))) Is the KV cache full? max(vllm:kv_cache_usage_perc) : near 1, vLLM starts preempting requests Are requests queuing? sum(vllm:num_requests_waiting) next to sum(vllm:num_requests_running) Is prefix caching working? sum(rate(vllm:prefix_cache_hits_total[5m])) / sum(rate(vllm:prefix_cache_queries_total[5m])) Is speculative decoding paying off? sum(rate(vllm:spec_decode_num_accepted_tokens_total[5m])) / sum(rate(vllm:spec_decode_num_draft_tokens_total[5m])) Is the GPU doing work? max(dcgm_fi_prof_sm_active) Metrics tell you that something is slow. Traces and logs tell you which request and why. The dashboard's last row has both. LLM calls lists one row per model call from the LiteLLM spans, with its time to first token, input tokens, finish reason and trace ID. Model server log shows vLLM's own log lines: the engine stats it prints every ten seconds (throughput, running and waiting requests, KV cache usage, prefix cache hit rate) and any warning. There's one more step I haven't taken yet: vLLM can export its own spans over OTLP with --otlp-traces-endpoint , and NVIDIA's container already includes the OpenTelemetry SDK. Pointed at the same collector, that would add vLLM's own timing for each request, such as time in the queue, next to the gateway's spans. Change the dashboard and ask the data with an agent You don't have to edit dashboard JSON or write every query by hand. Azure Managed Grafana instances in the Azure public cloud include a remote MCP server at https://<grafana-endpoint>/api/azure-mcp (Configure an Azure Managed Grafana Remote MCP server). Connect an MCP client to it, and an AI agent can work with this dashboard and the telemetry behind it. GitHub Copilot in Visual Studio Code signs in with Microsoft Entra ID; Claude Code and other clients can use a Grafana service account token. Author and change dashboards. amgmcp_dashboard_inspect reads a dashboard's panels, variables and queries, and amgmcp_dashboard_update creates a dashboard or patches one panel, query or title at a time. A request such as "add a panel for preemptions per minute next to KV cache usage" becomes a targeted patch instead of a JSON edit. Query the telemetry. amgmcp_prometheus_query runs PromQL against the Azure Monitor workspace, amgmcp_query_resource_log runs KQL against Application Insights, and amgmcp_query_application_insights_trace fetches a trace. Questions like "which requests waited longest for their first token this morning?" or "how many output tokens did the model generate per VM hour this week?" come back with numbers from the same data the dashboard shows. The agent acts with the Grafana permissions of the identity it signs in with, so give that identity the role the job needs: Grafana Viewer to ask questions, Grafana Editor to change dashboards. My previous post, Dashboards are for AI agents too, not just humans, shows the other half: how an agent uses a dashboard's queries and descriptions as context. What the dashboard showed The traffic in these screenshots is a real agentic workload: long-running sessions that call tools and send the whole conversation back with each request. In the busy window it looked nothing like the benchmark: Prompts were long. The median request carried about 120,000 input tokens, and the 95th percentile 186,000. Most of it was cached. 88% of input tokens were prefix-cache hits. Output was small. There were 133 input tokens for every output token, and 62% of the output tokens were reasoning. Concurrency was low. At most 10 requests ran at once, with room for 32. Output averaged 117 tokens a second, under 8% of the 1,550 ceiling, yet the GPU was busy 77% of the time. The work went into prefill (19.9 million computed input tokens in three hours) and into attention over contexts of 100,000 tokens and more. A single request saw about 34 tokens a second at the median, not 166. Long contexts also fill the KV cache with only a few requests. Around 08:00 the cache reached 88.6%, and at the same moment the 95th-percentile time to first token jumped to 2.6 minutes: new requests were waiting for memory, not compute. The traces show it request by request, with 200,000-token prompts waiting 40 seconds or more for their first token. About 60 of the window's 64 failed requests were prompts that had outgrown the 262K-token context window, which is where the dashboard's 4.47% error rate comes from. Measure the shape of your own traffic, not the shape of a benchmark. For this workload the numbers that matter are prefill throughput, the cache hit rate and how many long contexts fit in memory at once. Spot, honestly Here is what one VM met in its first week: # Region (eviction-rate bucket) Ran before eviction 1 West US 3 (5–10%) about a minute, just after a restart 2 West US 3 (5–10%) 2 h 01 min 3 West US 3 (5–10%) 2 h 16 min 4 UK South (0–5%) 2 h 36 min 5 UK South (0–5%) 5 h 34 min 6 North Europe (0–5%) 8 h 28 min 7 UAE North (0–5%) 2 h 58 min Seven evictions in about 40 hours of running, and five attempts to create or restart a VM in UK South that failed for lack of capacity. An eviction deallocates the VM with the model still on its disk, so a restart in place brings the stack back in a few minutes once capacity returns. I pick regions with two public data sources, which infra/spot-regions.sh combines: The SpotResources table in Azure Resource Graph has the eviction-rate bucket and recent Spot price history for each size and region. Spot Placement Score rates how likely a Spot request is to succeed right now, per zone, and shows zones where the size is restricted for your subscription. It needs the Compute Recommendations Role. region eviction usd/h since min-max northeurope 0-5 1.55 2026-02 1.55-1.55 uksouth 0-5 1.61 2026-09 1.61-2.06 southeastasia 0-5 1.68 2026-09 1.68-2.28 ... Region Zone Score QuotaAvailable southeastasia 1 Low True southeastasia 2 Low True southeastasia 3 RestrictedSkuNotAvailable True My rule is the lowest eviction bucket, then the lower price, then a zone that isn't restricted. For this size the placement score was Low in almost every unrestricted zone I checked, all week. Low isn't a refusal, though: VMs scored Low in West US 3, North Europe, UAE North and Southeast Asia all allocated on the first try. Two things I got wrong at first: The eviction rate is per hour. Microsoft Learn describes the eviction rate in the portal as the chance of being evicted within the next hour, based on recent history. At 5% an hour, an eight-hour run has roughly a one-in-three chance of being evicted. Read 0–5% as "plan for evictions", not "evictions are rare". Changing zones didn't change much. The first five evictions were all in zone 1, so I moved to other zones. North Europe zone 3 and UAE North zone 2 were evicted too. Spot fits workloads that can wait for a restart. For steady serving, request quota for regular capacity and drop the Spot flags: the same scripts work, at the regular price. Does it pay off? The token economics row at the top of this post turns the dashboard into a running answer. VM hours are the minutes in which the collector could scrape vLLM, so stopped or evicted time doesn't count. The prices are dashboard variables: the VM's hourly price and the per-million prices for input, cached input and output, defaulting to the list prices above. Every stat is an instant query, so after an eviction it reads "Off" instead of holding its last value. Over the busiest three hours it reads $8.12 of tokens per VM hour, about four times the VM's price. Over the first week it's a different story: Busiest 3 hours (Oct 9, 05:35–08:35 UTC) First week (Oct 3–10) Hours the model server was up 3.0 37.9 Requests 1,434 5,469 Input tokens (share served from the prefix cache) 168.7M (88%) 564.2M (88%) Output tokens 1.27M 6.11M Worth at the list price $24.35 $85.94 Per hour the model server was up $8.12 $2.27 The VMs actually ran about 46 hours that week, counting setup, model loading, benchmarks and the first runs before the telemetry existed. At each region's Spot price that was about $98 of compute, plus a little for disks and the NAT gateway, against $86 of tokens. The first nine and a half hours ran in West US 3 at $3.95 an hour, before I started choosing regions with the data above; the rest averaged $1.67 an hour. Look at where the value comes from, too. In the busy window, cached input brought in 52% of it ($12.65), computed input 35% ($8.48) and output only 13% ($3.23). Benchmarks measure output tokens per second, but for this workload output was less than a fifth of the value. So the answer to the title is: it pays off when it's busy. At $8.12 of tokens per busy hour against about $2 of VM, the H100 needs to be busy roughly a quarter of the time to break even, and it can't earn while it's evicted, loading or idle. Self-hosting on an H100 Spot VM makes sense when: traffic is steady and its prompts share long prefixes, which is where prefix caching makes input cheap to serve you want control over the exact checkpoint, the serving flags and where requests go the workload tolerates an occasional restart, or you pay for regular capacity It makes less sense for bursty traffic that leaves the GPU idle most of the day, or for anything that needs an SLA on a Spot VM. Try it Sample code: wuyi-labs/2610-h100-qwen-38-27b has everything in this post: provisioning, the host bootstrap, the Compose stack, the collector configuration, the smoke test and benchmarks, and spot-regions.sh. The dashboard: h100-llm.json, ready to import into Azure Managed Grafana. The sample's README has the import steps. The model: Qwen3.8-27B on Hugging Face and vLLM's Qwen3.8-27B recipe. Monitoring: Ingest OTLP data into Azure Monitor with the OpenTelemetry Collector, Connect Grafana to Azure Monitor managed service for Prometheus, and, for AI coding agents rather than the model behind them, Monitor AI coding agents with Grafana. Agents: the Azure Managed Grafana MCP server, to change dashboards and query telemetry from an AI agent. Spot: Azure Spot Virtual Machines, Linux VM pricing and Spot Placement Score. Then keep it busy.245Views1like0Comments