github copilot
45 TopicsLessons Learned #560: SQL Is Slow — What Can Query Store and SSMS Copilot Uncover?
In our recently delivered session, “SQL Is Slow — What Can Query Store and SSMS Copilot Uncover?”, we demonstrated step by step how to investigate a performance problem by combining Query Store with Copilot’s capabilities in SSMS. The demonstration starts with a PHP program executing queries while we grow a table from a few hundred to millions of rows. As different execution plans appear and performance changes, we follow the evidence in Query Store to uncover what is happening and decide what to investigate next. One clue stood out. The query took about 12 milliseconds per execution in one interval and almost 2.5 seconds in another interval under the same Plan ID. Other plans appeared during the complete lab. Understanding both the differences between plans and the changes within a plan became part of the investigation. Along the way, we demonstrated how a guided conversation with Copilot can become an Agent investigation, and how the investigation itself can be captured in a reusable skill. The useful result was a method that keeps asking for evidence before accepting an explanation. The session brings the two tools together: Query Store supplies the recorded history, and Copilot helps us examine it and decide what to investigate next. The same troubleshooting story lets the audience follow Ask mode, Agent mode and the reusable skill without losing the connection to the underlying SQL evidence. A growing table and several execution plans For our sessions, we use a PHP program that generates 16 different simulations of performance and connectivity problems, allowing us to demonstrate how to investigate these scenarios through practical demos. We also have code developed in .NET and Java. In this demonstration, we add records to dbo.Notes in stages, reaching approximately 200, 32,000, 65,000, 2 million, and 4 million rows, while the PHP program executes dbo.GiveNotes with different @N values. This lets us observe how performance and execution plans evolve as the data volume grows. Several execution plans accumulated during the complete demonstration. We compared all of them, then inspected the runtime intervals within each Plan ID. The reference run revealed this change within the history of one plan: Average per execution Healthy interval Degraded interval Approximate increase CPU 7.69 ms 1,443.19 ms 188 times Duration 12.39 ms 2,473.68 ms 200 times Logical reads 68.39 12,233.10 179 times The duration increase was approximately 200 times. This comparison covers two intervals for one Plan ID, not the whole sequence of table sizes. It does not assign a particular plan or timing to each row-count stage. These are lab observations; identifiers and timings vary between runs. The reads were particularly revealing. Each execution was touching far more pages. A later plan change could not, by itself, explain degradation that had already started while the earlier plan remained in use. The next step was to investigate what had increased the work per execution. Build the timeline before choosing the explanation We first compared workload contributors using total CPU, elapsed duration, logical reads and execution count. Total consumption identified where the workload impact was concentrated; averages per execution helped distinguish expensive executions from a high volume of individually inexpensive calls. Next, we collected every plan for the selected query and compared runtime intervals chronologically. We discovered the identifiers from the database instead of supplying fixed Query IDs or Plan IDs. We asked both when another plan appeared and whether the cost had already increased before that change. A plan summary alone can hide this story. One average across a plan’s entire history blends its healthy and degraded periods. The interval history shows when the work changed and whether that happened before another plan appeared. Aggregation mattered. When combining runtime statistics, we weighted each average by its execution count. A simple average of interval averages would give a lightly used interval the same influence as a heavily used one. We also kept units explicit and separated execution types where needed. Weighted average = SUM(average value * execution count) / SUM(execution count) The increase in logical reads directed the investigation toward the amount of data processed and the access path. Waits could help explain elapsed time, but waits alone would not explain that increase in reads. dbo.GiveNotes filtered dbo.Notes on ID < @N and grouped by Name. The clustered primary key was on id2, a different column from the predicate. As rows were added, a reused plan could process more data; changing @N could also change how many rows qualified. A new Plan ID was a separate event to investigate, not an explanation to assume. Different @N values can qualify different numbers of rows, and table growth can increase the work even with an unchanged plan. We inspected distribution, statistics and access paths to test that explanation. Query Store interval averages alone do not tell us the parameter used by every execution, and parameter-sensitive behavior does not automatically prove parameter sniffing. One investigation through three Copilot experiences In Ask mode, we guided the conversation one question at a time. We first requested the Query Store overview, then asked which contributor to investigate and how its plans behaved over time. The staged prompts delayed statistics, index and parameter analysis until the runtime evidence justified those questions. Where required, we ran generated diagnostic T-SQL and brought the results back into the conversation. In Agent mode, we supplied the investigation goal and allowed Copilot to choose and execute diagnostic steps using the available SQL tools. We reviewed the proposed actions and kept the investigation read-only. The agent could use each result to decide what to inspect next. Finally, we captured the sequence in an Agent Skill. We wanted the next investigation to preserve the critical question: did the query become more expensive while the same plan was still being reused? Agent Skills provide task-specific instructions that Copilot can discover and use in Agent mode. We also demonstrated the reusable method through GitHub Copilot CLI. Database execution still requires a configured SQL tool or MCP server; without that capability, the workflow must generate diagnostics for the engineer to run. What we put into the reusable skill The SQL Performance Investigator pack captures the diagnostic sequence alongside the calculation rules and starting prompts. The agent is instructed to: Identify the main workload contributor and retain its Query ID. Collect all associated plans and their runtime history. Check whether degradation began while the same plan remained in use. Investigate relevant selectivity, statistics and index evidence. Separate confirmed observations from hypotheses and propose validation. A skill makes the method reusable; it does not guarantee the diagnosis is correct. Missing history, incorrect aggregation or a plausible but unsupported inference still need an engineer’s attention. We kept discovery read-only, with SQL permissions enforcing the access boundary. A proposed index still needs evidence of improvement In the demonstration, we evaluated an index with ID as its leading key and Name as an included column: CREATE NONCLUSTERED INDEX NOTES_IX1 ON dbo.Notes (ID) INCLUDE (Name); The key matches the range predicate, while the included column makes Name available for the aggregation. Whether this improves the workload depends on selectivity, data volume and the competing plans. Its storage and write costs also matter. We treated this as a remediation candidate. Validation requires a comparable workload, including parameter distribution and concurrency, followed by a Query Store comparison of reads, CPU, duration and variability. We did not equate an index recommendation with a demonstrated improvement. Statistics also need careful interpretation. An index histogram describes its leading key; adding Name as an INCLUDE column does not create a histogram on Name. An existing auto-created statistic should not be dropped merely because its column appears in a covering index. The lesson we took from the demonstration The complete story contained a growing table and multiple plans. Within that history, one plan became much more expensive before a later plan could explain the change. Comparing plans and examining changes within each plan gave us complementary evidence. Copilot helped us follow it, and the skill preserved the investigation sequence for another database. We enjoyed presenting this session. For DBAs, developers and support engineers, the session offers a practical way to watch a performance investigation unfold, from the PHP workload and Query Store history to the prompts and reusable skill. We look forward to continuing this demonstration and discussion with SQL user groups and the wider technical community. If you have encountered a query that became slower while the same plan remained in use, which evidence helped you explain the change? We would be interested to hear how you approached it. References and prerequisites For the SSMS Agent and Skills experience described here, Microsoft documents SSMS 22.7 or later with the AI Assistance workload and GitHub Copilot access. Query Store must be enabled with relevant history available. Specify the target server and database in the Agent prompt rather than relying on the active editor context. Check the current documentation before reproducing the session. GitHub Copilot Agent mode in SSMS Agent Skills in SSMS Monitoring performance by using Query Store Query Store runtime statistics Try the investigation with our prompts These prompts offer a practical starting point for the method demonstrated in our session. The Ask prompt is the opening prompt from our session workflow. The Agent prompts are adapted from our accompanying pack to make the target server, database and investigation window explicit. Replace the angle-bracket placeholders before submitting them. Start with Ask mode We began with a request for evidence, deliberately postponing diagnosis. Run the generated diagnostic query against the intended lab database and use its results for the next questions. I want to start a SQL performance troubleshooting investigation using Query Store. Generate a single read-only T-SQL query that I can execute in the current database to identify the main performance contributors. The query must use Query Store and return, for each query: * Query ID * Query text * Object or stored procedure name, when available * Number of execution plans * Number of executions * Total CPU time * Average CPU time per execution * Total duration * Average duration per execution * Total logical reads * Average logical reads per execution Aggregate Query Store runtime statistics correctly across runtime intervals and execution plans. Use weighted calculations based on count_executions. Do not calculate averages by simply averaging Query Store average values. Return CPU and duration values in milliseconds. Rank the results by total CPU consumption, but include all the metrics above so that we can determine later which resource is having the highest impact. Do not perform root-cause analysis yet. Do not include execution plan analysis, parameter sensitivity, statistics analysis, index analysis, or remediation recommendations. Only generate the read-only diagnostic T-SQL query that I should execute. We then asked which resource deserved investigation, which query contributed most, how all its plans performed over time, and whether the same Plan ID had become more expensive. Only after those answers did we investigate selectivity, statistics and indexes. The complete session workflow contains the staged follow-up prompts. Convert the conversation into an Agent investigation We moved the recurring calculation rules and diagnostic sequence into sql-performance-investigator. The starting prompt could then state the goal, scope and execution boundaries. The skill supplies the detailed method; the available SQL tools supply execution capability. The agent retains the discovered query and plan identifiers within the investigation. It should not ask the engineer to copy them between steps or assume the identifiers from a previous lab run. Run the method in SSMS Agent mode Make the skill available to SSMS, select Agent mode and verify the SQL tools are enabled. Specify the target explicitly because Agent mode does not inherit the active query editor context. Investigate the SQL performance problem on server <server>, database <database>, using Query Store for <UTC start> to <UTC end>. Use the sql-performance-investigator skill. Use the available sql-tools to execute read-only diagnostics and continue through the investigation, requesting approval where the host requires it. Automatically discover the dominant performance metric, target query, Query ID, all Plan IDs, runtime history, and any same-plan degradation. Retain the discovered identifiers internally. Investigate the evidence needed to explain the change, including selectivity, data distribution, statistics and existing indexes when relevant. Do not assume a plan change caused the degradation or label it parameter sniffing without evidence. Keep confirmed evidence, inference, hypotheses and missing evidence separate. Use execution-weighted averages and explicit units. If the requested history or permissions are unavailable, report the limitation. Do not create/drop indexes, update/drop statistics, force plans, clear caches, modify Query Store, or change data/schema. Finish with a supported diagnosis or remaining uncertainty, a proposed remediation if justified, and a Query Store before/after validation plan. Do not execute remediation. Use the same method in GitHub Copilot Our pack places the skill at .github/skills/sql-performance-investigator/SKILL.md and the Custom Agent at .github/agents/sql-performance-investigator.agent.md. The skill references workflow.md and query-store-rules.md for the detailed method. In GitHub Copilot CLI, select the SQL Performance Investigator custom agent and use this adapted starting prompt: Use the SQL Performance Investigator custom agent and the sql-performance-investigator skill. Investigate SQL performance on <server>, database <database>, for <UTC start> to <UTC end>, using Query Store from evidence to diagnosis. If a SQL execution tool/MCP is available, run only read-only diagnostics and continue through the investigation. Discover Query IDs and Plan IDs automatically and retain them internally. Follow the host approval requirements. If no SQL execution capability is available, generate one self-contained read-only diagnostic batch for me to run, then continue when I provide the result. Do not claim that SQL was executed. Do not apply remediation. Propose an index/statistics action only after the evidence supports it. Finish with a before/after Query Store validation plan. The reusable asset is the investigation procedure behind these prompts. Query Store supplies the evidence, Copilot helps carry out the investigation, and the engineer reviews whether the explanation and proposed change are supported by the results.Build an AI-Powered Space Invaders Game
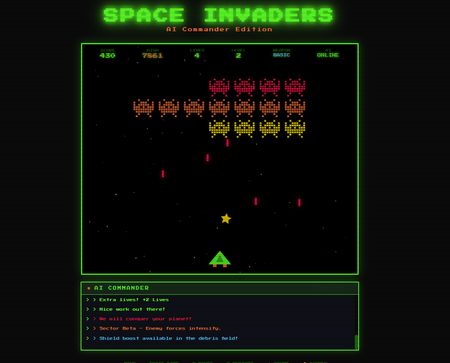
Build an AI-Powered Space Invaders Game: Integrating LLMs into HTML5 Games with Microsoft Foundry Local Introduction What if your game could talk back to you? Imagine playing Space Invaders while an AI commander taunts you during battle, delivers personalized mission briefings, and provides real-time feedback based on your performance. This isn't science fiction it's something you can build today using HTML, JavaScript, and a locally-running AI model. In this tutorial, we'll explore how to create an HTML5 game with integrated Large Language Model (LLM) features using Microsoft Foundry Local. You'll learn how to combine classic game development with modern AI capabilities, all running entirely on your own machine—no cloud services, no API costs, no internet connection required during gameplay. We'll be working with the Space Invaders - AI Commander Edition project, which demonstrates exactly how to architect games that leverage local AI. Whether you're a student learning game development, exploring AI integration patterns, or building your portfolio, this guide provides practical, hands-on experience with technologies that are reshaping how we build interactive applications. What You'll Learn By the end of this tutorial, you'll understand how to combine traditional web development with local AI inference. These skills transfer directly to building chatbots, interactive tutorials, AI-enhanced productivity tools, and any application where you want intelligent, context-aware responses. Set up Microsoft Foundry Local for running AI models on your machine Understand the architecture of games that integrate LLM features Use GitHub Copilot CLI to accelerate your development workflow Implement AI-powered game features like dynamic commentary and adaptive feedback Extend the project with your own creative AI features Why Local AI for Games? Before diving into the code, let's understand why running AI locally matters for game development. Traditional cloud-based AI services have limitations that make them impractical for real-time gaming experiences. Latency is the first challenge. Cloud API calls typically take 500ms to several seconds, an eternity in a game running at 60 frames per second. Local inference can respond in tens of milliseconds, enabling AI responses that feel instantaneous and natural. When an enemy ship appears, your AI commander can taunt you immediately, not three seconds later. Cost is another consideration. Cloud AI services charge per token, which adds up quickly when generating dynamic content during gameplay. Local models have zero per-use cost, once installed, they run entirely on your hardware. This frees you to experiment without worrying about API bills. Privacy and offline capability complete the picture. Local AI keeps all data on your machine, perfect for games that might handle player information. And since nothing requires internet connectivity, your game works anywhere, on planes, in areas with poor connectivity, or simply when you want to play without network access. Understanding Microsoft Foundry Local Microsoft Foundry Local is a runtime that enables you to run small language models (SLMs) directly on your computer. It's designed for developers who want to integrate AI capabilities into applications without requiring cloud infrastructure. Think of it as having a miniature AI assistant living on your laptop. Foundry Local handles the complex work of loading AI models, managing memory, and processing inference requests through a simple API. You send text prompts, and it returns AI-generated responses, all happening locally on your CPU or GPU. The models are optimized to run efficiently on consumer hardware, so you don't need a supercomputer. For our Space Invaders game, Foundry Local powers the "AI Commander" feature. During gameplay, the game sends context about what's happening, your score, accuracy, current level, enemies remaining and receives back contextual commentary, taunts, and encouragement. The result feels like playing alongside an AI companion who actually understands the game. Setting Up Your Development Environment Let's get your machine ready for AI-powered game development. We'll install Foundry Local, clone the project, and verify everything works. The entire setup takes about 10-15 minutes. Step 1: Install Microsoft Foundry Local Foundry Local installation varies by operating system. Open your terminal and run the appropriate command: # Windows (using winget) winget install Microsoft.FoundryLocal # macOS (using Homebrew) brew install microsoft/foundrylocal/foundrylocal These commands download and install the Foundry Local runtime along with a default small language model. The installation includes everything needed to run AI inference locally. Verify the installation by running: foundry --version If you see a version number, Foundry Local is ready. If you encounter errors, ensure you have administrator/sudo privileges and that your package manager is up to date. Step 2: Install Node.js (If Not Already Installed) Our game's AI features require a small Node.js server to communicate between the browser and Foundry Local. Check if Node.js is installed: node --version If you see a version number (v16 or higher recommended), you're set. Otherwise, install Node.js: # Windows winget install OpenJS.NodeJS.LTS # macOS brew install node # Linux sudo apt install nodejs npm Node.js provides the JavaScript runtime that powers our proxy server, bridging browser code with the local AI model. Step 3: Clone the Project Get the Space Invaders project onto your machine: git clone https://github.com/leestott/Spaceinvaders-FoundryLocal.git cd Spaceinvaders-FoundryLocal This downloads all game files, including the HTML interface, game logic, AI integration module, and server code. Step 4: Install Dependencies and Start the Server Install the Node.js packages and launch the AI-enabled server: npm install npm start The first command downloads required packages (primarily for the proxy server). The second starts the server, which listens for AI requests from the game. You should see output indicating the server is running on port 3001. Step 5: Play the Game Open your browser and navigate to: http://localhost:3001 You should see Space Invaders with "AI: ONLINE" displayed in the game HUD, indicating that AI features are active. Use arrow keys or A/D to move, SPACE to fire, and P to pause. The AI Commander will start providing commentary as you play! Understanding the Project Architecture Now that the game is running, let's explore how the different pieces fit together. Understanding this architecture will help you modify the game and apply these patterns to your own projects. The project follows a clean separation of concerns, with each file handling a specific responsibility: Spaceinvaders-FoundryLocal/ ├── index.html # Main game page and UI structure ├── styles.css # Retro arcade visual styling ├── game.js # Core game logic and rendering ├── llm.js # AI integration module ├── sound.js # Web Audio API sound effects ├── server.js # Node.js proxy for Foundry Local └── package.json # Project configuration index.html: Defines the game canvas and UI elements. It's the entry point that loads all other modules. game.js: Contains the game loop, physics, collision detection, scoring, and rendering logic. This is the heart of the game. llm.js: Handles all communication with the AI backend. It formats game state into prompts and processes AI responses. server.js: A lightweight Express server that proxies requests between the browser and Foundry Local. sound.js: Synthesizes retro sound effects using the Web Audio API—no audio files needed! How the AI Integration Works The magic of the AI Commander happens through a simple but powerful pattern. Let's trace the flow from gameplay event to AI response. When something interesting happens in the game, you clear a wave, achieve a combo, or lose a life, the game logic in game.js triggers an AI request. This request includes context about the current game state: your score, accuracy percentage, current level, lives remaining, and what just happened. The llm.js module formats this context into a prompt. For example, when you clear a wave with 85% accuracy, it might construct: You are an AI Commander in a Space Invaders game. The player just cleared wave 3 with 85% accuracy. Score: 12,500. Lives: 3. Provide a brief, enthusiastic comment (1-2 sentences). This prompt travels to server.js , which forwards it to Foundry Local. The AI model processes the prompt and generates a response like: "Impressive accuracy, pilot! Wave 3 didn't stand a chance. Keep that trigger finger sharp!" The response flows back through the server to the browser, where llm.js passes it to the game. The game displays the message in the HUD, creating the illusion of playing alongside an AI companion. This entire round trip typically completes in 50-200 milliseconds, fast enough to feel responsive without interrupting gameplay. Using GitHub Copilot CLI to Explore and Modify the Code GitHub Copilot CLI accelerates your development workflow by letting you ask questions and generate code directly in your terminal. Let's use it to understand and extend the Space Invaders project. Installing Copilot CLI If you haven't installed Copilot CLI yet, here's the quick setup: # Install GitHub CLI winget install GitHub.cli # Windows brew install gh # macOS # Authenticate with GitHub gh auth login # Add Copilot extension gh extension install github/gh-copilot # Verify installation gh copilot --help With Copilot CLI ready, you can interact with AI directly from your terminal while working on the project. Exploring Code with Copilot CLI Use Copilot to understand unfamiliar code. Navigate to the project directory and try: gh copilot explain "How does llm.js communicate with the server?" Copilot analyzes the code and explains the communication pattern, helping you understand the architecture without reading every line manually. You can also ask about specific functions: gh copilot explain "What does the generateEnemyTaunt function do?" This accelerates onboarding to unfamiliar codebases, a valuable skill when working with open source projects or joining teams. Generating New Features Want to add a new AI feature? Ask Copilot to help generate the code: gh copilot suggest "Create a function that asks the AI to generate a mission briefing at the start of each level, including the level number and a random mission objective" Copilot generates starter code that you can customize and integrate. This combination of AI-powered development tools and AI-integrated gameplay demonstrates how LLMs are transforming both how we build games and how games behave. Customizing the AI Commander The default AI Commander provides generic gaming commentary, but you can customize its personality and responses. Open llm.js to find the prompt templates that control AI behavior. Changing the AI's Personality The system prompt defines who the AI "is." Find the base prompt and modify it: // Original const systemPrompt = "You are an AI Commander in a Space Invaders game."; // Customized - Drill Sergeant personality const systemPrompt = `You are Sergeant Blaster, a gruff but encouraging drill sergeant commanding space cadets. Use military terminology, call the player "cadet," and be tough but fair.`; // Customized - Supportive Coach personality const systemPrompt = `You are Coach Nova, a supportive and enthusiastic gaming coach. Use encouraging language, celebrate small victories, and provide gentle guidance when players struggle.`; These personality changes dramatically alter the game's feel without changing any gameplay code. It's a powerful example of how AI can add variety to games with minimal development effort. Adding New Commentary Triggers Currently the AI responds to wave completions and game events. You can add new triggers in game.js : // Add AI commentary when player achieves a kill streak if (killStreak >= 5 && !streakCommentPending) { requestAIComment('killStreak', { count: killStreak }); streakCommentPending = true; } // Add AI reaction when player narrowly avoids death if (nearMissOccurred) { requestAIComment('nearMiss', { livesRemaining: lives }); } Each new trigger point adds another opportunity for the AI to engage with the player, making the experience more dynamic and personalized. Understanding the Game Features Beyond AI integration, the Space Invaders project demonstrates solid game development patterns worth studying. Let's explore the key features. Power-Up System The game includes eight different power-ups, each with unique effects: SPREAD (Orange): Fires three projectiles in a spread pattern LASER (Red): Powerful beam with high damage RAPID (Yellow): Dramatically increased fire rate MISSILE (Purple): Homing projectiles that track enemies SHIELD (Blue): Grants an extra life EXTRA LIFE (Green): Grants two extra lives BOMB (Red): Destroys all enemies on screen BONUS (Gold): Random score bonus between 250-750 points Power-ups demonstrate state management, tracking which power-up is active, applying its effects to player actions, and handling timeouts. Study the power-up code in game.js to understand how temporary state modifications work. Leaderboard System The game persists high scores using the browser's localStorage API: // Saving scores localStorage.setItem('spaceInvadersScores', JSON.stringify(scores)); // Loading scores const savedScores = localStorage.getItem('spaceInvadersScores'); const scores = savedScores ? JSON.parse(savedScores) : []; This pattern works for any data you want to persist between sessions—game progress, user preferences, or accumulated statistics. It's a simple but powerful technique for web games. Sound Synthesis Rather than loading audio files, the game synthesizes retro sound effects using the Web Audio API in sound.js . This approach has several benefits: no external assets to load, smaller project size, and complete control over sound parameters. Examine how oscillators and gain nodes combine to create laser sounds, explosions, and victory fanfares. This knowledge transfers directly to any web project requiring audio feedback. Extending the Project: Ideas for Students Ready to make the project your own? Here are ideas ranging from beginner-friendly to challenging, each teaching valuable skills. Beginner: Customize Visual Theme Modify styles.css to create a new visual theme. Try changing the color scheme from green to blue, or create a "sunset" theme with orange and purple gradients. This builds CSS skills while making the game feel fresh. Intermediate: Add New Enemy Types Create a new enemy class in game.js with different movement patterns. Perhaps enemies that move in sine waves, or boss enemies that take multiple hits. This teaches object-oriented programming and game physics. Intermediate: Expand AI Interactions Add new AI features like: Pre-game mission briefings that set up the story Dynamic difficulty hints when players struggle Post-game performance analysis and improvement suggestions AI-generated names for enemy waves Advanced: Multiplayer Commentary Modify the game for two-player support and have the AI provide play-by-play commentary comparing both players' performance. This combines game networking concepts with advanced AI prompting. Advanced: Voice Integration Use the Web Speech API to speak the AI Commander's responses aloud. This creates a more immersive experience and demonstrates browser speech synthesis capabilities. Troubleshooting Common Issues If something isn't working, here are solutions to common problems. "AI: OFFLINE" Displayed in Game This means the game can't connect to the AI server. Check that: The server is running ( npm start shows no errors) You're accessing the game via http://localhost:3001 , not directly opening the HTML file Foundry Local is installed correctly ( foundry --version works) Server Won't Start If npm start fails: Ensure you ran npm install first Check that port 3001 isn't already in use by another application Verify Node.js is installed ( node --version ) AI Responses Are Slow Local AI performance depends on your hardware. If responses feel sluggish: Close other resource-intensive applications Ensure your laptop is plugged in (battery mode may throttle CPU) Consider that first requests may be slower as the model loads Key Takeaways Local AI enables real-time game features: Microsoft Foundry Local provides fast, free, private AI inference perfect for gaming applications Clean architecture matters: Separating game logic, AI integration, and server code makes projects maintainable and extensible AI personality is prompt-driven: Changing a few lines of prompt text completely transforms how the AI interacts with players Copilot CLI accelerates learning: Use it to explore unfamiliar code and generate new features quickly The patterns transfer everywhere: Skills from this project apply to chatbots, assistants, educational tools, and any AI-integrated application Conclusion and Next Steps You've now seen how to integrate AI capabilities into a browser-based game using Microsoft Foundry Local. The Space Invaders project demonstrates that modern AI features don't require cloud services or complex infrastructure, they can run entirely on your laptop, responding in milliseconds. More importantly, you've learned patterns that extend far beyond gaming. The architecture of sending context to an AI, receiving generated responses, and integrating them into user experiences applies to countless applications: customer support bots, educational tutors, creative writing tools, and accessibility features. Your next step is experimentation. Clone the repository, modify the AI's personality, add new commentary triggers, or build an entirely new game using these patterns. The combination of GitHub Copilot CLI for development assistance and Foundry Local for runtime AI gives you powerful tools to bring intelligent applications to life. Start playing, start coding, and discover what you can create when your games can think. Resources Space Invaders - AI Commander Edition Repository - Full source code and documentation Play Space Invaders Online - Try the basic version without AI features Microsoft Foundry Local Documentation - Official installation and API guide GitHub Copilot CLI Documentation - Installation and usage guide GitHub Education - Free developer tools for students Web Audio API Documentation - Learn about browser sound synthesis Canvas API Documentation - Master HTML5 game rendering1KViews0likes3CommentsTurn conversations into code with GitHub Copilot in Microsoft Teams
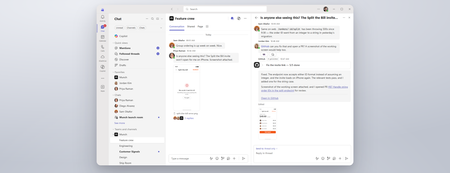
Coding where context lives and collaboration happens The best prompt may be the conversation your team has already had or is currently having. Until now, using a coding agent often meant paying context and coordination taxes. Developers had to leave the discussion, open another tool, and reconstruct the problem in a lengthy prompt: what happened, what the team decided, which constraints matter, and what needs to be built. With GitHub Copilot in Teams, teams can move directly from conversation to action. @mention GitHub Copilot when the team is ready to act, and it can use the conversation alongside repository context to understand the request, implement the change, and create a pull request for review. This makes working with a coding agent more collaborative and visible. Instead of one developer privately reconstructing the request, teammates can contribute context, correct assumptions, refine the approach in real time, and review the resulting work together. Let’s explore the new GitHub Copilot in Teams experience to see how it can streamline development tasks: If the player doesn’t load, open the video in a new window: Open video GitHub Copilot in Teams is available in Teams channels, group chats, meeting chats, and 1:1 chats. Once the GitHub app is installed and added to the conversation, @-mention GitHub Copilot to bring it into the discussion and start a task. During public preview, users can complete the following scenarios with GitHub Copilot in Teams: Build a feature based on requirements discussed in Teams Implement a fix for a bug Expand test coverage or improve documentation Create and update a pull request No copying the discussion into a CLI. No rewriting it in a desktop app. No asking one developer to translate a team decision into the perfect prompt. GitHub Copilot works where the context already lives, and because that context is shared, working with GitHub Copilot becomes a team activity. Built around the controls teams already use GitHub Copilot in Teams works within existing GitHub permissions and repository policies. Branch protections and required reviews continue to apply, and people remain responsible for deciding what gets merged, ensuring that humans stay in the loop at every step. Availability GitHub Copilot in Teams is now available in Public Preview. To try it, install the GitHub app for Microsoft Teams and check out our documentation to get started! Less context reconstruction. More progress from the conversations already happening.4.5KViews0likes1Comment
One agent, three runtimes: porting a CSA agent to Microsoft Scout and Foundry Local
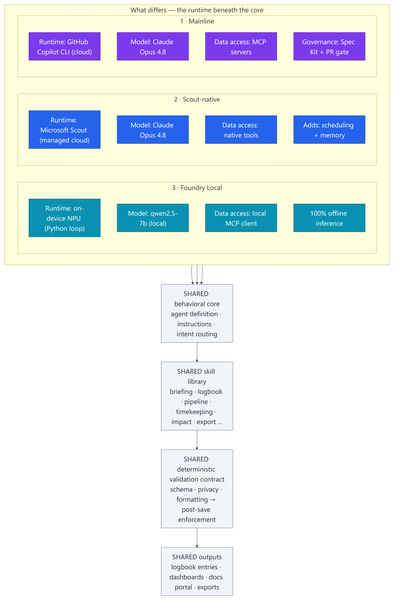
Most of my posts here are about Azure infrastructure lessons from customer engagements. This one is a little different — it's a real‑world engineering lesson from something I built to run my own practice. In my role as a Senior Cloud Solution Architect (CSA), I'm part of a grass-roots organic development team for an internal persona‑driven productivity agent called CSA‑Sherpa. It runs my daily rhythm: a morning briefing, a running logbook of wins and blockers, pipeline and timekeeping summaries, and reporting/exports. It started life in the GitHub Copilot CLI. But over the last few months two things changed the ground under it: Microsoft Scout arrived as a managed cloud agent with native tooling, scheduling, and memory; and Foundry Local made it realistic to run a capable model entirely on‑device on a Copilot+ PC's NPU — no cloud round‑trip at all. That raised a question I think a lot of people building agents will eventually ask: If I designed the framework well, can I change how the model runs without rewriting the agent? To find out, I stood the same agent up in three runtimes, then wrote a whitepaper and a comparison deck measuring what actually changed. This post explains: How one shared, deterministic core made three very different runtimes comparable What the three ports — Copilot CLI, Scout‑native, and Foundry Local (on‑device NPU) — actually took What the analysis showed, and a simple decision framework for which runtime to use when The part that stayed the same: a deterministic core The whole exercise only works because all three implementations load the same behavioral core: Agent definition — persona, behavioral rules, intent routing, workflow dispatch Instructions — conventions, session bootstrap, change‑management rules Skill library — one procedure file per workflow (morning briefing, logbook, pipeline, timekeeping, impact, ops, export…) A deterministic validation contract — schema, formatting, and privacy validators plus a post‑save enforcement chain That last point is the whole thesis: reliability belongs in code, not in the prompt. Rather than asking the model to "remember" to validate its output, a real gate (a validation step → a post‑save enforcement chain → index regeneration) enforces it every single run. This wasn't my idea in a vacuum — it follows the enterprise prompt‑engineering principles Kathiravan Thangavelu lays out in his article Prompt Engineering for Enterprise AI: Why Reliability Matters: keep deterministic logic in code, prefer schema‑driven / structured output over prompt‑enforced formatting, and replace "before you answer, verify that…" mental checklists with real machine validation. My validation gate is that principle in practice. And because that contract is identical across all three runtimes, I'm comparing three ways to execute one product — not three different products. The deterministic payoff: faster and cheaper Retrofitting those principles into the agent — moving work out of the model and into deterministic scripts — is the single change that paid off the most, on two axes at once: Faster. Letting code (not the model) gather and aggregate history cut the average model round‑trips per workflow from ~8.7 to ~5.5 — roughly a third fewer turns. Fewer turns means less waiting on generation and less back‑and‑forth to finish a task. Cheaper. The same change cut usage‑based cost ~24% — and, more importantly, held it flat as the logbook grew to hundreds of entries, because scripts carry the history the model used to re‑read every run. That's the quiet lesson: the reliability work I did for correctness turned out to be the same work that made the agent quicker and less expensive. Determinism isn't a tax on speed — here it bought all three. The work: three repositories, three runtimes Everything below the core — runtime, data access, governance, file layout — is where the effort went. 1 · Mainline — Copilot CLI + MCP. The upstream, most feature‑complete build. Runs as a primary agent in the GitHub Copilot CLI on Claude Opus 4.8; data services are discovered through MCP. It carries the heaviest governance: a Spec Kit layer (spec‑driven‑development agents, a constitution + templates, and 50+ per‑feature spec artifacts gated at PR time) plus an add‑on framework. The richest architecture — and the most complex to operate. 2 · Scout‑native. A thin wrapper loads the exact same core onto Microsoft Scout — again on Claude Opus 4.8 — but data access is re‑platformed onto Scout's native tooling instead of MCP subprocesses. No broker to configure; native tools negotiate their own auth. It adds two things the CLI can't do as cleanly: ✅ Scheduled automations — my morning briefing fires automatically on weekday mornings ✅ Cross‑session memory in place of hand‑off files The deterministic finalize gate stays fully intact. 3 · Foundry Local — on‑device NPU. The genuine outlier and the most involved port: a Python re‑implementation that runs the model — qwen2.5‑7b, an open ~7‑billion‑parameter model — 100% locally on the device's NPU (a Snapdragon X Elite Copilot+ PC) via Foundry Local's OpenAI‑compatible server. The agent loop, an MCP client, skill loading, and a distinct finalize pipeline all had to be rebuilt outside the CLI. The model never leaves the machine; only data connectors reach out when connected. The trade‑offs are real — modest throughput and a fixed context window — but so is the payoff: offline, private, near‑zero marginal cost. The effort This wasn't a weekend spike. Across the three code bases (plus a clean isolation clone I kept as an A/B baseline): ~340–380 commits per repository, three versions maintained in parallel 17 skills in each cloud build; 18 in the Foundry port ~37 scripts in the streamlined Scout build, up to ~97 in the governed Mainline build A Spec Kit governance layer with 50+ feature specs on Mainline A four‑part cost study and two written deliverables: an architecture whitepaper and a 20‑slide comparison deck The analysis and reporting The whitepaper and deck do two jobs. First, they document each runtime as a layered diagram — runtime, core, skills, scripting/validation, external services — so the differences are visible at a glance. Second, they convert the architecture fork into economics: a study that measured the actual token footprints of each repo and priced runs across billing models and hardware. The four dimensions: per‑skill cost, optimized‑vs‑out‑of‑the‑box, Copilot CLI vs Scout, and cloud vs local NPU. By the numbers The study priced measured token footprints at frontier‑model rates (treat the dollars as ±30% — the relative conclusions are far more robust than the absolute figures): Per skill: roughly $0.6–$1.4 per run usage‑based — or a single flat "premium request" under request‑based billing The determinism dividend: optimized, script‑driven skills cut model round‑trips ~8.7 → ~5.5 and usage‑based cost ~24% — and held cost flat as the logbook grew Scout vs CLI: Scout ran ~37% cheaper across a five‑command session and consumed none of the premium‑request allowance Cloud vs local: on‑device NPU inference came in 50–3,400× cheaper in cash than cloud — at the cost of throughput, context, and first‑pass reliability A full active day (~4 runs) landed around a few dollars usage‑based The headline isn't any single figure — it's the shape: cloud cents buy first‑pass reliability, on‑device near‑zero cost trades your time, and determinism makes either one cheaper and steadier. What held up The core is portable. The same agent, skills, and validation gate ran under all three runtimes. Good separation of concerns paid off. Determinism pays three ways — faster, cheaper, and more reliable (detailed above). It was the highest‑leverage change I made. Managed cloud wins the day job. Scout is the best daily driver: reliability gate intact, lower setup friction, scheduling + memory, and cheaper across a multi‑command session because it caches the bootstrap. On‑device is strategic — but reliability is the tax. Local NPU inference is dramatically cheaper in cash. We ran an in‑depth test pass across every function and closed the gaps it surfaced — yet the smaller model that makes Foundry Local possible still hallucinates and drops instructions often enough on the first pass to matter. Each re‑run is nearly free in dollars, but it costs real time to catch and correct. The winning pattern is hybrid. Draft and triage locally for ~nothing; escalate the correctness‑critical steps to cloud Opus 4.8, paying only where it buys first‑pass reliability. Three runtimes, side by side Figure: Three runtimes, one shared core. Only the top rows — runtime, model, data access, and governance — differ; the behavioral core, skill library, validation gate, and outputs are identical across all three. Capability Mainline (Copilot CLI) Scout‑native Foundry Local (NPU) Runtime Copilot CLI (cloud) Scout (cloud, managed) On‑device NPU Model Claude Opus 4.8 Claude Opus 4.8 qwen2.5‑7b (open, ~7B) Data access MCP Native tools MCP via local client Governance Spec Kit + PR gate Behavioral rules Behavioral rules Scheduling + memory ❌ ✅ ❌ Runs fully offline ❌ ❌ ✅ Marginal cost / run cloud per‑token cloud per‑token (cheaper/session) ≈ free Best for Framework development Daily production Offline / privacy / bulk When to use each Daily CSA workflows → Scout‑native. Managed, cheaper across a session, reliable, and it doesn't burn your Copilot request allowance. Building or versioning the framework → Mainline. Spec Kit governance and the add‑on system earn their keep here. Offline, air‑gapped, or sensitive data → Foundry Local. 100% on‑device inference. Bulk / high‑volume / non‑critical → Foundry Local. Zero marginal cost. Must be right on the first pass → Cloud Opus 4.8. The cents are worth it. Mixed, cost‑sensitive workload → Hybrid. Local draft → cloud escalate. Closing Thoughts The most useful reframe from this work: the three architectures aren't competitors — they're a portfolio. A managed cloud daily‑driver (Scout), a governed development platform (Mainline), and a sovereign on‑device runtime (Foundry Local). The job is to match the runtime to the task, not to crown one winner. And the same lesson that applies to Azure infrastructure applies to agents: build reliability into the system, not into good intentions. Because CSA‑Sherpa keeps its guarantees in code, I could change the entire execution model underneath it — cloud CLI, managed cloud, on‑device NPU — and the agent still behaved the same way. That portability is the dividend of a deterministic design. These workflows are genuinely complex, and that's exactly where the small model shows its limits: even after closing the gaps our testing surfaced, it still hallucinates and drops instructions often enough on the first pass to be a real cost. That's the honest trade‑off — near‑zero dollars, paid back in review‑and‑retry time — and it's why my recommendation lands on hybrid: let the small model draft where it's cheap and low‑risk, and escalate anything that has to be right the first time to cloud Opus 4.8. I use the agent in Microsoft Scout daily, as part of my personal production process. I did use AI to help draft and format this post — fittingly, the very agent it describes. The architecture, the analysis, and the conclusions are my own. Thanks for reading.531Views1like1Comment
How does GitHub Copilot in SSMS 22 handle database context collection before generating a response?
Hello, I am trying to better understand the internal workflow of GitHub Copilot in SSMS 22, especially for database-specific questions. From the product descriptions, it seems that Copilot can use the context of the currently connected database, such as schema, tables, columns, and possibly other metadata, when answering questions or generating T-SQL. However, I could not find clear official documentation about the actual sequence of operations. My main questions are: Before generating a response, does Copilot first collect database context/metadata from the active connection and then send that context to the LLM as grounding information? Or does it first use the LLM to interpret the user’s request, decide what information is needed, and then retrieve database metadata before generating the final answer? In some explanations, I have seen the phrase "Core SQL Copilot Infrastructure", but I cannot find any official documentation for that term. Is this an official component name? If so, what does it specifically refer to in the SSMS Copilot architecture? When Copilot answers schema-related or data-related questions, what information is retrieved automatically from the connected database, and is any SQL executed as part of that process? Is there any official architectural documentation that explains: context collection, prompt grounding, LLM invocation order, and whether query execution can occur before the final response is generated? I am asking because I want to understand the feature from both an architecture and data governance/security perspective. Any clarification from the product team or documentation links would be greatly appreciated. Thank you.391Views2likes2CommentsAction Required: Migrate Your Copilot CLI MCP Config Away from .vscode/mcp.json
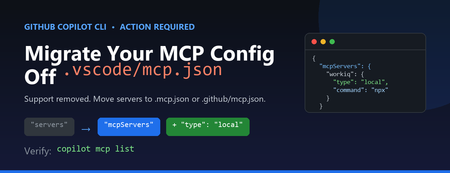
If you use the GitHub Copilot CLI with Model Context Protocol (MCP) servers, you may have hit this message on launch: Copilot CLI's incomplete support for .vscode/mcp.json has been removed. See https://gh.io/copilotcli-mcpmigrate to migrate to .mcp.json or .github/mcp.json . This is a quick, one-time fix. Here's what changed, why, and exactly what you need to do. What Changed The Copilot CLI previously made a best-effort attempt to read .vscode/mcp.json , the file VS Code uses to define MCP servers. That support was incomplete, so it has been removed. The CLI now loads MCP servers only from its own dedicated files: .mcp.json in your project root (or working directory) .github/mcp.json in your repository Your .vscode/mcp.json file is not deleted and still works for VS Code. The CLI simply no longer reads it. Why It Matters The VS Code and Copilot CLI configuration formats look similar but are not identical. Two differences trip people up: The top-level key is servers in VS Code, but mcpServers in the CLI. The CLI requires a type field on each server (for example, "local" for a stdio command-based server, or "http" for a remote server). Because of these differences, you can't just rename the file — you also need to adjust its contents. What You Need to Do Step 1: Find your existing config Locate the VS Code MCP file you've been using, for example: // .vscode/mcp.json (VS Code format) { "servers": { "workiq": { "command": "npx", "args": ["-y", "@microsoft/workiq", "mcp"], "tools": ["*"] } } } Step 2: Create .mcp.json in the same directory Convert it to the Copilot CLI format by renaming the top-level key and adding "type" : // .mcp.json (Copilot CLI format) { "mcpServers": { "workiq": { "type": "local", "command": "npx", "args": ["-y", "@microsoft/workiq", "mcp"], "tools": ["*"] } } } Prefer the change to live with your repository so teammates pick it up automatically? Put the same content in .github/mcp.json instead. Step 3: Verify From the directory containing the new file, list the servers the CLI can see: copilot mcp list You should see your server reported, for example workiq (local) , and the startup warning will stop. Quick Reference VS Code ( .vscode/mcp.json ) Copilot CLI ( .mcp.json / .github/mcp.json ) Top-level key servers Top-level key mcpServers No type field Add "type": "local" (stdio) or "http" (remote) Read by VS Code only Read by Copilot CLI only Don't Forget Your Other Repositories This setting is per-directory. If you run copilot inside multiple projects that each have a .vscode/mcp.json , repeat the migration in each one. The change is always the same: rename servers to mcpServers and add a type to every server. Key Takeaways The Copilot CLI no longer reads .vscode/mcp.json . Move your MCP servers into .mcp.json (project) or .github/mcp.json (repo). Change the key from servers to mcpServers and add "type" to each server. Leave .vscode/mcp.json in place so VS Code keeps working. Confirm with copilot mcp list . Learn More Copilot CLI MCP migration guidance GitHub Copilot CLI command reference Model Context Protocol876Views0likes0CommentsBuilding ShadowQuest: A Multi-Agent RPG
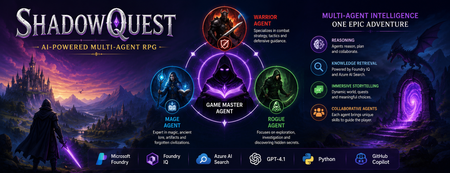
Artificial Intelligence is rapidly evolving beyond traditional chatbots. Today, developers are building intelligent systems where multiple AI agents collaborate, retrieve knowledge, and solve problems together. Microsoft's Agents League Hackathon provided the perfect opportunity to explore this new approach through the Reasoning Agents challenge. For this challenge, I built ShadowQuest, a fantasy role-playing game (RPG) powered by Microsoft Foundry, Foundry IQ, Azure AI Search, GPT-4.1, and GitHub Copilot. The project demonstrates how specialized AI agents can work together while using Retrieval-Augmented Generation (RAG) to deliver accurate and context-aware responses. About the Challenge Microsoft Agents League is a global developer challenge designed to encourage developers to build intelligent AI applications using Microsoft's latest AI technologies. Participants could choose from three tracks: Creative Apps, Reasoning Agents, and Enterprise Agents. I selected the Reasoning Agents track because I wanted to explore how multiple AI agents could collaborate instead of relying on a single large language model. Another important requirement for this year's challenge was integrating at least one Microsoft Intelligence Layer. For ShadowQuest, I chose Foundry IQ as the project's intelligence layer. The Idea Behind ShadowQuest Fantasy RPGs are built around storytelling, exploration, and collaboration between different characters. Every character usually has a unique role, whether it's a warrior protecting the team, a mage interpreting magical knowledge, or a rogue discovering hidden paths. I wanted to recreate this experience using AI. Instead of building one AI assistant responsible for everything, I designed a system where multiple specialized agents collaborate to create a richer and more immersive adventure. ShadowQuest is set in a fantasy world filled with magical artifacts, forgotten kingdoms, mysterious locations, and story-driven quests. Players can ask questions about the world, explore different locations, and learn about the game's lore through conversations with AI agents. Building the Multi-Agent Architecture The architecture follows a simple but scalable design. At the center of the system is the Game Master Agent, which acts as the orchestrator. Every player interaction starts with the Game Master. It receives the player's request, determines what information is needed, retrieves additional knowledge when required, and generates the final response. Supporting the Game Master are three specialized agents: Warrior Agent – Focuses on combat strategy and tactical decisions. Mage Agent – Provides magical knowledge, world lore, and information about ancient artifacts. Rogue Agent – Specializes in exploration, investigation, and discovering hidden information. Each agent has a clearly defined responsibility, making the system easier to understand, maintain, and extend in the future. Using Foundry IQ as the Knowledge Layer One of the most important parts of the project was integrating Foundry IQ. Instead of storing every piece of game information inside prompts, I created a dedicated knowledge base containing information about characters, magical artifacts, locations, quests, and the history of the ShadowQuest world. This approach separates knowledge from reasoning. Whenever a player asks a question, the Game Master Agent first retrieves relevant information from the knowledge base before generating a response. This ensures that answers remain consistent with the game's world while reducing hallucinations. Foundry IQ became the central source of truth for the entire project, making it easy to manage and expand the game world without constantly modifying prompts. Azure AI Search and Retrieval-Augmented Generation To enable intelligent retrieval, I connected Foundry IQ with Azure AI Search. The RPG documents were indexed, and vector embeddings were generated using Microsoft's embedding models. This enables semantic search, allowing the system to understand the meaning behind a player's question instead of relying only on keyword matching. For example, if a player asks about a magical relic without mentioning its exact name, Azure AI Search can still retrieve the correct information based on semantic similarity. The complete workflow looks like this: The player submits a question. The Game Master Agent receives the request. Foundry IQ queries Azure AI Search. Relevant documents are retrieved. GPT-4.1 generates a grounded response using the retrieved context. This Retrieval-Augmented Generation (RAG) approach significantly improves the quality and reliability of responses. Accelerating Development with GitHub Copilot GitHub Copilot played an important role throughout the development process. It helped generate Python classes, improve documentation, create helper functions, and speed up repetitive coding tasks. During the live demonstration, I also showed how Copilot could quickly generate a new Healer Agent, demonstrating how AI-assisted development makes it easier to extend a multi-agent application while maintaining a consistent architecture. Rather than replacing the developer, Copilot acted as an intelligent coding assistant, allowing me to focus more on architecture and design decisions. Demonstrating ShadowQuest During the Microsoft Agents League Reasoning Agents Battle, I demonstrated the Game Master Agent by asking questions about the ShadowQuest world, magical artifacts, and game lore. One of the most interesting parts of the demonstration was observing the retrieval process. Before generating a response, the Game Master Agent called the knowledge retrieval function through Foundry IQ. This confirmed that the system was retrieving relevant information from the indexed knowledge base rather than relying only on GPT-4.1's internal knowledge. This demonstrated how RAG can create more grounded, reliable, and context-aware AI experiences. Lessons Learned Building ShadowQuest taught me that designing multi-agent systems is as much about architecture as it is about AI models. Clearly defining responsibilities for each agent made the application easier to maintain and opened the door for future expansion. I also learned how valuable Retrieval-Augmented Generation can be for applications that depend on structured knowledge. Separating reasoning from knowledge allows AI systems to remain accurate while making it easier to update information over time. Finally, participating in the Microsoft Agents League was an incredible opportunity to experiment with Microsoft's latest AI technologies, learn from other developers, and share ideas with a global community passionate about agentic AI. Looking Ahead ShadowQuest is only the beginning. In future iterations, I plan to expand the project by introducing additional agents such as a Merchant Agent and Healer Agent, implementing persistent player memory, adding dynamic quest generation, improving combat mechanics, and enabling deeper collaboration between agents. These improvements will make the game world more immersive while continuing to explore the possibilities of agent-based AI systems. Conclusion ShadowQuest demonstrates how Microsoft Foundry, Foundry IQ, Azure AI Search, GPT-4.1, and GitHub Copilot can be combined to build intelligent multi-agent applications. More importantly, the project reinforced an important idea: the future of AI is not a single assistant performing every task, but a team of specialized agents collaborating with shared knowledge to solve increasingly complex problems. Participating in the Microsoft Agents League was an inspiring experience that allowed me to explore the next generation of AI development while building a project that combines storytelling, reasoning, and knowledge retrieval. I look forward to continuing this journey and discovering new ways to build intelligent applications using Microsoft's growing AI ecosystem.489Views1like0CommentsModel Mondays S2:E7 · AI-Assisted Azure Development
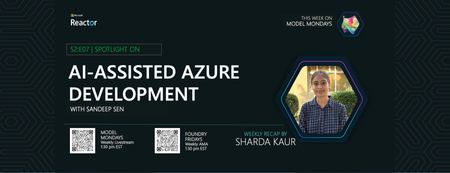
Welcome to Episode 7! This week, we explore how AI is transforming Azure development. We’ll break down two key tools—Azure MCP Server and GitHub Copilot for Azure—and see how they make working with Azure resources easier for everyone. We’ll also look at a real customer story from SightMachine, showing how AI streamlines manufacturing operations.550Views0likes0CommentsBuild a Local Microsoft Sentinel Triage Agent in VS Code (Copilot + MCP)
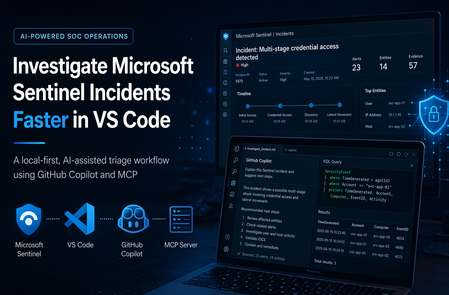
Modern SOC work is not limited by data—it’s limited by the friction of collecting it. This post shows a local-first workflow that lets you investigate Microsoft Sentinel incidents from inside VS Code using GitHub Copilot Chat for reasoning and a small, deterministic MCP toolset for evidence retrieval and (optionally) approval-gated writeback. What you’ll take away: How to structure a Copilot + MCP triage loop that stays grounded in Azure evidence A reliability pattern: fall back to KQL when Sentinel subresource APIs are flaky A safety pattern: draft-first, explicit-approval writeback for incident comments Why This Exists Sentinel triage is powerful but fragmented: you jump between the portal, KQL, entity pivots, and case notes just to answer “what happened?” The goal here is to collapse that into a single, repeatable loop inside the editor. Resolve the incident and pull the underlying alerts/entities Pivot into AzureActivity (and other logs) to identify the actor and outcome Use threat intelligence (TI) for context—not as the decision Generate an evidence-backed narrative and draft comment; write back only on explicit approval Design Principles Evidence first: every claim must be traceable to Sentinel APIs or Log Analytics results Small tool surface: fewer tools, clearer prompting, easier hardening Reliability by design: if one API path fails, pivot to KQL and continue Safety boundary: investigation and writeback are separate, and writeback is approval-gated Architecture & Data Flow A local TypeScript MCP server exposes a handful of triage tools to Copilot Chat in VS Code. Reads come from Sentinel + Log Analytics; writes (incident comments) are optional and require explicit approval. Copilot Chat (VS Code) decides the next step and summarizes outputs MCP server executes allowed tools: incident lookup, alert/entity retrieval, KQL queries, optional comment writeback Evidence sources: Sentinel Incident APIs + Log Analytics tables (SecurityIncident, SecurityAlert, AzureActivity, TI tables) Safety gate: writeback happens only after explicit approval; otherwise you get a draft Tool Surface MCP is useful here because it separates reasoning from execution: Copilot can decide what to do, but only the MCP server can do it—and only through tools you explicitly define and can audit. list_incidents / get_incident (ground the case) get_incident_alerts / get_incident_entities (fast path) run_incident_kql (reliable fallback + pivots) add_incident_comment (draft-first; writes only with approval) The Investigation Loop (3 Steps) Prompt used sentinel-triage-local Investigate Sentinel incident 1478 end to end in workspace Subscription ID/Resource Group/Workspace Name. Resolve the incident ID first, collect underlying alerts and entities, enrich with AzureActivity and TI, determine whether the activity is malicious or benign, and return: 1. Investigation summary 2. Key evidence 3. Entity analysis 4. TI enrichment result 5. Risk assessment 6. Recommended disposition 7. Final incident comment draft Rules: - Use tool output only, no guessing. - If alert/entity subresource APIs fail, pivot to KQL and continue. - Do not submit the comment unless I explicitly say: APPROVE COMMENT. 1) Ground the incident Resolve the human-friendly incident number to the Sentinel incident resource ID, then capture the metadata you need to drive every later pivot. Incident numbers are convenient for analysts, but the actual investigation flow depends on the underlying incident resource ID. Resolving that first gives the workflow a concrete anchor for: Title Severity Owner Status Alert count Analytic rule IDs Incident URL This gives you the stable identifiers (and the URL) needed to retrieve alerts, entities, and supporting logs. 2) Collect alerts and entities (fast path) Pull the alerts behind the incident and the entities they reference. When the incident subresource APIs behave, this is the fastest way to assemble the working set. In the ideal path, the agent can call the incident alert and entity subresources directly. That gives fast access to: Alert IDs Alert names Timestamps Severities Entities Provider metadata 3) Stay reliable: pivot to KQL when APIs fail In real environments, the incident subresource APIs for alerts/entities are not always dependable. When they fail, the workflow switches to Log Analytics and reconstructs the same evidence via KQL—so the investigation continues. SecurityIncident to recover the incident record and alert IDs SecurityAlert to retrieve alert details and entities AzureActivity to determine who or what performed the operation ThreatIntelligenceIndicator and ThreatIntelIndicators for enrichment The High-Signal Pivot: AzureActivity In the incidents I tested, AzureActivity was the fastest way to classify “suspicious deployment” alerts: it tells you who did the action, what operation ran, and whether it succeeded. The evidence showed: The caller was a single Microsoft Entra ID object ID Claims_d.idtyp = "app" Authorization_d.evidence.principalType = "ServicePrincipal" The activity was tied to a policy assignment The operation was MICROSOFT.RESOURCES/DEPLOYMENTS/WRITE The result was BadRequest with InvalidTemplate That pattern typically points to automation (service principal + policy-driven deployment) failing due to a bad template—not an interactive attacker. Threat Intelligence: Use It as Context Enrich observables against TI, but treat it as corroboration: a hit is not proof, and a miss is not a clean bill of health. In my test runs, TI mainly helped refine confidence after AzureActivity and alert evidence established the likely story. Output: An Evidence-Backed Narrative (and a Draft Comment) Once the tools return results, Copilot’s job is synthesis: turn structured evidence into a short narrative an analyst can paste into the case. What happened, who/what triggered it, and whether it succeeded Key supporting evidence (alerts, entities, AzureActivity pivots, TI context) A recommended disposition and a draft incident comment Incident comment written back automatically (after approval) (screenshot): Safety + Reliability: Approval-Gated Writeback The agent can draft a comment automatically, but it cannot change incident state unless the analyst explicitly approves. That boundary is what makes the workflow usable in real operations. After approval, the tool submits the drafted comment directly to the Sentinel incident so the portal reflects the same evidence-backed narrative. Default: return the draft comment only On approval: acquire an ARM token via Azure CLI and submit via curl.exe (hardened with validation + retries) Why This Is Worth Building Less context switching: investigation happens where you already work More consistency: the same loop runs every time, with deterministic tools Better classification: AzureActivity pivots reduce false “user did X” assumptions Safer automation: drafts are automatic; writes are explicit and auditable Conclusion AI is most useful in a SOC when it is constrained: deterministic tools fetch the evidence, the model synthesizes it, and humans keep control of state changes. A local Copilot + MCP workflow hits that sweet spot—faster triage for the SOC analysts.