github
387 TopicsBuild an AI-Powered Space Invaders Game
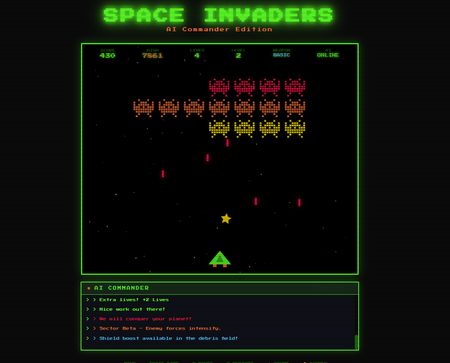
Build an AI-Powered Space Invaders Game: Integrating LLMs into HTML5 Games with Microsoft Foundry Local Introduction What if your game could talk back to you? Imagine playing Space Invaders while an AI commander taunts you during battle, delivers personalized mission briefings, and provides real-time feedback based on your performance. This isn't science fiction it's something you can build today using HTML, JavaScript, and a locally-running AI model. In this tutorial, we'll explore how to create an HTML5 game with integrated Large Language Model (LLM) features using Microsoft Foundry Local. You'll learn how to combine classic game development with modern AI capabilities, all running entirely on your own machine—no cloud services, no API costs, no internet connection required during gameplay. We'll be working with the Space Invaders - AI Commander Edition project, which demonstrates exactly how to architect games that leverage local AI. Whether you're a student learning game development, exploring AI integration patterns, or building your portfolio, this guide provides practical, hands-on experience with technologies that are reshaping how we build interactive applications. What You'll Learn By the end of this tutorial, you'll understand how to combine traditional web development with local AI inference. These skills transfer directly to building chatbots, interactive tutorials, AI-enhanced productivity tools, and any application where you want intelligent, context-aware responses. Set up Microsoft Foundry Local for running AI models on your machine Understand the architecture of games that integrate LLM features Use GitHub Copilot CLI to accelerate your development workflow Implement AI-powered game features like dynamic commentary and adaptive feedback Extend the project with your own creative AI features Why Local AI for Games? Before diving into the code, let's understand why running AI locally matters for game development. Traditional cloud-based AI services have limitations that make them impractical for real-time gaming experiences. Latency is the first challenge. Cloud API calls typically take 500ms to several seconds, an eternity in a game running at 60 frames per second. Local inference can respond in tens of milliseconds, enabling AI responses that feel instantaneous and natural. When an enemy ship appears, your AI commander can taunt you immediately, not three seconds later. Cost is another consideration. Cloud AI services charge per token, which adds up quickly when generating dynamic content during gameplay. Local models have zero per-use cost, once installed, they run entirely on your hardware. This frees you to experiment without worrying about API bills. Privacy and offline capability complete the picture. Local AI keeps all data on your machine, perfect for games that might handle player information. And since nothing requires internet connectivity, your game works anywhere, on planes, in areas with poor connectivity, or simply when you want to play without network access. Understanding Microsoft Foundry Local Microsoft Foundry Local is a runtime that enables you to run small language models (SLMs) directly on your computer. It's designed for developers who want to integrate AI capabilities into applications without requiring cloud infrastructure. Think of it as having a miniature AI assistant living on your laptop. Foundry Local handles the complex work of loading AI models, managing memory, and processing inference requests through a simple API. You send text prompts, and it returns AI-generated responses, all happening locally on your CPU or GPU. The models are optimized to run efficiently on consumer hardware, so you don't need a supercomputer. For our Space Invaders game, Foundry Local powers the "AI Commander" feature. During gameplay, the game sends context about what's happening, your score, accuracy, current level, enemies remaining and receives back contextual commentary, taunts, and encouragement. The result feels like playing alongside an AI companion who actually understands the game. Setting Up Your Development Environment Let's get your machine ready for AI-powered game development. We'll install Foundry Local, clone the project, and verify everything works. The entire setup takes about 10-15 minutes. Step 1: Install Microsoft Foundry Local Foundry Local installation varies by operating system. Open your terminal and run the appropriate command: # Windows (using winget) winget install Microsoft.FoundryLocal # macOS (using Homebrew) brew install microsoft/foundrylocal/foundrylocal These commands download and install the Foundry Local runtime along with a default small language model. The installation includes everything needed to run AI inference locally. Verify the installation by running: foundry --version If you see a version number, Foundry Local is ready. If you encounter errors, ensure you have administrator/sudo privileges and that your package manager is up to date. Step 2: Install Node.js (If Not Already Installed) Our game's AI features require a small Node.js server to communicate between the browser and Foundry Local. Check if Node.js is installed: node --version If you see a version number (v16 or higher recommended), you're set. Otherwise, install Node.js: # Windows winget install OpenJS.NodeJS.LTS # macOS brew install node # Linux sudo apt install nodejs npm Node.js provides the JavaScript runtime that powers our proxy server, bridging browser code with the local AI model. Step 3: Clone the Project Get the Space Invaders project onto your machine: git clone https://github.com/leestott/Spaceinvaders-FoundryLocal.git cd Spaceinvaders-FoundryLocal This downloads all game files, including the HTML interface, game logic, AI integration module, and server code. Step 4: Install Dependencies and Start the Server Install the Node.js packages and launch the AI-enabled server: npm install npm start The first command downloads required packages (primarily for the proxy server). The second starts the server, which listens for AI requests from the game. You should see output indicating the server is running on port 3001. Step 5: Play the Game Open your browser and navigate to: http://localhost:3001 You should see Space Invaders with "AI: ONLINE" displayed in the game HUD, indicating that AI features are active. Use arrow keys or A/D to move, SPACE to fire, and P to pause. The AI Commander will start providing commentary as you play! Understanding the Project Architecture Now that the game is running, let's explore how the different pieces fit together. Understanding this architecture will help you modify the game and apply these patterns to your own projects. The project follows a clean separation of concerns, with each file handling a specific responsibility: Spaceinvaders-FoundryLocal/ ├── index.html # Main game page and UI structure ├── styles.css # Retro arcade visual styling ├── game.js # Core game logic and rendering ├── llm.js # AI integration module ├── sound.js # Web Audio API sound effects ├── server.js # Node.js proxy for Foundry Local └── package.json # Project configuration index.html: Defines the game canvas and UI elements. It's the entry point that loads all other modules. game.js: Contains the game loop, physics, collision detection, scoring, and rendering logic. This is the heart of the game. llm.js: Handles all communication with the AI backend. It formats game state into prompts and processes AI responses. server.js: A lightweight Express server that proxies requests between the browser and Foundry Local. sound.js: Synthesizes retro sound effects using the Web Audio API—no audio files needed! How the AI Integration Works The magic of the AI Commander happens through a simple but powerful pattern. Let's trace the flow from gameplay event to AI response. When something interesting happens in the game, you clear a wave, achieve a combo, or lose a life, the game logic in game.js triggers an AI request. This request includes context about the current game state: your score, accuracy percentage, current level, lives remaining, and what just happened. The llm.js module formats this context into a prompt. For example, when you clear a wave with 85% accuracy, it might construct: You are an AI Commander in a Space Invaders game. The player just cleared wave 3 with 85% accuracy. Score: 12,500. Lives: 3. Provide a brief, enthusiastic comment (1-2 sentences). This prompt travels to server.js , which forwards it to Foundry Local. The AI model processes the prompt and generates a response like: "Impressive accuracy, pilot! Wave 3 didn't stand a chance. Keep that trigger finger sharp!" The response flows back through the server to the browser, where llm.js passes it to the game. The game displays the message in the HUD, creating the illusion of playing alongside an AI companion. This entire round trip typically completes in 50-200 milliseconds, fast enough to feel responsive without interrupting gameplay. Using GitHub Copilot CLI to Explore and Modify the Code GitHub Copilot CLI accelerates your development workflow by letting you ask questions and generate code directly in your terminal. Let's use it to understand and extend the Space Invaders project. Installing Copilot CLI If you haven't installed Copilot CLI yet, here's the quick setup: # Install GitHub CLI winget install GitHub.cli # Windows brew install gh # macOS # Authenticate with GitHub gh auth login # Add Copilot extension gh extension install github/gh-copilot # Verify installation gh copilot --help With Copilot CLI ready, you can interact with AI directly from your terminal while working on the project. Exploring Code with Copilot CLI Use Copilot to understand unfamiliar code. Navigate to the project directory and try: gh copilot explain "How does llm.js communicate with the server?" Copilot analyzes the code and explains the communication pattern, helping you understand the architecture without reading every line manually. You can also ask about specific functions: gh copilot explain "What does the generateEnemyTaunt function do?" This accelerates onboarding to unfamiliar codebases, a valuable skill when working with open source projects or joining teams. Generating New Features Want to add a new AI feature? Ask Copilot to help generate the code: gh copilot suggest "Create a function that asks the AI to generate a mission briefing at the start of each level, including the level number and a random mission objective" Copilot generates starter code that you can customize and integrate. This combination of AI-powered development tools and AI-integrated gameplay demonstrates how LLMs are transforming both how we build games and how games behave. Customizing the AI Commander The default AI Commander provides generic gaming commentary, but you can customize its personality and responses. Open llm.js to find the prompt templates that control AI behavior. Changing the AI's Personality The system prompt defines who the AI "is." Find the base prompt and modify it: // Original const systemPrompt = "You are an AI Commander in a Space Invaders game."; // Customized - Drill Sergeant personality const systemPrompt = `You are Sergeant Blaster, a gruff but encouraging drill sergeant commanding space cadets. Use military terminology, call the player "cadet," and be tough but fair.`; // Customized - Supportive Coach personality const systemPrompt = `You are Coach Nova, a supportive and enthusiastic gaming coach. Use encouraging language, celebrate small victories, and provide gentle guidance when players struggle.`; These personality changes dramatically alter the game's feel without changing any gameplay code. It's a powerful example of how AI can add variety to games with minimal development effort. Adding New Commentary Triggers Currently the AI responds to wave completions and game events. You can add new triggers in game.js : // Add AI commentary when player achieves a kill streak if (killStreak >= 5 && !streakCommentPending) { requestAIComment('killStreak', { count: killStreak }); streakCommentPending = true; } // Add AI reaction when player narrowly avoids death if (nearMissOccurred) { requestAIComment('nearMiss', { livesRemaining: lives }); } Each new trigger point adds another opportunity for the AI to engage with the player, making the experience more dynamic and personalized. Understanding the Game Features Beyond AI integration, the Space Invaders project demonstrates solid game development patterns worth studying. Let's explore the key features. Power-Up System The game includes eight different power-ups, each with unique effects: SPREAD (Orange): Fires three projectiles in a spread pattern LASER (Red): Powerful beam with high damage RAPID (Yellow): Dramatically increased fire rate MISSILE (Purple): Homing projectiles that track enemies SHIELD (Blue): Grants an extra life EXTRA LIFE (Green): Grants two extra lives BOMB (Red): Destroys all enemies on screen BONUS (Gold): Random score bonus between 250-750 points Power-ups demonstrate state management, tracking which power-up is active, applying its effects to player actions, and handling timeouts. Study the power-up code in game.js to understand how temporary state modifications work. Leaderboard System The game persists high scores using the browser's localStorage API: // Saving scores localStorage.setItem('spaceInvadersScores', JSON.stringify(scores)); // Loading scores const savedScores = localStorage.getItem('spaceInvadersScores'); const scores = savedScores ? JSON.parse(savedScores) : []; This pattern works for any data you want to persist between sessions—game progress, user preferences, or accumulated statistics. It's a simple but powerful technique for web games. Sound Synthesis Rather than loading audio files, the game synthesizes retro sound effects using the Web Audio API in sound.js . This approach has several benefits: no external assets to load, smaller project size, and complete control over sound parameters. Examine how oscillators and gain nodes combine to create laser sounds, explosions, and victory fanfares. This knowledge transfers directly to any web project requiring audio feedback. Extending the Project: Ideas for Students Ready to make the project your own? Here are ideas ranging from beginner-friendly to challenging, each teaching valuable skills. Beginner: Customize Visual Theme Modify styles.css to create a new visual theme. Try changing the color scheme from green to blue, or create a "sunset" theme with orange and purple gradients. This builds CSS skills while making the game feel fresh. Intermediate: Add New Enemy Types Create a new enemy class in game.js with different movement patterns. Perhaps enemies that move in sine waves, or boss enemies that take multiple hits. This teaches object-oriented programming and game physics. Intermediate: Expand AI Interactions Add new AI features like: Pre-game mission briefings that set up the story Dynamic difficulty hints when players struggle Post-game performance analysis and improvement suggestions AI-generated names for enemy waves Advanced: Multiplayer Commentary Modify the game for two-player support and have the AI provide play-by-play commentary comparing both players' performance. This combines game networking concepts with advanced AI prompting. Advanced: Voice Integration Use the Web Speech API to speak the AI Commander's responses aloud. This creates a more immersive experience and demonstrates browser speech synthesis capabilities. Troubleshooting Common Issues If something isn't working, here are solutions to common problems. "AI: OFFLINE" Displayed in Game This means the game can't connect to the AI server. Check that: The server is running ( npm start shows no errors) You're accessing the game via http://localhost:3001 , not directly opening the HTML file Foundry Local is installed correctly ( foundry --version works) Server Won't Start If npm start fails: Ensure you ran npm install first Check that port 3001 isn't already in use by another application Verify Node.js is installed ( node --version ) AI Responses Are Slow Local AI performance depends on your hardware. If responses feel sluggish: Close other resource-intensive applications Ensure your laptop is plugged in (battery mode may throttle CPU) Consider that first requests may be slower as the model loads Key Takeaways Local AI enables real-time game features: Microsoft Foundry Local provides fast, free, private AI inference perfect for gaming applications Clean architecture matters: Separating game logic, AI integration, and server code makes projects maintainable and extensible AI personality is prompt-driven: Changing a few lines of prompt text completely transforms how the AI interacts with players Copilot CLI accelerates learning: Use it to explore unfamiliar code and generate new features quickly The patterns transfer everywhere: Skills from this project apply to chatbots, assistants, educational tools, and any AI-integrated application Conclusion and Next Steps You've now seen how to integrate AI capabilities into a browser-based game using Microsoft Foundry Local. The Space Invaders project demonstrates that modern AI features don't require cloud services or complex infrastructure, they can run entirely on your laptop, responding in milliseconds. More importantly, you've learned patterns that extend far beyond gaming. The architecture of sending context to an AI, receiving generated responses, and integrating them into user experiences applies to countless applications: customer support bots, educational tutors, creative writing tools, and accessibility features. Your next step is experimentation. Clone the repository, modify the AI's personality, add new commentary triggers, or build an entirely new game using these patterns. The combination of GitHub Copilot CLI for development assistance and Foundry Local for runtime AI gives you powerful tools to bring intelligent applications to life. Start playing, start coding, and discover what you can create when your games can think. Resources Space Invaders - AI Commander Edition Repository - Full source code and documentation Play Space Invaders Online - Try the basic version without AI features Microsoft Foundry Local Documentation - Official installation and API guide GitHub Copilot CLI Documentation - Installation and usage guide GitHub Education - Free developer tools for students Web Audio API Documentation - Learn about browser sound synthesis Canvas API Documentation - Master HTML5 game rendering982Views0likes3CommentsTurn conversations into code with GitHub Copilot in Microsoft Teams
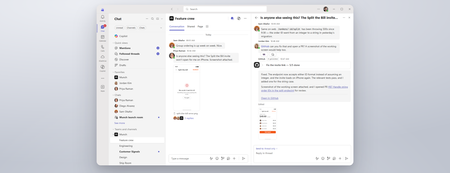
Coding where context lives and collaboration happens The best prompt may be the conversation your team has already had or is currently having. Until now, using a coding agent often meant paying context and coordination taxes. Developers had to leave the discussion, open another tool, and reconstruct the problem in a lengthy prompt: what happened, what the team decided, which constraints matter, and what needs to be built. With GitHub Copilot in Teams, teams can move directly from conversation to action. @mention GitHub Copilot when the team is ready to act, and it can use the conversation alongside repository context to understand the request, implement the change, and create a pull request for review. This makes working with a coding agent more collaborative and visible. Instead of one developer privately reconstructing the request, teammates can contribute context, correct assumptions, refine the approach in real time, and review the resulting work together. Let’s explore the new GitHub Copilot in Teams experience to see how it can streamline development tasks: If the player doesn’t load, open the video in a new window: Open video GitHub Copilot in Teams is available in Teams channels, group chats, meeting chats, and 1:1 chats. Once the GitHub app is installed and added to the conversation, @-mention GitHub Copilot to bring it into the discussion and start a task. During public preview, users can complete the following scenarios with GitHub Copilot in Teams: Build a feature based on requirements discussed in Teams Implement a fix for a bug Expand test coverage or improve documentation Create and update a pull request No copying the discussion into a CLI. No rewriting it in a desktop app. No asking one developer to translate a team decision into the perfect prompt. GitHub Copilot works where the context already lives, and because that context is shared, working with GitHub Copilot becomes a team activity. Built around the controls teams already use GitHub Copilot in Teams works within existing GitHub permissions and repository policies. Branch protections and required reviews continue to apply, and people remain responsible for deciding what gets merged, ensuring that humans stay in the loop at every step. Availability GitHub Copilot in Teams is now available in Public Preview. To try it, install the GitHub app for Microsoft Teams and check out our documentation to get started! Less context reconstruction. More progress from the conversations already happening.4.3KViews0likes1CommentModel router updates: new regions, a refreshed model pool, and understanding the hill climb
Across Microsoft, "hill climbing" has become shorthand for how real AI progress happens: not in one dramatic leap, but through a disciplined loop. Microsoft AI defines the hill climb as an organization that continuously improves, cycle after cycle, through more compute, better data, and sharper evaluation. Reinforcement fine-tuning in Foundry defines it as improving the deployable model package one measured step at a time across quality, latency, and cost. Different altitudes, same premise: progress is not a one-shot decision. It's a loop. For most teams, the decision of what model to use when is made manually or with custom routing tools. A developer picks a model based on benchmarks, familiarity, or the last launch that made headlines, ships it, and revisits the choice only when something breaks. In an ecosystem where the frontier moves monthly, that decision goes stale fast. Model router in Foundry Models brings the hill climb to the selection layer. What's new: a bigger pool, in more places This release expands where teams can deploy model router, broaden the supported model pool, and delivers updates through a stable endpoint. Together, these changes help teams run production workloads in more locations, match a wider range of tasks to suitable models, and adopt supported updates without changing the application integration. A refreshed model pool. The supported model list now includes Anthropic Claude Opus 4.8 — a high-capability model built for complex reasoning and long-form generation, for scenarios that demand depth, structure, and quality — and the GPT-5.6 family. Just as importantly, the pool is pruned: gpt-5-chat, gpt-5.2-chat, gpt-5.3-chat, Deepseek-V3.1 have been removed from the model router as models reach the end of their lifecycle and are deprecated in Foundry. New region availability. The model router is now available in 28 regions for global standard and 21 data zone regions. For many organizations, inference requests must stay within specific geographic boundaries for regulatory, governance, or customer-trust reasons — and intelligent routing shouldn't force a compromise on that. Find the full list of regions here. The most important detail is what you don't have to do: these updates occur automatically*. The endpoint remains stable as the supported model pool is refreshed, so teams do not need to redeploy the model router to receive the update. Applications can continue using the same integration while the model router evaluates requests against the current supported pool. Teams should continue monitoring routing traces and application outcomes to confirm that quality, cost, latency, and governance requirements are met. *Models from Anthropic still need to be deployed separately before they can be routed to through the model router. Interested in hearing more about what's new to the model router? Tune in for the next episode of Model Mondays with Sanjeev Jagtap and Lee Stott, where they talk all things model router from evaluations to hill climbing. Sign up here to watch live or view the replay: Model Mondays - Spotlight On Model router in Microsoft Foundry | Microsoft Reactor The selection-layer hill climb At the selection layer, a step is a routing decision. Each one is a micro-optimization against your objective, and each one is instrumented: every response from the model router includes a model field showing which underlying model was selected, so the climb leaves a complete, auditable trail. Model router supports three parts of the optimization loop: A/B testing to compare two router configurations to understand quality, cost, and latency tradeoffs; model decomposition to use routing results to decompose a single-model application into a multi-model or multi-agent design, and continuous routing to keep the router in production for continuous per-request selection. Each pattern turns model choice into a measured, repeatable process rather than a fixed decision. 1. A/B Testing Question: Which model or routing strategy should I use in production? A/B testing helps teams compare candidate models, model families, or router configurations against the same workload. Representative traffic is sent to competing deployments, and teams compare quality, cost, latency, and governance outcomes. The goal is to understand tradeoffs and identify the model or routing strategy that best meets workload requirements before promoting it to production. 2. Model Decomposition Question: What work is my application actually doing? Model decomposition uses model router as a diagnostic tool. By deploying the model router against a representative workload and examining routing telemetry, teams can see how requests naturally separate into different task classes. Simple retrieval, classification, and summarization requests may route to smaller models, while reasoning, planning, and agentic workflows may require more capable models. The goal is not to choose a winner, but to understand the structure of the workload and uncover opportunities for optimization, specialization, or architectural improvements. 3. Route continuously Question: Why choose a single model at all? Route continuously is the pattern model router was designed for but is not limited to. Rather than treating model selection as a one-time decision, teams leave the model router in production and allow the best-fit model to be selected for each request. As the supported model pool, regional availability, and platform capabilities evolve, teams can continue using the same endpoint while evaluating whether updates improve workload outcomes. Model selection becomes an ongoing optimization process rather than a project that must be repeated every time the model landscape changes. Together, these patterns illustrate a broader shift: the model router is more than a model. It is a tool for the optimization loop itself, helping teams evaluate tradeoffs, understand workload behavior, test hypotheses, and continuously refine model selection as requirements evolve. Whether used to compare candidate models, decompose applications into specialized tasks, or automate per-request routing in production, model router turns model selection into an observable, measurable, and repeatable process. As the model landscape continues to change, that optimization loop becomes a durable advantage. Getting Started Ready to start your own hill climb? Whether you're exploring the model router for the first time, evaluating routing strategies against your workload, or building a long-term optimization practice, these resources can help you move from experimentation to production with Microsoft Foundry. What's new in model router? Sign up for the next Model Mondays episode for a deep dive into new features, optimization patterns, and the latest model router updates. How do I build agents with model router? Check out the Model Router Agents Lab and build agent experiences with routing, retrieval, web search, tool calling, and multi-agent patterns. How do I evaluate model router? Compare model router against baseline models using your own prompts, then review quality, cost, latency, and routing decisions with the Auto Evaluation Toolkit. How do I optimize model router for my workload? Start your hill-climbing journey with the Model Mastery workshop, where you'll test one optimization lever at a time and measure how each change impacts workload outcomes. How do I build a model router optimization playbook? Explore the Model Releases repository to track new capabilities, understand the optimization question behind each release, and try focused notebooks that demonstrate one optimization lever at a time.2.8KViews2likes0CommentsDistributing Agents to Microsoft Teams and Microsoft 365 Copilot Part 4/5
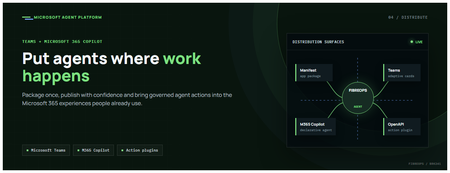
This is the fourth post in our series on the Microsoft agent platform. We cover the Distribute in M365 pillar — publishing your agents to Microsoft Teams and Microsoft 365 Copilot so they reach users where they already work. All examples reference the FibreOps repository, demonstrated at Microsoft Build BRK241. The Distribution Story Building a great agent is only half the challenge. The other half is getting it into the hands of users without asking them to learn a new tool, visit a new URL, or change their workflow. Microsoft 365 Copilot and Microsoft Teams are where enterprise users already spend their day, making them the natural distribution surface for agents. With the GA release, publishing an agent to Teams and M365 Copilot is a single command. No separate app registration portal, no manual manifest assembly, no multi-step approval workflow for development and testing. Publishing to Microsoft 365 Copilot (GA) FibreOps ships as a declarative agent + action plugin ready for sideload. A single CLI command produces the complete package: python -m fibreops.demo publish-m365 --out dist/m365 # Output: # ✓ wrote dist/m365/declarativeAgent.json # ✓ wrote dist/m365/fibreops-action.json # ✓ wrote dist/m365/manifest.json # ✓ wrote dist/m365/color.png (192x192) # ✓ wrote dist/m365/outline.png ( 32x32) # ✓ wrote dist/m365/fibreops-copilot.zip What Gets Generated File Purpose declarativeAgent.json Defines the agent's persona, capabilities, and conversation starters for M365 Copilot fibreops-action.json Action plugin that proxies tool calls to the deployed FastAPI backend via OpenAPI manifest.json Teams app manifest with publisher metadata, permissions, and capabilities color.png / outline.png App icons for Teams and M365 surfaces fibreops-copilot.zip Ready-to-upload package for Teams Admin Center Configuration Set the base URL to your deployed FastAPI app before publishing — the action plugin uses this to resolve the OpenAPI runtime: # Set the public HTTPS hostname of the deployed FastAPI app $env:M365_ACTION_BASE_URL = "https://fibreops-demo.azurewebsites.net" # Optional: customise publisher metadata $env:M365_PUBLISHER_NAME = "Contoso Network Operations" $env:M365_PUBLISHER_WEBSITE = "https://contoso.com/noc" # Generate the package python -m fibreops.demo publish-m365 --out dist/m365 Environment Variable Purpose M365_ACTION_BASE_URL Public HTTPS root for the FastAPI /openapi.json (e.g., Container Apps FQDN) M365_APP_ID Override the generated Teams app GUID (default: deterministic per repo) M365_PUBLISHER_NAME Publisher name shown in M365 Admin Center M365_PUBLISHER_WEBSITE Publisher website link Uploading the Package Upload the generated fibreops-copilot.zip through either path: Teams Admin Center → Manage apps → Upload new app M365 Admin Center → Integrated apps → Upload custom apps Once uploaded, the declarative agent: Inherits the publisher metadata you configured Advertises conversation starters from the FibreOps deck (e.g., "What is the current outage status?", "Dispatch an engineer to FN-LDN-001") Proxies tool calls to the deployed FastAPI app via the action plugin Appears in Microsoft 365 Copilot as a specialised agent users can invoke How Declarative Agents Work A declarative agent in Microsoft 365 Copilot is defined by metadata rather than code running in the M365 surface. The intelligence lives in your backend — Copilot handles the conversational UX, tool orchestration schema, and user authentication. The flow: User invokes the agent in Microsoft 365 Copilot or Teams Copilot renders conversation starters and accepts natural language input When the agent needs to act, Copilot calls the action plugin (your OpenAPI endpoint) Your FastAPI backend processes the request using the full agent pipeline Results return to the user in the Copilot/Teams UX This architecture means your agent logic stays in one place — the backend. The M365 surface is purely a distribution and interaction layer. Action Plugins and OpenAPI The action plugin ( fibreops-action.json ) references your FastAPI app's /openapi.json endpoint. FibreOps exposes a JSON API that the action plugin can call: /api/runs — List and query agent runs /api/optimiser — Get optimizer scores and suggestions /sdk/chat — Natural language interaction with the agent system /healthz — Liveness probe Because FastAPI auto-generates OpenAPI schemas from your typed Python endpoints, the action plugin gets accurate parameter descriptions, response schemas, and error codes without any manual specification work. Publishing as Autopilots (Public Preview) Autopilots take distribution one step further — agents that operate autonomously without requiring a user to initiate each interaction. An Autopilot can: React to events (e.g., a critical telemetry signal) without human initiation Take actions within defined guardrails Notify users only when human intervention is needed Operate continuously across Microsoft 365 surfaces For FibreOps, an Autopilot would monitor the Event Hub stream continuously and only surface to the NOC team when an incident exceeds automated resolution capability — a fully autonomous operations agent. Teams Adaptive Cards FibreOps posts rich Adaptive Card notifications to Microsoft Teams throughout the agent pipeline. This is separate from the declarative agent — it is a push notification channel for real-time operational awareness. # The NetOps agent posts an outage notice via Incoming Webhook def post_outage_notice(incident_id, node_id, severity, summary, engineer=None): card = { "type": "AdaptiveCard", "body": [ {"type": "TextBlock", "text": f"🚨 Outage: {node_id}", "weight": "Bolder", "size": "Large"}, {"type": "FactSet", "facts": [ {"title": "Severity", "value": severity.upper()}, {"title": "Incident", "value": incident_id}, {"title": "Summary", "value": summary}, ]}, ], "actions": [ {"type": "Action.OpenUrl", "title": "View in NOC Console", "url": f"{base_url}/runs/{incident_id}"} ] } # POST to Teams webhook or append to outbox for offline mode ... If TEAMS_WEBHOOK_URL is not configured, cards are appended to state/teams_outbox.jsonl for review in the NOC console's Teams panel. End-to-End: From Code to Copilot Here is the complete flow from development to distribution: Build — Develop agents with Microsoft Agent Framework, test locally with python -m fibreops.demo --backend local Publish agents — python -m fibreops.demo publish creates hosted Prompt Agents in Foundry Deploy infrastructure — azd up provisions App Service, ACR, Event Hub, Key Vault, and Application Insights Deploy hosted agent — azd env set FIBREOPS_DEPLOY_HOSTED true && azd up Generate M365 package — python -m fibreops.demo publish-m365 --out dist/m365 Upload to Teams — Upload fibreops-copilot.zip via Teams Admin Center Users interact — The agent is now available in Microsoft 365 Copilot and Teams Security Considerations Managed Identity — The deployed app uses system-assigned managed identity for all Azure service access. No secrets in code. Least privilege — Each role grant is scoped to the minimum required (Event Hubs Data Owner, Key Vault Secrets User, AcrPull, Azure AI Developer). Authentication — The M365 Copilot surface handles user authentication; your backend receives authenticated requests. Guardrails — Autopilots operate within defined boundaries; human-in-the-loop escalation is built into the Routine and agent decision logic. Key Takeaways Publishing to Teams and M365 Copilot is GA — a single command generates the complete package. Declarative agents separate distribution (M365) from intelligence (your backend). Action plugins leverage your existing FastAPI OpenAPI schema — no manual specification needed. Autopilots (Public Preview) enable fully autonomous operation within guardrails. Adaptive Cards provide real-time push notifications alongside the conversational agent surface. The same backend serves the NOC console, the Copilot SDK, and the M365 declarative agent. Next Steps Explore the FibreOps repository — try python -m fibreops.demo publish-m365 Microsoft 365 Copilot extensibility documentation Next in this series: Voice Live and Observability for Production Agent SystemsBuilding Autonomous Agents with Microsoft Agent Framework and GitHub Copilot SDK Part 2/5
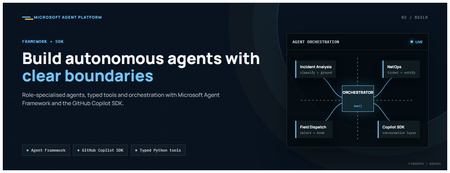
This is the second post in our series on the Microsoft agent platform. Here we dive deep into building autonomous agents, the development experience, the Microsoft Agent Framework, tool design patterns, and how the GitHub Copilot SDK brings conversational AI to your agent system. All examples reference the FibreOps repository, an autonomous fibre outage response system demonstrated at Microsoft Build BRK241. The Microsoft Agent Framework The Microsoft Agent Framework (now GA) provides a unified programming model for building agents. It supports multiple backends through a single .run() contract: Hosted — FoundryAgent connected to a Prompt Agent published to Microsoft Foundry Agent Service. Foundry — Agent + FoundryChatClient with the definition resolved locally (ideal for prompt iteration). Local — Deterministic LocalAgent for offline development and testing. This design means your orchestration code never changes regardless of where the agent runs. The factory pattern in FibreOps selects the backend at startup: # src/fibreops/agents/factory.py — simplified from agent_framework_foundry import FoundryAgent from agent_framework import Agent, FoundryChatClient def build_agent(role: str, backend: str, config: Config): if backend == "hosted": return FoundryAgent(agent_id=config.foundry_agents[role]) elif backend == "foundry": return Agent( instructions=get_instructions(role), chat_client=FoundryChatClient(endpoint=config.endpoint), tools=get_tools(role), ) else: return LocalAgent(role=role) Set FIBREOPS_AGENT_BACKEND to override the backend, or leave it as auto for intelligent detection. Designing Role-Specialised Agents FibreOps demonstrates a key pattern: role specialisation. Rather than one monolithic agent, the system uses three focused agents, each with a clear responsibility boundary: Agent Role Tools Available IncidentAnalysisAgent Classify severity, find root cause, retrieve SOP Knowledge (SOPs + topology), Web IQ, Work IQ NetOpsCoordinatorAgent File D365 incident, post Teams notice Ticketing, Teams, Memory FieldDispatchAgent Select engineer, book resource, update team Dispatch, Teams, Voice Why Role Specialisation? Focused system prompts — Each agent has a tightly scoped instruction set, reducing hallucination and improving reliability. Independent evaluation — You can score each agent separately against role-specific criteria. Parallel development — Teams can iterate on agents independently. Selective upgrade — Swap one agent's model or implementation without touching others. Tool Design: Typed Python Functions Tools in the Microsoft Agent Framework are typed Python functions that the runtime supplies to the hosted agent definition. FibreOps demonstrates several tool categories: Knowledge Tools # src/fibreops/tools/knowledge.py — simplified def sop_lookup(node_id: str, signal_type: str) -> dict: """Retrieve the Standard Operating Procedure for a given signal type. Args: node_id: The fibre node identifier (e.g., FN-LDN-001) signal_type: The type of signal (loss_of_light, high_ber, signal_degradation) Returns: SOP with steps, escalation path, and estimated resolution time. """ # Load from local markdown SOPs or Foundry IQ ... def web_iq_search(query: str, *, limit: int = 5) -> list[dict]: """Search public web for context relevant to the incident. Grounding against roadworks, weather, power outages, splice guidance. Falls back to deterministic fixtures when endpoint is unset. """ ... def work_iq_search(query: str, *, limit: int = 5) -> list[dict]: """Search enterprise knowledge for context relevant to the incident. Site surveys, SLA tiers, competency matrix, MTTR trends. """ ... Integration Tools # src/fibreops/tools/teams.py — simplified def post_outage_notice( incident_id: str, node_id: str, severity: str, summary: str, engineer: str | None = None, ) -> dict: """Post an Adaptive Card outage notice to the configured Teams channel. If TEAMS_WEBHOOK_URL is not set, appends to state/teams_outbox.jsonl for offline review. """ card = build_adaptive_card(incident_id, node_id, severity, summary, engineer) if config.teams_webhook_url: requests.post(config.teams_webhook_url, json=card) else: append_to_outbox(card) return {"status": "posted", "incident_id": incident_id} Design Principles for Agent Tools Typed parameters with docstrings — The runtime uses type hints and docstrings to generate the tool schema for the LLM. Graceful degradation — Every tool works offline by falling back to local fixtures or file-based state. Idempotent where possible — Tools that create resources return existing records if called with the same parameters. Observable — Every tool invocation emits an OpenTelemetry span for tracing and debugging. The Orchestrator Pattern The orchestrator drives signals through the agent pipeline. It is deliberately simple — a linear flow with error handling: # src/fibreops/orchestrator.py — simplified async def handle_signal(signal: TelemetrySignal) -> RunResult: """Process a telemetry signal through the agent pipeline.""" # Stage 1: Incident Analysis analysis = await incident_agent.run( f"Analyse this signal: {signal.model_dump_json()}" ) # Stage 2: NetOps Coordination coordination = await netops_agent.run( f"Coordinate response for: {analysis.summary}" ) # Stage 3: Field Dispatch dispatch = await dispatch_agent.run( f"Dispatch engineer for incident: {coordination.incident_id}" ) return RunResult( signal=signal, analysis=analysis, coordination=coordination, dispatch=dispatch, ) The orchestrator honours the same contract regardless of backend — hosted , foundry , or local — because all backends implement await agent.run(prompt) . GitHub Copilot SDK Integration (GA) The GitHub Copilot SDK enables conversational interaction with your agent system. FibreOps implements FibreOpsCopilotClient with the same interface as github/copilot-sdk : # src/fibreops/sdk/__init__.py — simplified from fibreops.sdk.client import FibreOpsCopilotClient client = FibreOpsCopilotClient() session = client.create_session() # Query agent status response = session.send_and_wait("status") print(response.text) # Human-readable summary print(response.data) # Structured JSON # Inject a telemetry signal via conversation response = session.send_and_wait(json.dumps({ "signal_id": "sig-demo", "node_id": "FN-LDN-001", "signal_type": "loss_of_light", "severity": "critical" })) The adapter routes prompts by shape: JSON signal-shaped dicts — Forwarded to the orchestrator for processing. Free-form text — Answered by a deterministic responder ( help , status , nodes , engineers , optimiser , dispatch ). Drive it from the terminal: python -m fibreops.demo chat "help" python -m fibreops.demo chat "status" python -m fibreops.demo chat '{"signal_id":"sig-demo","node_id":"FN-LDN-001","signal_type":"loss_of_light","severity":"critical"}' Or hit the embedded HTTP endpoint when the NOC console is running: Invoke-RestMethod -Method Post http://127.0.0.1:8800/sdk/chat -Body '{"prompt":"status"}' -ContentType application/json Development Workflow with Foundry Toolkit for VS Code The Foundry Toolkit for VS Code provides an integrated development experience: Author prompts — Edit system instructions with live preview and token counting. Test locally — Run against the foundry backend with FoundryChatClient pointing at your development model. Iterate fast — The foundry backend resolves definitions locally, so prompt changes take effect immediately without republishing. Publish when ready — python -m fibreops.demo publish creates hosted Prompt Agents in Foundry. Multi-Model Support The Microsoft Agent Framework supports multiple models. FibreOps defaults to gpt-4.1-mini (the model available in most demo Foundry accounts), but any chat-completions deployment works: # .env AZURE_AI_MODEL_DEPLOYMENT=gpt-4.1-mini # or gpt-4o-mini, gpt-4o, gpt-4.1 The framework also supports Claude Code connectors and Magentic-One for multi-agent collaboration scenarios. Testing Strategy FibreOps demonstrates a layered testing approach: Unit tests — Test tools in isolation with mocked dependencies. Local backend tests — Run the full pipeline with LocalAgent for deterministic assertions. Integration tests — Run against real Foundry agents with pytest -q . Rubric evaluation — The optimizer scores every run against defined criteria. # Run the test suite .\.venv\Scripts\python.exe -m pytest -q Key Takeaways The Microsoft Agent Framework provides a unified .run() contract across hosted, foundry, and local backends. Role specialisation keeps agents focused, testable, and independently evolvable. Tools are typed Python functions with docstrings — the runtime generates schemas automatically. The GitHub Copilot SDK (GA) enables conversational interaction with any agent system. Graceful degradation means the entire system works offline for development. The factory pattern lets you switch backends without changing orchestration code. Next Steps Clone the FibreOps repository and run python -m fibreops.demo --signals 3 Microsoft Agent Framework documentation Next in this series: Running Hosted Agents in Microsoft Foundry Agent ServiceCustomer Offerings: Solution Optimization for GitHub Copilot
Introduction As Microsoft Cloud Solution Architects, we are increasingly asked by engineering leaders, platform teams, finance stakeholders, and GitHub administrators how they can scale GitHub Copilot while keeping usage visible and costs predictable. The question is no longer simply how many licenses have been assigned. Agentic experiences, model choice, context size, reasoning level, and task complexity can all influence consumption. To address this challenge, Microsoft customers can engage their account team to request a Solution Optimization for GitHub Copilot engagement. The engagement is designed to help customers create visibility, establish practical cost guardrails, and improve the quality and efficiency of GitHub Copilot usage. The objective is not to minimize every token; it is to help each interaction produce useful outcomes with the right level of capability and control. What changed with GitHub Copilot billing? As of June 1, 2026, GitHub Copilot moved from premium request units to usage-based billing with GitHub AI Credits. When a user interacts with an AI-powered Copilot feature, the interaction can consume input tokens, output tokens, and cached tokens. The model used and the number of tokens processed determine the AI credit consumption, where one AI credit represents $0.01 USD. Area What customers should know Included usage Copilot Business includes 1,900 AI credits per licensed user per month, while Copilot Enterprise includes 3,900. These credits are pooled at the billing entity level. Promotional period At the time of writing, existing Business and Enterprise customers receive higher promotional allowances through August 2026. Validate the current allowance before publishing or making financial decisions. Included experiences Code completions and next edit suggestions remain included on paid plans and do not consume AI credits. Metered experiences AI-powered features such as Copilot Chat, Copilot CLI, Copilot cloud agent, Copilot Spaces, Spark, and supported third-party coding agents consume AI credits. Additional consumption Some agentic experiences, including Copilot code review and cloud agent scenarios, can also consume GitHub Actions minutes in addition to AI credits. Important: Pricing, allowances, supported models, and product behavior can change. The official GitHub documentation and the customer’s commercial agreement remain the source of truth. Why optimization is more than cost reduction Token consumption is only the visible part of the problem. A poorly scoped task, unnecessary context, or the wrong model can cause an agent to misunderstand the request, make excessive changes, or require repeated attempts. In that situation, reducing the price of an individual request does not solve the underlying quality problem. A better optimization strategy starts with agent quality. The right model, clear instructions, focused context, good repository guidance, and deterministic validation can help Copilot complete work in fewer attempts. Better outcomes and lower consumption frequently reinforce each other. Introducing Solution Optimization for GitHub Copilot The Solution Optimization for GitHub Copilot engagement provides customers with an opportunity to work with a Microsoft Cloud Solution Architect to review how GitHub Copilot is being adopted, consumed, governed, and measured. The final scope should be agreed with the Microsoft account team and may vary according to the customer’s licensing model, environment, maturity, and priorities. A typical engagement can focus on the following areas: Usage visibility: Establish a current-state view of adoption, AI credit consumption, model activity, license allocation, and the users or workflows driving demand. Billing readiness: Review exported usage data, compare scenarios, and identify where the move to usage-based billing changes planning assumptions. Cost guardrails: Design user-level, cost-center, organization, and enterprise budget controls that protect the shared pool without unnecessarily blocking productive users. Agent quality and token optimization: Identify improvements to model selection, prompt structure, context management, reasoning levels, repository instructions, and validation steps. Operating model: Define ownership, review cadence, escalation paths, reporting responsibilities, and a prioritized backlog of recommended actions. Potential customer outcomes Depending on the agreed scope, the engagement can help the customer develop: A baseline of GitHub Copilot adoption, AI credit consumption, and cost drivers. A view of heavy users, underused licenses, high-consumption models, and agentic workflows that need closer review. A budget and guardrail design that balances shared-pool flexibility with predictable financial control. Practical recommendations for improving agent quality and reducing avoidable retries or context overhead. A prioritized optimization plan with owners, next actions, and measurable follow-up points. A practical engagement approach Discover: Review the customer’s goals, GitHub billing entity, Copilot plans, license assignment model, existing policies, cost centers, and available usage data. Analyze: Use native GitHub reporting and approved accelerators to examine adoption, AI credit usage, model activity, user patterns, and potential cost drivers. Optimize: Map the right model and reasoning level to each task, improve prompts and context, reduce unnecessary tool or repository context, preserve reusable cache, and plan before executing complex changes. Govern: Define user-level budgets, power-user overrides, cost-center or organization controls, enterprise spending limits, alerts, and ownership responsibilities. Measure: Document the baseline, agree on key indicators, and establish a regular review cycle to measure adoption, value, quality, and consumption over time. Tools and accelerators GitHub AI usage, billing exports, and budget controls GitHub’s native AI usage pages and billing reports should be the starting point for understanding consumption. They provide the information required to identify model usage, users, features, and cost patterns. Native budget controls can then be applied at the appropriate user, cost-center, organization, or enterprise scope. GitHub AI usage dashboard, exported usage report, and budget controls GitHub Copilot Billing Preview The GitHub Copilot Billing Preview is an open-source web application for analyzing Copilot billing CSV reports, comparing request-based and usage-based billing signals, and exploring usage and cost trends by user, organization, model, product, and cost center. CSV processing occurs locally in the browser. The application is a preview and planning tool, not the billing source of record. GitHub Copilot Billing Preview showing usage and cost trends Copilot Insights dashboard The community-developed Copilot Insights dashboard provides centralized views of adoption, license allocation, AI credit consumption, model activity, productivity indicators, and team-level reporting. It can complement native GitHub data when a customer needs richer visualization or executive reporting. Customers should review the project’s security, deployment, support, and governance model before production use. Copilot Insights adoption, license, and AI credit views Agent quality and token optimization principles GitHub’s guidance emphasizes that the most sustainable way to reduce AI credit consumption is to improve the quality and efficiency of each interaction. The following principles provide a useful starting point: Choose the right model for the task. Reserve powerful reasoning models for complex architecture, debugging, and design work. Use mid-tier or lighter models for well-scoped implementation, documentation, formatting, and routine refactoring. Provide clear guidance. State the goal, constraints, expected output, relevant files, and validation criteria. Ambiguous prompts often lead to exploration and rework. Keep context lean. Supply the information needed for the task and avoid loading unrelated repositories, files, tools, or instructions into the context window. Preserve reusable context. Stable instructions and cached context can reduce repeated processing, provided they remain relevant and accurate. Research and plan before implementation. For complex work, separate discovery and planning from execution so the agent does not repeatedly rediscover the same information. Add deterministic guardrails. Tests, linting, build validation, explicit stop conditions, and session limits help prevent long-running or low-quality loops. Measure value, not only consumption. AI credit data should be considered together with adoption, developer experience, quality, delivery outcomes, and business impact. Overview video The on-demand session GitHub Copilot - Token Optimization [AMER/EMEA] explains the relationship between token usage and agent quality. The session covers how large language models, agent harnesses, context windows, and available controls influence agent behavior, quality, consumption, and cost. https://www.youtube.com/live/LeALSSsbzHU?si=4RgxflItkQFAs9Qk Helpful inputs before the engagement The following inputs can help the Microsoft team and customer make the best use of the engagement: A GitHub enterprise or organization owner, billing manager, and relevant engineering or platform stakeholders. Current Copilot plan and license counts, including the billing entity and cost-center structure. A representative GitHub AI usage or billing export, handled according to the customer’s data policies. Existing budgets, spending policies, model policies, and reporting processes. Examples of high-volume agent sessions, code review workflows, or teams reporting unexpected consumption. The business outcomes the customer wants to improve, such as adoption, developer experience, delivery speed, quality, or cost predictability. Conclusion GitHub Copilot usage-based billing changes the conversation from license assignment alone to the broader discipline of operating AI-assisted software development. Customers need visibility into how AI credits are consumed, controls that prevent unexpected spend, and engineering practices that help agents complete work accurately and efficiently. The Solution Optimization for GitHub Copilot engagement can help customers connect usage data to practical decisions, improve agent quality, establish appropriate financial guardrails, and create a repeatable approach for measuring and optimizing GitHub Copilot over time. How do I book this engagement? Microsoft Unified Support customers can contact their Customer Success Account Manager (CSAM) or Microsoft account team and ask about Solution Optimization for GitHub Copilot. The Microsoft team can confirm availability, eligibility, scope, prerequisites, and scheduling for the customer’s environment. Resources GitHub Copilot usage-based billing for organizations and enterprises Getting started with GitHub Copilot budget controls Optimizing AI usage to maximize efficiency and reduce cost Models and pricing for GitHub Copilot GitHub Copilot Billing Preview Copilot Insights dashboard GitHub Copilot - Token Optimization [AMER/EMEA] Disclaimer Pricing, plan entitlements, AI credit allowances, supported models, and product behavior are subject to change. Always verify current information in the official GitHub documentation and the customer’s commercial agreement before making purchasing, budgeting, or technical decisions. The sample applications, dashboards, and scripts referenced in this article are provided AS IS without warranty of any kind and may not be supported under a Microsoft or GitHub standard support program unless explicitly stated. Customers are responsible for reviewing security, privacy, compliance, deployment, and operational requirements before using community or open-source solutions in production. This blog post was drafted with the assistance of generative AI and should be reviewed and approved by the author and relevant Microsoft stakeholders before publication.Creating Autonomous Teams Agents Using OpenClaw, MCP, and Azure Container Apps
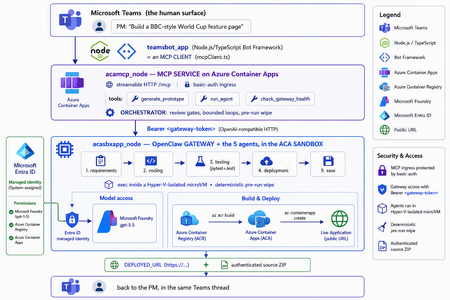
The one shift that changes everything For two years, "AI coding" meant autocomplete. A suggestion appears in your editor, you hit tab, you move on. The agent only existed while you were actively typing. That is no longer the only model. A new category of tools runs asynchronously and autonomously: you message the agent from a chat window — Teams, Slack, Telegram — describe what you want, and walk away. The agent plans, writes code, runs tests, deploys, and hands you back a result. Some of them never sleep: they hold a persistent memory, load their own skills, and act on a schedule without being prompted. This is the world of OpenClaw, Hermes Agent, and the other long-running autonomous agents that exploded across developer culture in 2026. OpenClaw alone crossed 377,000 GitHub stars and millions of active users, becoming — for a while — the most-starred project on GitHub. You install it with one line, connect a channel, and start delegating from your phone. The workflow moves from pair programming to delegation and review. The interactive copilot asks, "What should I write next?" The autonomous agent asks, "What do you need done?" And that reframing is exactly why three questions now keep architects awake: Is it safe? You are handing a self-driving process the ability to run shell commands, touch files, and call APIs. One community report memorably described these agents as a teammate in your group chat who happens to have root access to your codebase. That is not a compliment — it is a threat model. Can it fit into real multi-agent work? A single agent is a demo. Production is a fleet — specialists that hand off to each other with gates in between. Is it flexible and controllable? Autonomy is thrilling right up until the agent packages last week's stale files into this week's deliverable, or loops forever on a failing test. This post answers all three — not with hand-waving, but with a working reference implementation you can clone today: CustomCodingAgentApp in the Multi-AI-Agents-Cloud-Native repo, an "Agentic Prototype Factory" that turns a plain-language idea into a tested, live-on-Azure prototype without leaving the chat window. A product manager types "Build a BBC-style World Cup feature page" in Microsoft Teams. Minutes later they get back a running HTTPS URL and a downloadable source ZIP. Under the hood, five specialized OpenClaw agents powered by Microsoft Foundry gpt-5.5 collaborate in a shared sandbox, run real pytest/Jest suites, and ship the result to Azure Container Apps — all orchestrated behind a Model Context Protocol (MCP) service so any MCP client (GitHub Copilot, Claude, the Teams bot) can drive it. We'll build up to that architecture in the order you should learn it. Part 1 — Long-running autonomous agents, and their two hard problems What actually makes them different A traditional chatbot is text in, text out. It waits for you. An autonomous agent inverts that: Property Traditional chatbot Long-running autonomous agent Execution Responds to a prompt Acts proactively (a "heartbeat" wakes it on a schedule) Scope Words Files, shell, browser, APIs — the real machine Memory This session only Persistent across sessions Interface A web box Any chat channel + the terminal Autonomy None Plans and takes multi-step action on its own Architecturally, OpenClaw is not a library you import — it's a runtime. A single long-running process (the Gateway) bridges your messaging channels to an LLM backend, keeps sessions alive, queues work in ordered lanes, and drives the classic agent loop: call the model → execute the tool calls it asks for → feed results back → repeat until done. There is no rigid step-planner; the model itself steers. That is what makes it feel magical — and what makes it hard to contain. That containment problem has two faces. Hard problem #1 — Security The same properties that make an autonomous agent useful make it dangerous. Full system access + proactive execution + a 32,000-server tool ecosystem is a large, self-driving attack surface. OpenClaw's own short history is the cautionary tale: a critical one-click remote-code-execution CVE early in its life, hundreds of malicious community "skills" discovered on its marketplace, and tens of thousands of gateways found exposed on the open internet. None of this means "don't use autonomous agents." It means: never run one with ambient credentials on a machine you care about. The agent belongs in a box with a hard wall around it. Hard problem #2 — Persistence and continuity Real agent work is long. Refactoring a codebase, researching across dozens of pages, building-testing-deploying an app — these take minutes to hours, far past a single request/response. So the runtime needs durable sessions, a place to keep state, and a workspace that survives across steps. But a persistent workspace that is reused creates its own hazard: state leakage. Files from yesterday's task can contaminate — or get shipped inside — today's result. Continuity and cleanliness pull in opposite directions, and you have to engineer the tension out. One agent is a demo; production is a fleet A single monolithic agent asked to "gather requirements, write the code, test it, deploy it, and package it" will do all four mediocrely and blur the boundaries between them. The production pattern is orchestrator-worker: specialized agents, each with one job, handing off to the next through explicit gates. OpenClaw supports exactly this — it can spawn sub-agents and even dispatch external coding harnesses, acting as a meta-orchestrator rather than a single model. The open question is never whether to go multi-agent; it's where the seams and the guardrails go. The answer to "is it safe?": put the agent in a microVM If the agent needs root to be useful, then give it root — inside a disposable microVM, not on your host. In 2026 there are several credible ways to do this: Kata Containers on AKS — each pod gets its own lightweight VM boundary and guest kernel. Hyperlight Wasm — per-call, snapshot-restored Wasm microVMs for running LLM-generated code. Azure Container Apps dynamic sessions — prewarmed, Hyper-V-isolated sandboxes that start in milliseconds, scale to thousands, and are purpose-built for "secure execution of custom code" and "running LLM-generated scripts." That last one — the ACA sandbox — is the sweet spot for a chat-driven agent factory: strong isolation without you operating a Kubernetes cluster, and an exec API to run commands inside the box. It's what the reference implementation uses. Part 2 — Putting OpenClaw into the ACA sandbox Here is where the repo stops being a diagram and becomes running code. The Agentic Prototype Factory decomposes the "idea → live app" job into five specialized OpenClaw agents that run in sequence, all inside the sandbox: requirements → coding → testing → deployment → save Each is addressable as its own model target on the OpenClaw gateway's OpenAI-compatible API: model value Routes to openclaw / openclaw/default Default agent openclaw/requirements-agent Requirement Agent openclaw/coding-agent Coding Agent openclaw/testing-agent Testing Agent openclaw/deployment-agent Deployment Agent openclaw/save-agent Save & download Agent Control, not vibes: review gates with feedback loops Autonomy without gates is how you get an agent that confidently deploys a broken app. The orchestrator wires the five agents into a graph with hard, bounded gates: Every knob is explicit and lives in server.py: _MAX_TEST_ROUNDS = 3, _MAX_DEPLOY_REVIEW = 2, _DEPLOY_POLL_ATTEMPTS = 12, _DEPLOY_POLL_DELAY_S = 20. The Testing Agent must end each turn with a literal TESTS_PASSED / TESTS_FAILED verdict; the orchestrator won't declare success until it HTTP-checks the deployed URL and inspects the response body — because a ResourceNotFound can happily return an HTTP 200. That is what "flexible and controllable" looks like in practice: the LLM drives creatively inside a deterministic state machine. The deterministic pre-run wipe (solving state leakage) Because the sandbox is reused across runs (fast, cheap), the orchestrator does something disciplined before every run: it wipes all lingering agent workspaces. Stale files from a previous task can never leak into — or be packaged as — the new result. This is the engineered answer to Hard Problem #2. Working with the sandbox's limits, not against them The ACA sandbox exec API is hard-capped at ~120 seconds — shorter than a cold az acr build plus az containerapp create. A naive agent would time out and report failure. The clever bit: those commands finish server-side on Azure even after the client exec disconnects. So deployment is split in two: deploy-build <dir> <app> — installs the deploy helpers, writes a tight .dockerignore, and kicks off the ACR build tagged <app>:latest. If the client drops at ~120s, the image still lands in ACR. deploy-finish <app> — idempotent, polled up to 12×. It reports STILL_BUILDING until the image exists, then fires a --no-wait containerapp create, and finally returns DEPLOYED_URL=https://<fqdn>. This is the single most important lesson of the whole sample: an autonomous agent doesn't need a longer timeout — it needs to understand the durability semantics of the platform it runs on. Part 3 — MCP, and why its security is the whole ballgame The five-agent workflow is powerful, but it would be a silo if the only way to reach it were a bespoke API. Instead, the repo wraps the entire orchestration as a Model Context Protocol (MCP) service (acamcp_node) exposed over streamable HTTP at /mcp, with a tiny, legible tool surface: MCP tool What it does generate_prototype Run the full five-agent workflow end to end run_agent Invoke a single named agent check_gateway_health Liveness / readiness of the OpenClaw gateway The payoff is enormous: any MCP client can now drive the factory — GitHub Copilot, Claude, or the Teams bot we're about to meet. One protocol, many front-ends. But MCP is not just an integration convenience — it's a control plane, and every MCP tool is a privileged capability. In an ecosystem with 32,000+ community servers, "just add an MCP server" is a supply-chain decision. A tool call is code execution by another name. So the security posture has to be deliberate. Here is how the reference implementation hardens it — and the principles are portable to any MCP deployment: Auth in front of the protocol. The MCP ingress sits behind basic auth (MCP_BASIC_AUTH_PASSWORD); the gateway itself requires the gateway token as a bearer credential (Authorization: Bearer <token>). No anonymous tool calls. A tiny, named allowlist — not a blank check. The gateway routes only to six explicit model targets. There is no "run arbitrary agent" escape hatch; the routing table is the allowlist. No secrets in the workload. There are no model API keys anywhere in the running containers — model access is brokered entirely through Entra ID managed identities. The gateway token is stored as a Kubernetes secret and never baked into an image. Private by default. The gateway's OpenAI-compatible endpoint is operator-level access — it stays on private ingress, with TLS and authentication added before anything is ever exposed publicly. Least privilege at the identity layer. The gateway is granted exactly the Foundry roles it needs (Cognitive Services User / Cognitive Services OpenAI User) on the Foundry resource — nothing more. The takeaway for MCP is the same as for the agent itself: treat the protocol as a doorway, and put a guard on the door. Authentication, an explicit allowlist, private ingress, and brokered identity turn MCP from an open blast radius into a governed control plane. Part 4 — The complete solution: Teams + MCP on ACA + OpenClaw on the ACA sandbox Now assemble the three deployable components into one loop: The request lifecycle, end to end A PM sends one sentence in Teams. The teamsbot_app bot — acting as an MCP client via mcpClient.ts — opens an MCP handshake and calls generate_prototype. The MCP service on ACA (acamcp_node) runs the orchestrator: pre-run wipe, then requirements → coding → testing. The OpenClaw gateway in the ACA sandbox (acasbxapp_node) executes each agent, talking to Foundry gpt-5.5 through a managed identity — no keys in the box. Real pytest + Jest suites run inside the sandbox. Fail → loop back (bounded). Pass → deploy. Deployment uses the build + poll split to survive the ~120s exec cap; the app lands in Azure Container Apps and is health-checked body-aware at its live URL. The Save Agent produces an authenticated ZIP download URL. The bot streams each agent's progress back into the Teams thread and returns the running HTTPS URL + source ZIP — optionally auto-opening the project in VS Code Insiders. How the architecture answers the three questions The question How this solution answers it Is it safe? The autonomous agent runs in a Hyper-V-isolated ACA sandbox, not on anyone's laptop. No model keys in the workload — Entra ID managed identity brokers Foundry. MCP behind basic auth; gateway behind a bearer token on private ingress; token as a secret, never in an image. A deterministic pre-run wipe removes cross-run leakage. Does it fit multi-agent work? It is a multi-agent system — five specialist OpenClaw agents with A2A hand-offs and review gates — and because it's exposed via MCP, any client (Copilot, Claude, Teams) can orchestrate it. Is it flexible and controllable? Creativity lives inside a deterministic state machine: explicit TESTS_PASSED/FAILED verdicts, bounded retry loops (_MAX_TEST_ROUNDS, _MAX_DEPLOY_REVIEW), body-aware health checks, and a human approving in the Teams thread. Deploy it yourself The repo ships scripts for all three tiers (the gateway uses the platform's managed identity to reach Foundry — no key handling, no image rebuild): # 1) OpenClaw gateway + the 5 agents (acasbxapp_node) cd acasbxapp_node cp .env.example .env # gateway token, Foundry endpoint, sandbox ids ./scripts/build-openclaw-image.sh # build + push the OpenClaw image to ACR ./scripts/deploy-aks-gateway.sh # grant Foundry roles + deploy # 2) MCP service (acamcp_node) cd ../acamcp_node cp .env.example .env # ACR + cluster; gateway token read from ../acasbxapp_node/.env ./scripts/build-images.sh # build + push the MCP image ./scripts/deploy-aks.sh # secret + manifests to the openclaw namespace ./scripts/smoke-check.sh # verify the MCP handshake # 3) Teams bot (teamsbot_app) — Node.js/TypeScript MCP client cd ../teamsbot_app # configure + run per the folder README, then sideload the Teams app package The reference implementation targets Azure (ACA + AKS) — the OpenClaw gateway and MCP service run as containers, and the code-execution sandbox uses the ACA dynamic-sessions exec API. Keep the gateway on private ingress and add TLS before any public exposure. Final thought Strip away the World Cup demo and a reusable pattern remains — a blueprint for running any long-running autonomous agent in the enterprise: A message-driven agent (OpenClaw / Hermes) + a microVM sandbox (Azure Container Apps dynamic sessions) + an MCP control plane with auth + enterprise identity (Entra ID managed identity) + a human surface (Microsoft Teams). The autonomy that made these agents go viral is the same autonomy that makes security teams nervous. You don't resolve that tension by slowing the agent down — you resolve it by giving it a box with a hard wall, a control plane with a guard on the door, an identity instead of a secret, and a human in the loop. Do that, and "your PM types a sentence, Azure ships an app" stops being a scary demo and becomes something you can actually put in production. Clone it, break it, harden it further: kinfey/Multi-AI-Agents-Cloud-Native → code/CustomCodingAgentApp The chat window is the new terminal. Let's make it a safe one.1.6KViews2likes0CommentsToken Economics: The New FinOps for Agentic AI
In AI applications, tokens are now cost — and token economics deserves architectural attention For a long time, AI application design started with model capability: Can the model write code? Can it reason? Can it use tools? Can it handle long context? Those questions still matter, but in the age of agentic applications, they are no longer sufficient. The more important production question is this: How many tokens does the architecture burn to complete one useful task? A classic chat application often maps one user turn to one model call. An agentic system is different. One user goal can trigger planning, retrieval, tool selection, tool execution, result interpretation, reflection, repair, and summarization. The user sees one instruction; the system may execute dozens of model calls behind the scenes. Tokens are no longer just a measure of text length. They become a measure of system design, runtime behavior, developer workflow, and business cost. GitHub Copilot’s 2026 move to usage-based billing through GitHub AI Credits captures the industry shift clearly. Usage is now aligned with token consumption, including input, output, and cached tokens. That matters because Copilot has evolved from an in-editor assistant into an agentic platform that can handle long, multi-step coding sessions across repositories. In that world, a tiny prompt and a multi-hour autonomous coding workflow should not be treated as the same economic unit. Token economics is therefore not about telling developers to “write shorter prompts.” It is about designing systems where: useful context is preserved, while noise is removed; repeated context is cached or deduplicated; simple tasks do not pay for frontier models; short-term state is managed structurally instead of copied repeatedly; every model call is metered, comparable, and governed. In short: token economics is the practice of making agentic AI economically sustainable. Scenario thinking: GitHub Copilot billing, Copilot SDK, GPT-5.5, Anthropic, and MAI-Code Model The new GitHub Copilot billing model provides a useful framing for developers. Copilot is no longer only autocomplete. It is becoming a programmable agentic platform. It can use models, call tools, work across files, stream responses, and participate in long-running coding workflows. With the GitHub Copilot SDK, developers can embed that agentic runtime into their own applications, services, and developer tools. That is powerful, but it also changes the cost model. Once an agent loop becomes programmable, token cost also needs to become programmable. If a system can plan, call tools, edit files, retry, repair, and summarize, it also needs to meter, route, cache, compress, and evaluate. EvalAgentic gives this idea a concrete playground. The project groups models into cost and capability tiers: Tier Example models Example price / 1K tokens Typical use LARGE claude-opus-4.8, gpt-5.5 $0.030 Agents, code generation, multi-step reasoning MID gpt-5.4-mini $0.012 Dialogue, summarization, extraction TINY gpt-5-mini $0.001 Classification, keyword matching, rule-like tasks This tiering lets us reason about real scenarios: GPT-5.5-class models are valuable for hard reasoning and engineering workflows, but they should not be the default for every step. Using a frontier model for simple classification is like hiring a principal architect to label folders. Anthropic high-capability models can be excellent for complex reasoning and coding, but they benefit from routing discipline. Requirements analysis, test interpretation, deployment explanation, and code generation may not need the same model tier. MAI-Code Model-style coding models should be treated as specialized capability layers. Their value is not just “better code generation”; it is deciding when code-specialized intelligence should be invoked in a larger agent pipeline. The real question is not “Which model is the best?” It is: Which model is the most economical and reliable for this step of this workflow? Four engineering techniques for saving tokens Context Compression: turn long text into executable structure Implementation principle Context Compression converts long natural-language context into the structured information an agent actually needs. Business documents are often verbose: resumes, contracts, product manuals, requirements, and support logs contain narrative text, boilerplate, repeated explanations, and low-value context. The next agent step may only need a few fields. EvalAgentic demonstrates this with a long resume-like input that is compressed into a compact JSON object. Instead of injecting the full original text into every prompt, the system extracts key fields and dynamically injects only the data required by the current task. A practical compression pipeline includes: Redundancy detection — identify long-tail text, repeated descriptions, stale history, and low-value context. Structured extraction — use Copilot or a mid-tier model to transform prose into JSON, tables, or typed schemas. Dynamic injection — inject only the fields needed for the next step. Recoverable references — preserve source pointers so compressed context remains auditable. How to evaluate Prompt token reduction before and after compression. Answer quality and task success rate. Schema fidelity and missing-field rate. Latency improvement. Cost per successful task. Compression is not summarization. Summaries are designed for humans. Structured compression is designed for agents. Prompt Deduplication / Cache: stop paying twice for the same context Implementation principle Many agent systems waste tokens because they repeatedly send the same context. The same resume, contract, repository README, user profile, API documentation, or business rule can be copied across turns and agents. Prompt Deduplication / Cache applies a simple principle: if context has already been processed, do not pay to process it again unless it has changed. A concrete design includes: compute a hash or semantic key for source context; reuse extracted structured results when content is identical or equivalent; apply a TTL for repeated entities, such as the 24-hour cache pattern shown in EvalAgentic; organize stable prompt prefixes to benefit from provider-level prompt caching where available; store shared context in an artifact store or memory layer so multiple agents do not copy the same blob. How to evaluate Cache hit rate. Cached token ratio. Duplicate prompt rate. Cost delta before and after caching. Correctness under cache, especially stale-cache failures. Caching is not “save everything forever.” Good caching knows when to reuse and when to invalidate. On-Demand Model Routing: let task complexity decide model tier Implementation principle On-Demand Model Routing routes each request to the cheapest model that can complete the task reliably. The entry point can use a rule tree, a lightweight classifier, or a hybrid complexity score. EvalAgentic’s routing tree is intentionally easy to explain: INCOMING REQUEST └─ Prompt < 500 tokens? ── YES ─→ TINY: classify / extract └─ NO ──→ multi-step reasoning? ├─ NO ─→ MID: dialogue / summary └─ YES ─→ LARGE: agent / code The engineering logic is straightforward: simple classification and keyword matching go to TINY; summarization and structured conversion go to MID; multi-step reasoning, coding, cross-file changes, and orchestration go to LARGE; code-specialized models such as MAI-Code Model can be placed in the coding phase rather than used across the whole pipeline. How to evaluate Routing accuracy. Cost per route. Quality regression by tier. Escalation rate from small models to larger models. End-to-end success rate. Routing does not mean “always use the smallest model.” It means frontier intelligence is reserved for the steps where it actually changes the outcome. Short-term Memory: preserve state instead of replaying history Implementation principle Short-term Memory controls context growth across multi-turn and multi-agent workflows. Without it, agents often replay the full conversation history, full tool outputs, and full intermediate reasoning on every turn. The context grows; quality may not improve; the bill definitely does. A better design stores state structurally: user goal; current plan; tool outputs and references; failure reasons; next actions; handoff artifacts between agents. In a multi-agent coding pipeline, the Requirements Agent should hand off a structured spec. The Coding Agent should read that spec, not the entire prior conversation. The Testing Agent should consume testable artifacts, not every word produced by the Coding Agent. How to evaluate Context growth curve across turns. Memory retrieval precision. Rework rate caused by missing state. Recovery quality after failed steps. Average input tokens per turn. Short-term memory is not about remembering everything. It is about remembering the next useful thing. EvalAgentic as a concrete evaluation example EvalAgentic is effective as an evangelism project because it turns token economics into an observable before/after system. The architecture has five layers: Frontend — frontend/index.html provides Tabs A / B / C, live SSE logs, and before/after charts. API — backend/server.py exposes FastAPI routes and Server-Sent Events streaming. Orchestration — eval.py handles A/B evaluation; coding_agents.py handles the multi-agent coding scenario. Core — compressor.py, router.py, gh_models.py, and token_meter.py implement compression, routing, Copilot SDK calls, and token metering. Providers — GitHub Copilot SDK and Microsoft Agent Framework provide model access and agent orchestration. Tab A: Compression comparison Tab A compares long-form context before and after structured compression. The key message is that token saving does not come from writing a clever sentence. It comes from converting verbose context into a structured artifact that downstream agents can consume efficiently. Tab B: On-demand model routing Tab B demonstrates that cost is not only about raw token count. If a system routes simple tasks to cheaper tiers and reserves expensive models for complex reasoning, total cost can fall even if some token counts increase. This is a subtle but important point: token economics is not token starvation; it is model portfolio optimization. Tab C: Coding scenario — multi-agent with Agent Framework Tab C is the most persuasive demo. The same deliverable — a Taobao-like goods-list site with HTML + JavaScript frontend, Flask backend, and Docker deployment — is produced twice by a four-agent pipeline: Requirements Agent; Coding Agent; Testing Agent; Deployment Agent. The before pipeline uses no compression and sends every agent to GPT-5.5 / LARGE. The after pipeline injects a compressed JSON spec and uses on-demand routing: requirements can use MID, coding can use LARGE, testing can use MID, and deployment can use TINY. This mirrors real enterprise development. Architecture and complex code generation may deserve frontier models. Test interpretation, deployment packaging, and simple validation often do not. Summary and refinement based on the project diagrams The EvalAgentic README describes three important visuals: the architecture flow, the routing tree, and the token-meter design. Together, they form a governance loop: User Scenario ↓ Context Compression ↓ Prompt Deduplication / Cache ↓ On-Demand Model Routing ↓ Short-term Memory ↓ Token Metering & Budget Actions ↓ Before / After Evaluation Optimize the path, not only the prompt Many teams start token optimization by editing prompt wording. That helps, but the largest waste usually lives in the execution path: how many calls are made, how much context is repeated, how often tools retry, and whether every step uses the same expensive model. EvalAgentic makes the path visible through A/B comparisons. Token Meter is the control plane of cost governance EvalAgentic’s token_meter.py uses a non-invasive interceptor pattern: INTERCEPTOR (@token_meter) ↓ COUNTER CORE: accounting / budget threshold / trigger ↓ ACTION HUB: throttle (>80% budget) / rollback (>budget) This is the right architectural instinct. Production systems need thresholds, throttling, rollback, and traceability. Without those controls, one retry loop can quietly turn a small user request into a budget incident. Cost metrics must be evaluated with quality metrics A system that cuts cost by 80% but drops success rate by 50% is not optimized. It is broken more cheaply. The evaluation matrix should combine cost, quality, latency, and reliability: Dimension Metric Why it matters Cost Cost per successful task Measures the real unit economics Token Input / output / cached tokens Identifies compression and cache opportunities Quality Pass rate / regression rate Ensures cheaper tiers do not break outcomes Efficiency Latency / retry count Prevents cheap models from causing expensive retries Governance Budget breach / rollback count Validates runtime control Narrative A simple three-line narrative works well for demos: Token is no longer a technical detail. It is the bill of your architecture. EvalAgentic shows the same scenario before and after cost-aware design. The goal is not to make models cheaper; the goal is to make agent systems economically governable. For a developer audience, the sharper version is: A good agent does not use the biggest model everywhere. It uses the right intelligence at the right step, with the right context, under the right budget. Practical recommendations for real projects Establish a token baseline first. Measure input, output, retries, tool calls, and cost per scenario before optimizing. Make compression a component, not a prompt habit. Define schemas, cache policies, and fallback behavior. Introduce a model routing matrix. Route by task type, complexity, risk, latency, and cost. Define handoff contracts between agents. Pass structured artifacts, not endless conversation history. Evaluate every optimization with A/B tests. Compare cost, quality, latency, and stability. Add budget actions. Throttle at a threshold, rollback on breach, and add circuit breakers for failed retries. Closing: token economics is the second curve of agent engineering The first phase of AI application development was about calling models. The second phase was about putting models into products. The next phase of agentic AI is about running those systems reliably, affordably, and governably. EvalAgentic matters because it turns Context Compression, Prompt Deduplication / Cache, On-Demand Model Routing, and Short-term Memory into something developers can run, compare, and explain. It moves token economics from opinion to instrumentation. Future AI applications will not only ask: How smart is this agent? They will ask: How many tokens does it spend per completed task? Which model did it use? Did it hit cache? Did retries run away? Did the system reserve frontier intelligence for the steps that deserved it? References kinfey/EvalAgentic GitHub Copilot is moving to usage-based billing Updates to GitHub Copilot billing and plans Copilot SDK - GitHub Docs8.2KViews4likes0CommentsGitHub Copilot App - Canvas Is Not a UI Builder
What if your development environment didn't just help you write code, but helped you observe, steer, and evolve a living system while it runs? That's the shift GitHub Copilot App Canvas represents. Canvas redefines how developers interact with agent-driven software: not by building traditional user interfaces, but by creating interactive environments where humans and AI co-create, test, and iterate in real time. This post walks through a real Canvas extension we built, a Multi-Agent Dev Canvas that demonstrates how Canvas becomes a runtime observability and control plane for an agent-driven system. We'll cover why Canvas exists, how it differs from traditional UI development, and how you can use it to accelerate the design-test-evolve loop for any multi-agent application. The Misconception: "Canvas Is for Building UIs" The first instinct many developers have when they see Canvas is to treat it like a UI framework, a place to build dashboards, boards, or user-facing applications. That's not what Canvas is for. Here's the distinction that matters: Traditional UIs are for using software. They serve end-users who interact with a finished product. Canvas is for shaping software while it runs. It serves developers and AI agents who are actively building, testing, and evolving a system. Canvas solves problems your final UI should never try to solve in a visible way. It's the observability layer, the control plane, the validation surface — all the things you need during development that disappear before production. Think of it this way: you wouldn't ship your debugger to users, but you absolutely need it while building. What We Built: A Multi-Agent Dev Canvas To demonstrate Canvas as a development runtime, we built a Multi-Agent Dev Canvas, a standalone GitHub Copilot Canvas extension (this repo, copilot-canvas-runtime) that treats an entire multi-agent system as a living, observable environment. The same pattern applies to any agent-driven system built on services such as Microsoft Foundry. The Multi-Agent Dev Canvas: a runtime observability and control plane where developers and AI agents collaborate to design, test, and evolve an agent-driven system in real time. The canvas provides four integrated panels: System View: See Your Agents Working Five specialised agents are displayed as live cards with real-time status indicators. Each card shows the agent's name, responsibility, current status (idle, running, done, or error), task count, and last action taken. When an agent is active, its card pulses blue. When it fails, it glows red. You see the system breathe. decompose_system — Breaks requirements into agent tasks execute_workflow — Coordinates agents to perform tasks validate_output — Runs evaluation tests and returns structured results update_system_design — Modifies architecture based on feedback track_state — Persists and updates system state over time Task Flows: Watch Work Move Through the Pipeline Below the agents, a flow graph visualises how tasks route between agents. When you decompose a system requirement like "Build an AI-powered code review agent," the canvas shows five components (pr-ingestion, code-analysis, feedback-generator, learning-loop, notification-service) flowing from the decomposer to the executor and designer agents. Each flow carries a status badge, pending, pass, or fail. Validation Panel: Continuous Testing, Not Afterthought Testing The validation panel displays structured test results with pass/fail badges and reasoning. When you run validation, each test case evaluates against specific criteria: ✅ "PR ingestion handles large diffs" — Meets criteria: process diffs over 5,000 lines without timeout ❌ "Feedback is actionable" — Failed: does not satisfy criteria that each suggestion includes a code fix ✅ "Learning loop converges" — Meets criteria: accept rate improves over 10 iterations ✅ "Notifications are non-blocking" — Meets criteria: delivery latency under 500ms This isn't a test runner you invoke separately, it's a validation surface embedded in the development loop. You see failures the moment they happen, in context, alongside the agents and flows that produced them. Live State Timeline: Every Mutation, Visible The right panel tracks every state change with timestamps. Decomposition events, workflow executions, validation runs, failure injections — all appear chronologically. This is the system's memory, visible to both the human developer and the AI agents working alongside them. Canvas as a Runtime: The Key Capabilities What makes Canvas a runtime rather than a display layer is that the agent can act through it. The canvas exposes seven agent-callable actions: Action What It Does decompose_system Accept requirements and components, generate task flows, update the system design execute_workflow Run pending tasks through the agent pipeline, produce artifacts validate_output Evaluate test cases against criteria, return structured pass/fail with reasoning update_system_design Modify the architecture description, constraints, or component list live track_state Read the full system state — agents, flows, validations, history, artifacts inject_failure Force an agent into an error state to test system adaptation pause_resume Toggle execution on and off The human developer can click Decompose, Execute, or Validate directly in the canvas. The AI agent can invoke the same actions programmatically. Both parties operate on the same surface, the same state, the same system, that's what makes Canvas collaborative in a way traditional tooling is not. Why This Matters: Canvas vs. Figma vs. Traditional UIs It helps to position Canvas against tools developers already know: Figma is Human-to-Human collaboration on design. Multiple people interact with the same visual surface, but nothing executes. It's a design tool. Traditional UIs are Human-to-System. Users interact with finished software through a polished interface. Canvas is Human-to-AI-to-System. It's a shared space where things actually execute. The developer steers, the AI acts, and the system evolves, all visible, all in real time. Canvas is collaborative in the Figma sense — it's a shared space, it's visual, multiple participants interact with the same surface. But unlike Figma, the participants include AI agents, and the surface isn't a mockup — it's a live system. How the Extension Works: Under the Hood A Canvas extension is a standard GitHub Copilot CLI extension, a single extension.mjs file that speaks JSON-RPC over stdio. The key components: 1. State Management Each canvas instance maintains its own system state: agents, task flows, validations, a state history timeline, artifacts, and the current system design. State is held in-memory per instance and pushed to the iframe via Server-Sent Events whenever it changes. function createInitialState() { return { agents: [ { id: "decomposer", name: "decompose_system", status: "idle", responsibility: "Break requirements into agent tasks" }, { id: "executor", name: "execute_workflow", status: "idle", responsibility: "Coordinate agents to perform tasks" }, // ... three more agents ], taskFlows: [], validations: [], stateHistory: [], artifacts: [], systemDesign: { description: "", constraints: [], components: [] }, execution: { paused: false, stepCount: 0 }, }; } 2. Real-Time Updates via Server-Sent Events The canvas runs a loopback HTTP server per instance. The iframe connects to an /events endpoint and receives state updates as they happen — no polling, no websocket complexity. if (req.url === "/events") { res.writeHead(200, { "Content-Type": "text/event-stream", "Cache-Control": "no-cache" }); clients.add(res); // Push current state immediately on connect res.write(`data: ${JSON.stringify(getState(instanceId))}\n\n`); } 3. Dual Interaction Model Every action is available through two paths. The human clicks a button in the iframe, which POSTs to the local server. The AI agent calls invoke_canvas_action through the SDK. Both paths mutate the same state and trigger the same SSE broadcast. Neither is privileged over the other. 4. Canvas Declaration The canvas registers with the Copilot SDK using createCanvas , declaring its identity, description, and all agent-callable actions with JSON Schema validation on inputs: createCanvas({ id: "multi-agent-dev", displayName: "Multi-Agent Dev Canvas", description: "Runtime observability and control plane for multi-agent development", actions: [ { name: "decompose_system", description: "Break requirements into agent tasks", inputSchema: { type: "object", properties: { requirements: { type: "string" }, components: { type: "array", items: { type: "string" } } }, required: ["requirements"] }, handler: async (ctx) => { /* ... */ }, }, // ... six more actions ], open: async (ctx) => { /* start server, return URL */ }, onClose: async (ctx) => { /* clean up */ }, }); Scenarios This Enables The Multi-Agent Dev Canvas supports four development scenarios that would be impossible with traditional tooling: 1. End-to-End Feature Design Tell the agent "Build an AI-powered code review system." Watch it decompose the requirement into five components, route tasks to specialist agents, execute the workflow, and validate the outputs, all visible in real time. Iterate by modifying constraints or components and re-running. 2. Live Agent Collaboration Observation See how agents hand off work to each other. The flow graph shows which agent produced what, which tasks are pending, and where bottlenecks form. This is the kind of observability you need when debugging multi-agent orchestration but would never expose in a production UI. 3. Fault Injection and Adaptation Testing Use inject_failure to force an agent into an error state. Watch how the system responds. Does the orchestrator recover? Do downstream tasks fail gracefully? This chaos-engineering approach, applied during development, visible in real time, catches integration failures before they reach production. 4. Validation-Driven Iteration Define test criteria, run validation, see which tests fail, update the system design, re-run. The validation panel isn't a separate CI pipeline, it's embedded in the development surface, creating a continuous feedback loop between design decisions and their measurable outcomes. Getting Started: Build Your Own Canvas Extension To create a Canvas extension in your own project: Read the SDK docs — Run extensions_manage({ operation: "guide" }) in GitHub Copilot CLI to get the canonical documentation paths. Scaffold — Run extensions_manage({ operation: "scaffold", kind: "canvas", name: "my-canvas", location: "project" }) to generate the boilerplate. Implement — Edit extension.mjs with your canvas logic: state model, actions, renderer HTML, and SSE updates. Reload — Run extensions_reload to activate your changes. Drive — Open with open_canvas , invoke actions with invoke_canvas_action , and iterate. The canvas extension lives in .github/extensions/your-canvas/extension.mjs for project-scoped extensions, or in your user extensions directory for personal use. No package.json needed, the github/copilot-sdk import is auto-resolved. Key Takeaways Canvas is a development runtime, not a UI framework. You don't build Canvas instead of your UI, you use Canvas to figure out, test, and evolve the UI and system before and during building it. Canvas solves problems your final UI should never expose. Agent observability, fault injection, live state mutation, validation feedback loops, these are development concerns, not user concerns. Canvas is Human-to-AI-to-System collaboration. Both the developer and the AI agent operate on the same surface, the same state, the same running system. It's Figma-like collaboration, but with AI agents, and things actually execute. Canvas turns debugging, testing, and execution into a continuous visual feedback loop. Instead of switching between an editor, a terminal, a test runner, and a monitoring dashboard, you have one surface where the system lives and evolves. Canvas extensions are lightweight. A single extension.mjs file, no dependencies, loopback HTTP server with SSE, the infrastructure gets out of the way so you can focus on the system you're building. The Bigger Picture Canvas redefines software development by shifting from writing static code to orchestrating living systems. Developers and AI co-create, observe, and evolve solutions in real time. Instead of building UIs for users, we build interactive environments for agents, turning debugging, testing, and execution into a continuous, visual feedback loop that accelerates innovation and brings ideas to production faster than ever. The Multi-Agent Dev Canvas we built here is one example. The pattern applies anywhere you're building agent-driven systems: AI orchestration, workflow automation, data pipelines, autonomous services. Anywhere you need to see, steer, and validate a complex system as it runs, that's where Canvas belongs. Resources copilot-canvas-runtime — this repository: the Multi-Agent Dev Canvas extension, scenario, and demo prompt GitHub Copilot Documentation — Official documentation for GitHub Copilot features Microsoft Foundry Documentation — Build and deploy AI agents with Microsoft Foundry1.4KViews0likes0CommentsGitHub Copilot App Canvas Is a Runtime
There is a quiet shift happening in how we build software with AI. We are moving from writing static code to orchestrating living systems where developers and AI agents co-create, observe, and evolve a solution in real time. This post is a working theory of what GitHub Copilot App Canvas is actually for, grounded in a real, runnable demo you can clone today: leestott/agent-runtime-canvas. The Agent Runtime canvas open beside the chat — control bar, activity spotlight, requirement & constraints, and the live agent roster. The headline claim, which the rest of this post defends with code: Traditional UIs are for using software. Canvas is for shaping software while it runs. 1. The misconception worth getting out of the way The first instinct most engineers have when they see Canvas is to build a UI with it a dashboard, a DevOps board, an admin panel. That is the wrong mental model, and it leads to disappointment. A Kanban board rendered in Canvas is just a worse version of a tool that already exists. Canvas is not where your users live. It is where your system becomes visible to you and to the AI while you are still figuring it out. The distinction matters: You don't build Canvas instead of your UI. You use Canvas to figure out, test, and evolve the UI and the system before and during building it. Canvas solves problems your final UI should never try to solve in a visible way agent coordination, intermediate state, test validation, failure propagation. These are observability concerns, not end-user features. Canvas is intended for test validation and the implementation of agent-driven solutions not for shipping a production control panel. A useful analogy: Figma is Human-to-Human one person designs a static artifact for another person to read. Canvas is Human-to-AI-to-System a shared surface where a human, an AI agent, and a running system all act on the same live model. Figma shows you a picture of the software. Canvas is a runtime where things actually execute. 2. The positioning, stated plainly Here is the thesis the demo is built to prove: Canvas redefines software development by shifting from writing static code to orchestrating living systems, where developers and AI co-create, observe, and evolve solutions in real time. Instead of building UIs for users, we build interactive environments for agents — turning debugging, testing, and execution into a continuous, visual feedback loop that accelerates innovation and brings ideas to production faster than ever. Read that again with the demo in mind, because the demo is not a slide, it is a working Copilot CLI extension that renders exactly this loop. 3. What we built: the Agent Runtime canvas agent-runtime-canvas is a GitHub Copilot CLI canvas extension called Agent Runtime. It turns Canvas into a runtime observability and control plane for a multi-agent software system that is being designed, tested, and evolved in real time. The canvas renders a single living SystemModel that both humans and the AI agent edit at the same time. The agent drives it through five canvas actions; the human drives it through panel controls. Every change streams to the iframe over Server-Sent Events (SSE), so the system visibly evolves through interaction. The seven panels: a system you can watch think Panel What it makes observable Requirement & constraints The feature under design plus editable policies and constraints Agents Active agents, their responsibilities, and live state (idle / working / done / error / blocked) Task Flow The dependency graph of tasks across agents, with live status Artifacts The intermediate outputs each task emits Validation Test cases, pass/fail, expected vs. actual, and the reasoning behind each verdict Live State The shared memory objects the agents read and write — directly human-editable Timeline A change-over-time log, including before→after state diffs None of these are things you would put in front of an end user. All of them are things you desperately want to see while you and an AI are co-designing an agentic system. The five agent actions The AI co-creates and evolves the system by calling five actions, declared in the canvas extension: Action Effect decompose_system Break a requirement into collaborating agents + a task-flow graph execute_workflow Coordinate agents to advance tasks ( step / run / pause / resume / reset ) validate_output Run evaluation tests, return structured pass/fail + reasoning update_system_design Modify architecture/logic: requirement, constraints, agents, tasks track_state Persist/update a shared state object, recording the diff on the timeline The critical detail is that human controls and agent actions funnel through the exact same store. There is no separate "AI view" and "human view" — one model, two kinds of participant. 4. How it actually works (the parts that matter) The extension is deliberately small and dependency-free. It uses only Node's built-in modules plus github/copilot-sdk , which the CLI auto-resolves. Three files do the work: .github/extensions/agent-runtime/ extension.mjs # wiring: loopback HTTP server, SSE, /control, 5 canvas actions store.mjs # durable SystemModel + execution engine + validation ui.mjs # iframe renderer (system view, validation, state, timeline) One shared model, broadcast on every mutation The heart of the demo is the SystemStore . It is an EventEmitter : every mutation bumps a version, appends a timeline entry, persists to disk, and broadcasts a fresh snapshot to all connected panels. This is the single line that makes "humans and AI edit the same live system" true rather than aspirational: // store.mjs — every change is versioned, logged, persisted, and broadcast. _commit(eventType, summary, detail) { this.model.version += 1; this.model.updatedAt = now(); if (eventType) { this.model.timeline.unshift({ id: uid("ev"), ts: now(), type: eventType, summary, detail: detail || null, }); this.model.timeline = this.model.timeline.slice(0, 200); } this._queueSave(); // best-effort JSON persistence under ~/.copilot this.emit("change", this.model); // fan out to every SSE client return this.model; } The agent action and the human button hit the same method In extension.mjs , the canvas action handler and the iframe's /control POST both call store.execute(...) . That symmetry is the whole point — neither the human nor the AI is privileged: // extension.mjs — a human control POST maps onto the same store method // the AI agent calls through the execute_workflow canvas action. function applyControl(store, body) { switch (body.action) { case "execute": return store.execute(body.mode || "step", body); case "validate": return store.validate(body.tests); case "decompose":return store.decompose(body.requirement, body); case "inject_failure": return store.injectFailure(body.taskKey); case "edit_state": return store.editState(body.key, body.value); // ...requirement, constraints, clear_failures, update_design } } Execution you can watch one task at a time The engine advances the task graph through a visible begin→dwell→finish lifecycle so the active agent is always observable. A ready task is one whose dependencies are all done : // store.mjs — the scheduler only starts a task when its deps are satisfied. _readyTask() { return this.model.tasks.find( (t) => t.status === "pending" && t.deps.every((d) => { const dep = this.model.tasks.find((x) => x.id === d); return dep && dep.status === "done"; }), ); } When a task finishes, its agent emits an artifact and writes to shared state; when a dependency fails, the engine walks the graph to a fixpoint and marks every downstream task blocked . That is failure propagation you can see — exactly the kind of thing a production UI would (correctly) hide, and exactly the kind of thing you need exposed while designing the system. Validation as a first-class, re-runnable citizen The default evaluation suite asserts properties of the running system, not of static code — every test returns an expected value, an actual value, and a human -readable reason: // store.mjs — tests assert properties of the live system model. _defaultTests() { const t = (name, target, assertion) => ({ id: uid("test"), name, target, assertion }); return [ t("All tasks reach a terminal state", "tasks", "no_pending"), t("No tasks failed", "tasks", "none_failed"), t("Every completed task emitted an artifact", "artifacts", "artifact_per_done"), t("Design state populated before build", "state", "design_before_build"), t("Decision recorded by Reviewer", "state", "has_decision"), ]; } This is the "continuous, visual feedback loop" from the thesis, made concrete: decompose → execute → validate → redesign → re-validate, with the Timeline recording every before→after transition. 5. Run it yourself You need a GitHub Copilot CLI / app with canvas support (the canvas-renderer capability) and this repo opened as your workspace. There is no npm install the SDK is auto-resolved and the extension uses only built-in Node modules. Clone and open the workspace. git clone https://github.com/leestott/agent-runtime-canvas.git cd agent-runtime-canvas The extension auto-discovers from .github/extensions/agent-runtime/ . Open the canvas with a requirement. Ask Copilot: Open the Agent Runtime canvas with the requirement "Add CSV export to the reports page". Walk the loop. Decompose into five agents and a six-task graph, press Run ▶, watch the spotlight track the active agent, press Run tests ✓ for 5/5 green, then Inject failure ⚡ to watch downstream tasks go blocked and validation drop to 4/5 — and recover. State persists per documentId under ~/.copilot/extensions/agent-runtime/artifacts/ , so a reload resumes exactly where you left off. The companion demoscript.md in the repo gives you a tight, timed walkthrough. 6. Why this is an observability story Once you accept that Canvas is a runtime rather than a UI, the most compelling use case becomes observability of agentic systems. Agentic software is notoriously hard to debug: the interesting behavior lives in intermediate state, coordination order, and the moments where one agent's failure cascades into another's. A production UI is designed to hide all of that. A Canvas is designed to surface it, temporarily, while you are shaping the system — and then get out of the way. This reframes Canvas alongside the broader Microsoft and GitHub agent tooling story. As teams adopt the GitHub Copilot SDK and patterns like the open Model Context Protocol to wire agents into real systems, the gap is rarely "can the agent act?" it is "can a human see what the agent did, judge it, and steer it?" Canvas is a candidate answer to that second question. When you take agents toward production on Azure with services like Microsoft Foundry, the same instinct applies: build the evaluation and observability loop first, and let it shape the system before you commit a single end-user pixel. 7. The open question: why can't Canvas be multi-user? There is an obvious next frontier, and it is worth stating as an honest open question rather than a finished feature. Everything that makes Canvas valuable also makes it a natural collaborative surface: It is a shared space. It is visual. It is collaborative. Multiple participants — human and AI — interact with the same surface. If Figma earned its place by making Human-to-Human design multiplayer, the provocative question is whether a project- or repo-scoped Canvas can make Human-to-AI-to-System development multiplayer too: several engineers and several agents shaping one running system on one surface. The demo here is single-user by design, but its architecture — one shared store, versioned, broadcast to every subscriber — is already the shape you would need. That is a genuine research direction, and worth experimenting with as licensing and access broaden. 8. Honest limitations In the spirit of building credibility rather than hype: This is a demonstration. The decomposition, artifacts, and state are synthesized to make the runtime loop legible — it models an agentic system rather than running arbitrary production agents. It is single-user and single-machine. The loopback HTTP server and per-document store are local by design; multi-user is an aspiration, not a shipped capability. Access is gated. Canvas support requires a Copilot CLI/app build with the canvas-renderer capability. Licensing and preview access are the biggest practical blockers to wider experimentation today. Persistence is best-effort. State is written to a local JSON artifact; treat it as demo durability, not a database. Key takeaways Don't build a UI in Canvas. Use Canvas to shape, test, and evolve a system — and the UI — while it runs. Traditional UIs are for using software; Canvas is for shaping software while it runs. Canvas is Human-to-AI-to-System, a runtime where things execute — not a static design surface. Its strongest use case is observability and validation of agentic systems: surface the intermediate state your production UI should hide. The shared-model architecture — one versioned store broadcast to every participant — is what makes human + AI co-editing real, and what hints at a multi-user future. Next steps Clone and run the demo: github.com/leestott/agent-runtime-canvas. Read the extension source under .github/extensions/agent-runtime/ — start with store.mjs . Explore the building blocks: the GitHub Copilot SDK, the Model Context Protocol, and Microsoft Foundry for taking agentic systems toward production. Try the multi-user thought experiment: fork the store, add a second subscriber, and ask what changes when two humans and two agents share one surface.725Views1like0Comments