finops
14 TopicsManage AI Cost + ROI with Copilot and Agent 365
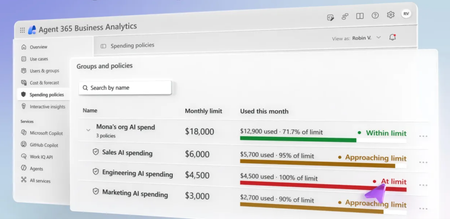
Take control of AI spend across Microsoft Copilot, Cowork, and agents inside and outside of Microsoft. Track your own Copilot Credit usage task by task, pin down your top cost drivers by service and model provider in Agent 365 Business Analytics, and weigh each use case’s cost against its measured AI value. Forecast month-end spend, model a shift to lower-cost models, and enforce hard budgets with spending policies scoped to users, groups, or shared agents in the Microsoft 365 admin center. Delegate budget control to the owners closest to the work. Jeremy Chapman, Microsoft 365 Director, shares how users, budget owners, and IT admins each play a part in turning AI spend into measurable value. Pin down exactly where your AI budget goes. Agent 365 Business Analytics breaks spend down by service, model provider, and use case, from GitHub Copilot to Cowork. See how it works. Cost per use case. Value per use case. Side by side. Track sessions, spend, and AI value across Sales and every business domain with Agent 365 Business Analytics. Check it out. Budgets that enforce themselves. Spending policies in the Microsoft 365 admin center cap AI spend, trigger alerts before limits hit, and control which models teams use. Start here. 👥 Who it’s for: IT admins and Microsoft 365 admins setting up usage-based billing and AI budgets, FinOps and budget owners managing Copilot and agent spend, and CIOs and business leaders measuring AI ROI across their organization. ⏱️ Chapters: 00:00 Control AI spend across Copilot and agents 00:46 Track your own Copilot usage and limits 01:22 How Copilot Credits measure AI consumption 01:36 Measure AI ROI in Agent 365 Business Analytics 02:52 Pin down top cost drivers by model 03:35 Spot top users and spread best practices 03:57 Weigh use case cost against AI value 05:04 Forecast month-end cost and model scenarios 05:51 Raise spending limits as a budget owner 06:37 Enable usage-based billing in Microsoft 365 07:19 Create spending policies with hard limits 08:35 Delegate budget roles to owners outside IT 09:32 Start with Business Analytics and admin setup Every advanced AI task in Microsoft Copilot, from a simple prompt to a complex Cowork or agent workflow, consumes Copilot Credits. One Copilot Credit currently equals one cent in US dollars. Users check their own consumption under Usage details in Copilot, with a seven-day view, remaining monthly limit, and credits used per task. Agent 365 Business Analytics gives managers, budget owners, and CIOs an organization-wide or filtered view of AI usage and cost by manager hierarchy, organization, or job function. Break down spend by service, model provider, and use case. Compare services like GitHub Copilot and Cowork, and use the combined view to see which models each service relies on and how that adds up to cost. The Use cases view maps sessions, cost, and AI value by business domain, with AI value calculated from the time it would take a person to do comparable work, using official sources including the US Department of Labor. Cost & Forecast projects month-end cost and shows what drives increases and decreases by job function, model, and service. Model what-if scenarios, such as a spending cap, expanded access, or a shift to lower-cost models, and compare the results with current usage. In the Microsoft 365 admin center, IT admins enable usage-based billing with an Azure subscription on pay-as-you-go or prepaid billing, then create spending policies under Cost Management. Scope policies by identity or by resource, such as a shared agent, set cumulative and per-user monthly limits, configure alerts, and control which models are allowed with templates. Assign Delegator, Writer, and Reader roles so budget owners outside IT manage policies directly from Agent 365 Business Analytics. 🔗 Related links: — Check out Agent 365 Business Analytics at https://aka.ms/A365Analytics — Activate usage-based billing and set up your policies at https://admin.microsoft.com Unfamiliar with Microsoft Mechanics? Microsoft’s Official Video Series for IT — Subscribe https://www.youtube.com/c/MicrosoftMechanicsSeries — Microsoft Tech Community: https://techcommunity.microsoft.com/t5/microsoft-mechanics-blog/bg-p/MicrosoftMechanicsBlog — Podcast: https://microsoftmechanics.libsyn.com/podcast Join us on social: — https://twitter.com/MSFTMechanics — https://www.linkedin.com/company/microsoft-mechanics/ — https://www.instagram.com/msftmechanics/ — https://www.tiktok.com/@msftmechanics Video Transcript: -With Agent 365 Observability Platform, you have the full visibility and control of your organization’s AI spend, including Copilot, Cowork, and agents inside and outside of Microsoft. In fact, everyone, whether you’re an individual user, an IT admin, or a group leader can play their part in tracking AI usage costs and maximizing value. Additionally, as a manager or business leader, you gain visibility into Copilot usage and costs across your organization or area of responsibility, helping you measure impact while optimizing your investments and value from these services. And as an IT admin, you can set budgets with thresholds to control spend and track how advanced capabilities are being adopted across your organization. -Let’s get started with the Copilot experience itself and how as a user you can track your own costs. So here I’m in Copilot on the Home tab and I’ve just run Cowork. So if I’m curious to know how much I’ve used across different advanced AI services, I can head up into the More actions ellipse menu and find usage details based on my activities across a seven-day period. And I can see here that I have 25% of my limit remaining in November. And if I scroll down and then I click into one of these days, it details the tasks from that day and the credits that were used for each. So as you saw, AI usage is measured using Copilot Credits as the unit of AI consumption. At present, one Copilot Credit equates to one cent in US dollars. Simple tasks use fewer credits while more complex agent workflows will use more. -Next, if you’re a manager, budget owner, or business leader, the new Agent 365 Business Analytics lets you view and assess whether your organization is getting the right level of value from your AI spend. I’m in Agent 365 Business Analytics. And based on your level in your organization and your permissions, you can see how AI is delivering results for your team, including total number of AI users across chat, usage-based services, and GitHub Copilot, as well as the high-level cost breakdown that you can use to optimize ROI. At the top, you can even drill down, and depending on your access that you have, you can see whether you want to look across your entire organization or different parts of your organization. -For example, here, I can see the top-level manager hierarchies, different organizations within my company, or even job functions. So I can get filtered views or organization-wide perspectives that I might want, say as a CIO, like I have here. Where you can easily see the impacts at a glance, you’ll find satisfaction metrics, most active groups, and also the most active job functions, just to name a few things. Then you’ll find detailed breakdowns for cost and budget, how it’s trending and forecast for future consumption. Importantly, you’ll find the top cost drivers on the right. -For example, here you can see that GitHub Copilot is making up over 42% of the total running cost, and you can drill in to see exactly how that compares with other services. And it looks like Cowork is another service that is heavily used with more than 40% of the total running spend. And you can see how that is broken down by different model providers. Then moving over to combined view, this shows the intersection of advanced AI services together with the specific models that each are leveraging and how those accrue to spend. And in use case, that shows the details for different ways that AI services are being used across business activities. -Next, moving into users & groups, those are also important because not every single user is going to engage at the same level. Usage levels will be different for each person. And if there are any best practices to be learned from the top users, here you can even survey those users to see what’s working and then take those learnings to democratize them across your entire organization. -Beyond cost, the next area is understanding whether your money is being well spent. Now for that, you’ll need to understand the task and what’s being done with AI across the different business functions. So here in use cases, these views are a really great way to see how services are being used. And you saw how Cowork accounted for over 40% of our running spend. And this gives the details for how it’s being used, where you can see the number of sessions, even the cost of identified use cases along with the AI value of identified use cases. Now these are calculated based on the task work and timing that it would take a person to perform comparable work. And we’re using official sources, including the U.S. Department of Labor to make those calculations. -So as I scroll down, you can see specific tasks by domain, like this one for sales, then across related categories and subcategories, and even all the way down to these specific use cases. Now below that, you can see how each domain stacks up in terms of active users, session count, cost, and AI value experience for each. Those are all insights into how services are currently being used and the associated cost drivers. Now you also have tools to forecast and model spend for further optimization. -Under Cost & Forecast, you can see how cost is trending, the projected month-end cost, and also different drivers of increases, as well as decreases by job function, model and service. And here is where you can model changes in how you plan to use AI in the future. For example, setting a spending cap, or expanding access to services, or maybe even changing the model mix. And when you apply these factors, like I’m doing here to predict the impact of a shift to lower-cost models, you can see the forecasted results and how they compare with what you’re using now to optimize your ROI. And the good news is that you can implement these controls as a budget owner right from Agent 365 Business Analytics. -So here inside spending policies, I’ve just been granted access to add, edit, and delegate group and spending policies right from here. Now I’ll show you where I can set these roles up in a moment. And I can see spend also across different policies within this group. Again, these are hard limits when they’re reached. So I know, for example, that the engineering team, they’re having a lot of success streamlining their work using AI, but you can see they’ve reached their limit. And here I can edit the policy. Then I can go into limits and alerts, and increase the limit to unblock them. -From there I can review and save my changes. And now the engineering team can keep working with the tools they need. Now let’s switch gears to the IT admin perspective where you can see lots of the same shared usage reporting in the Microsoft 365 Admin Center and also set up budgets as spending policies and delegate the permissions that we just saw for budget management. As a first step for implementing advanced AI features in your organization, you’ll need to have usage-based billing enabled for your tenant, or you can use an Azure subscription with either pay-as-you-go or prepaid billing. -So I’ve done that here in advance to save a little time. Going back to our budgeting and targeted spend for specific groups in your company, you’ll set that up under cost management. In this case, I already have a spending group and a few policies in place. Now I’ll show you how to set up a new spending policy. You have options for both identity scoping based on users or groups, or a resource scoping, for example, for shared resources like an agent. I’ll choose the identity scope and give it a name. -Next, I can also choose specific services for this policy. And here is where monthly budget limits come in, where you can set up limits at the cumulative level for everyone scoped in this policy, and optionally, also set limits per user. These limits, again, are hard limits and services will be interrupted when they’re hit. -Now I have the option to set up alerts, first with who should be alerted. In my case, I’ll make these values equal to about 80% of those limits I set before. And these policies also let you control which models can be used with templates. Now I have a few templates already set up for different use cases and also model providers. So I’m going to choose all models. And this is where you could assign a specific policy to a specific business group, where each, for example, would have separate Azure subscriptions. In my case though, I’ll keep the prepaid plan that I have here. And now I just need to review and add the policy, and it’s all set. -So now let me show you how you’d assign permissions that I showed before for other people across your organization to be able to read, write, or delegate spending policies and groups. This policy group on top for the sales team has delegates already assigned. I’ll click in to see its details. And you can already see that Adele and Pradeep currently have the delegator and writer roles respectively. -Now, if I go ahead and edit the policy, I can add or edit delegates as individuals or as groups. Now this is what you’ll do for budget controllers that are working outside of the IT team because they typically won’t have Microsoft 365 Admin Center access. Instead, they’re going to be using the Agent 365 Business Analytics experience, like I showed earlier. And along with the delegator and writer roles with edit permissions, there’s also a view-only reader role available. -So that’s how permissions are granted. And for the other steps in this group, at the parent level, those follow the same things I showed before with the spending policy. So whether you’re an individual user, an IT admin, or a group leader, you’re in full control over your budget and spend across advanced AI services for Microsoft Copilot and Agent 365, along with visibility that you need to make sure that you’re hitting your goals and optimizing how you use AI. -Check out Agent 365 Business Analytics at aka.ms/A365Analytics. And if you’re in IT, activate usage-based billing and set up your policies at admin.microsoft.com. Be sure to keep watching Microsoft Mechanics for the latest tech updates, and thanks for watching.197Views0likes0Comments
Introducing Microsoft Agent 365 Business Analytics: Turn AI investment into business value
AI spend is growing fast, and it no longer sits only in IT. Leaders need more than a bill. They need to know what AI is delivering. Meet Agent 365 Business Analytics, rolling out today in Frontier: one place to see what's driving AI spend, connect it to real business value, and plan where to invest next. 5.8KViews1like0Comments
How does departmental chargeback work in cost management?
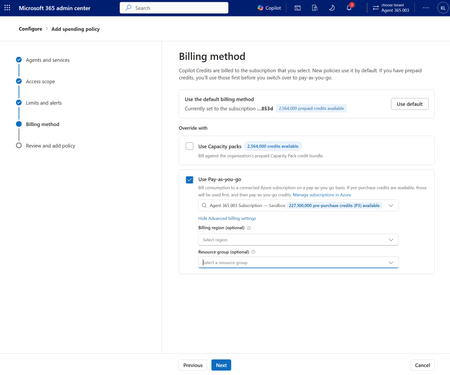
One of the most common questions we hear is "how can I charge back the cost of AI workloads to the business units responsible for their consumption?" As your organization scales and your AI usage becomes more distributed, departmental chargeback becomes increasingly important for maintaining clear cost ownership and financial accountability. It gives each business unit visibility into the costs it incurs, supports more accurate budgeting, and helps the organization manage growing AI spend without relying on a single centralized budget. In this post, we’ll cover: What is chargeback? How is chargeback built-in to Agent 365 cost management in Microsoft 365 admin center? How will custom chargeback scenarios be supported? What is chargeback? Chargeback is not a new concept. Organizations have long used it to assign shared technology costs to the business units responsible for their consumption. But it is becoming more important as AI shifts from fixed per-user licenses to usage-based billing. Chargeback brings that same discipline to AI by assigning costs to the business units responsible for their AI usage, rather than leaving them in one central budget. As your organization become more mature in its AI adoption, they increasingly want this level of accountability—so each business unit owns the cost of its AI usage and becomes responsible for the value it generates. For example, IT builds an AI agent that helps the Sales Development team research prospects, personalize outreach, and write follow-up messages. IT tracks how much the team uses the agent and charges those costs to the sales department each month, instead of covering them through a central IT budget. This helps sales understand what it is spending and compare that cost with results such as qualified opportunities and pipeline generated. How is chargeback built-in to cost management? Agent 365 cost management in the Microsoft 365 admin center gives IT admins a one-stop shop to manage usage-based billed AI services. It’s already included in your existing Microsoft cloud subscriptions (i.e., it does not require separate Agent 365 or ME7 licensing to manage your Microsoft services). As we shared in our previous FinOps for AI post, cost management brings together the visibility and controls you need to understand usage, manage spend, and make more informed decisions as AI adoption grows. Spending policies are at the center of the experience. They let admins decide who can use supported AI services, set enforced spending limits, and receive alerts as usage approaches those limits. This helps you give teams room to use AI while keeping variable costs within clear guardrails. Departmental chargeback in cost management is built into the experience, and it is structured on Azure subscriptions and resource groups. We designed it this way because many organizations already align on an Azure subscription to each department, giving that department a clear boundary for managing and tracking its own costs. If a separate subscription for every department does not fit your setup, each department can instead use its own resource group within a shared subscription. Either approach lets AI usage follow the same financial structure as the rest of your cloud spend, so costs are assigned to the right team and fit into existing reporting and finance processes. Because usage is tied to the right subscription or resource group from the start, you can avoid the manual work of calculating each department’s bill and charging them at the end of the month. This gives you a practical way to introduce chargeback without adding another layer of manual tracking or reconciliation. For more details on organizing along Azure subscriptions and resource groups, check out this link for more details: Resource organization design area overview - Cloud Adoption Framework | Microsoft Learn. Configuring this in cost management is simple. When selecting the billing method for the spending policy, you can select the Azure subscription and resource group that should receive the charges, along with the region where billing-related tenant and usage data will be stored. This connects the department’s AI usage to the right Azure billing structure from the start. Built-in departmental chargeback is available for spending policies billed via pay-as-you-go and pre-purchase plans. You can also view this spend directly in the Azure Portal. Open the subscription connected to the spending policy, go to cost analysis, and filter the meter category to Microsoft Copilot Studio. From there, add a tag filter for policyname or servicename—for example, Cowork—to narrow the view and understand spend trends over time. (Note: Although the meter category currently appears as Microsoft Copilot Studio, it reflects all Copilot Credits usage; we are working to update the name so it better represents the services covered.) How will custom chargeback scenarios be supported? Built-in departmental chargeback works well when your organization already uses Azure subscriptions or resource groups to separate costs. But not every chargeback model follows that structure. And some organizations have established FinOps, reporting, or finance processes that require data to flow into their own systems. The Microsoft 365 Copilot Cost Management APIs in Microsoft Graph are available through the Microsoft Graph beta endpoint, giving you a programmatic way to manage cost controls at scale. With these APIs, you can view credit balances at the user, service, and tenant levels; create, read, update, and delete spending policies; manage the groups each policy applies to; configure service settings; and set limits and alerts. For example, you could use a single POST request to create a spending policy for a pilot group with a clear monthly cap and a per-user limit. In the same request, you can choose the billing method and enable the services the policy should cover—such as Cowork and Work IQ—so the right users, budget guardrails, and service access are configured together. You can get started today by reviewing the documentation available on Microsoft Learn. POST https://graph.microsoft.com/beta/copilot/costManagement/spendingPolicies Content-Type: application/json { "@odata.type": "#microsoft.graph.selectedGroupsSpendingPolicy", "displayName": "Pilot teams monthly cap", "periodLimit": { "@odata.type": "#microsoft.graph.limitedCostManagementQuantity", "value": 10000, "unit": "copilotCredit" }, "perUserLimit": { "@odata.type": "#microsoft.graph.limitedCostManagementQuantity", "value": 500, "unit": "copilotCredit" }, "billingMethods": "prepaidCredits", "serviceSettings": [ { "serviceId": "cowork", "state": "enabled" }, { "serviceId": "workIQ", "state": "enabled" } ] }@ We are building on this foundation to give you more flexibility in your custom chargeback processes. To support that flexibility, we are developing a data pipeline for detailed AI cost and usage data that you can bring into your business intelligence tools, data lakes, or chargeback systems of choice. From there, you can apply your own allocation rules, combine AI spend with other technology costs, and support the reporting and financial processes that already work for your business. We plan to share more updates next month. As AI becomes a bigger part of how work gets done, you need a practical way to understand who is using it, manage what they spend, and connect that investment to business value. Whether you use built-in departmental chargeback or extend it with Microsoft Graph and custom reporting, you have a flexible foundation that can grow with your organization.1.1KViews1like0Comments
FinOps for AI Workloads on Azure: Tokens, PTU and Pay-As-You-Go
Originally published on Substack: https://gisli78.substack.com/p/finops-for-ai-workloads-on-azure Part 3 of my Azure AI landing zone series is about FinOps for AI workloads. Tokens are the AI bill most teams actually get, so the post covers: Picking the deployment type first: Global Standard, Data Zone, Batch and Flex (preview) Why quota isn't billing, and why max_tokens eats your TPM PTU vs pay-as-you-go, and when hourly PTU actually pays off Sizing PTU with Microsoft's formula, and how prompt caching helps Spillover: PTU for the baseline, pay-per-token for the peaks Showback per team with llm-token-limit and llm-emit-token-metric in API Management Cost Management: group by meter, tag your deployments, and remember budgets only alert Read the full article on Substack: https://gisli78.substack.com/p/finops-for-ai-workloads-on-azure Bicep sample: https://github.com/gislig/azure-ai-landing-zone/tree/main/examples/ai-finops89Views0likes0CommentsHow to keep agentic workloads orchestrated, fast, and affordable
Getting AI to production is only half the battle. Once agentic workloads are live, organizations face compounding challenges: token costs that grow non-linearly, latency that degrades user trust, Retrieval-Augmented Generation (RAG) pipelines that return noise instead of signal, and orchestration overhead that multiplies with every agent added to the mesh. This is where the real engineering begins. Wrap up your Path to production Tech Accelerator experience with a practical optimization playbook for agentic AI, from model selection and inference routing to prompt compression, RAG tuning, and caching strategies. Learn how to manage orchestration complexity across multi-agent systems while improving signal quality and response times. Explore FinOps practices for AI, including capacity planning, batch processing, and intelligent model routing. Walk away with actionable techniques to reduce inference costs, cut latency, and scale reliably across regions. How do I participate? Select Add to Calendar to save the date, then click the Attend button to save your spot, receive event reminders, and participate in the Q&A. Not able to attend live? This session will be recorded and available on demand shortly after airing. Just announced! Live Q&A will also be available July 29 from 10:00-11:00 AM SGT (UTC+8) to support attendees in Asia and western Australia. Don't see Attend or Add to Calendar? Sign in to the Tech Community to join the conversation. Organizational policies preventing you from signing in to the Tech Community? Use a personal account or tune in on LinkedIn. This session is part of Path to production for agents: a Microsoft Azure AI Tech Accelerator. View the full agenda for more actionable strategies to help you deliver secure, compliant, and high-performing AI solutions across your organization.1.1KViews0likes4CommentsDetectando Anomalias de Custo no Azure com FinOps Hub + SRE Agent
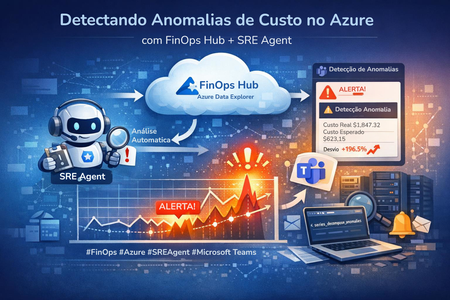
Introdução Um dos maiores desafios em ambientes cloud é manter a visibilidade sobre os custos. Picos inesperados podem passar despercebidos por dias e quando chegam na fatura, já é tarde demais. Neste artigo, vou mostrar como configurei uma análise automática diária de anomalias de custo usando o Azure SRE Agent, conectado ao FinOps Hub (Azure Data Explorer), com notificação automática no Microsoft Teams quando algo fora do padrão é detectado. 🏗️ Arquitetura da Solução FinOps Hub (ADX) → SRE Agent (Scheduled Task) → KQL Anomaly Detection ↓ anomalia detectada? SIM → Adaptive Card → Teams Channel NÃO → Log: 'custos dentro do esperado' Pré-requisitos Requisito Detalhe ✅ FinOps Hub implantado Com dados de custo sendo ingeridos no Azure Data Explorer ✅ Azure SRE Agent configurado Com acesso à subscription onde o FinOps Hub está ✅ Canal no Microsoft Teams Onde as notificações serão postadas ✅ Permissões adequadas Managed Identity com Viewer no database Hub do ADX Passo a Passo ① Identificar o Cluster ADX do FinOps Hub O primeiro passo é localizar o cluster Azure Data Explorer onde o FinOps Hub armazena os dados de custo. No Azure SRE Agent, usamos o Azure Resource Graph: az graph query -q "Resources | where type =~ 'Microsoft.Kusto/clusters'" --first 10 --subscription <subscription-id> No meu caso como exemplo, o cluster retornado foi: Propriedade Valor Nome finopshubadx URI https://finopshubadx.northcentralus.kusto.windows.net Database Hub SKU Dev(No SLA)_Standard_D11_v2 Região North Central US ② Configurar Permissões (RBAC no ADX) A managed identity do SRE Agent precisa de acesso Viewer ao database Hub do ADX. Sem isso, a query KQL falhará com erro 403. Opção A — Azure CLI: az kusto database-principal-assignment create \ --cluster-name finopshubadx \ --database-name Hub \ --resource-group <resource-group> \ --subscription <subscription-id> \ --principal-assignment-name "sre-agent-viewer" \ --principal-id "<managed-identity-client-id>" \ --principal-type App --role Viewer Opção B — Portal: ADX → Cluster → Database Hub → Permissions → Add → Viewer → Selecionar managed identity Opção C — KQL (ADX Web UI): .add database Hub viewers ('aadapp=<client-id>') 'SRE Agent' ③ A Query KQL de Detecção de Anomalias Esta query utiliza series_decompose_anomalies do Kusto para detectar padrões anômalos nos custos diários ao longo dos últimos 12 meses: let numberOfMonths = 12; let start = startofmonth(ago(numberOfMonths * 30d)); let end = now(); let interval = 1d; Costs() | where ChargePeriodStart between (start .. end) | summarize DailyCost = sum(EffectiveCost) by bin(ChargePeriodStart, interval) | make-series CostSeries = sum(DailyCost) on ChargePeriodStart from start to end step interval | extend anomalies = series_decompose_anomalies(CostSeries) | project ChargePeriodStart, CostSeries, anomalies 💡 Como a query funciona Costs() → Função do FinOps Hub que retorna dados de custo consolidados make-series → Cria série temporal diária contínua (sem gaps) series_decompose_anomalies → Algoritmo ML nativo do Kusto que detecta spikes e drops usando decomposição sazonal + STL Score > 0 → custo acima do esperado | Score < 0 → abaixo do esperado Quanto maior o |score|, mais significativa a anomalia ④ Configurar Webhook no Microsoft Teams Para receber notificações no Teams, criamos um Incoming Webhook via Power Automate Workflows (método recomendado pela Microsoft): No canal do Teams, clique nos 3 pontos (...) → Workflows Pesquise "Post to a channel when a webhook request is received" Selecione o Team e Channel desejados → Add workflow Copie a URL gerada (formato: https://prod-xx...logic.azure.com/...) Ative o workflow no Power Automate (My flows → Turn on) ⚠️ Atenção: O workflow pode ser criado com status 'Suspended'. Ative em: Power Automate → My flows → Turn on. ⑤ Criar a Scheduled Task no SRE Agent Agora a parte principal: criar a tarefa agendada (Scheduled Task) no Azure SRE Agent. Basta pedir em linguagem natural: "Crie uma tarefa diária para analisar anomalias de custo no FinOps Hub e me notificar pelo Teams quando houver anomalias detectadas." O SRE Agent criará a task com os seguintes parâmetros: Parâmetro Valor Nome Daily FinOps Cost Anomaly Analysis Schedule 0 8 * * * (diariamente às 08:00 UTC) ADX Cluster https://finopshubadx.northcentralus.kusto.windows.net Database Hub Query KQL com series_decompose_anomalies (12 meses) Notificação Adaptive Card no Teams via webhook Escalação HIGH se anomalias por 3+ dias consecutivos Idempotência Sem anomalia = 'custos dentro do esperado' Task details: Obs: Modificar os campos na task para adequar seu ambiente Autonomous Scheduled Run - Daily FinOps Cost Anomaly Analysis ## Scope - Subscription: xxxxxxx-xxxxxxx-xxxxxx-xxxx-xxxxx - ADX Cluster: https://finopshub.northcentralus.kusto.windows.net - Database: Hub - Resource Group: finopshub-rg ## Goal Detect cost anomalies in Azure spending using the FinOps Hub data. Run the KQL query against the ADX cluster, analyze results, and notify via Teams if anomalies are found. ## Step 1: Execute KQL Query Use the KustoQuery subagent to run this query against the ADX cluster (https://finopshubadx.northcentralus.kusto.windows.net, database: Hub): ```kql let numberOfMonths = 12; let start = startofmonth(ago(numberOfMonths * 30d)); let end = now(); let interval = 1d; Costs() | where ChargePeriodStart between (start .. end) | summarize DailyCost = sum(EffectiveCost) by bin(ChargePeriodStart, interval) | make-series CostSeries = sum(DailyCost) on ChargePeriodStart from start to end step interval | extend anomalies = series_decompose_anomalies(CostSeries) | project ChargePeriodStart, CostSeries, anomalies ``` ## Step 2: Analyze Results - Parse the anomalies array from series_decompose_anomalies output - Identify days where anomaly score is significantly positive (cost spike) or negative (unusual drop) - For each anomaly found, calculate: the date, actual cost value, expected baseline, and percentage deviation - Focus on the last 7 days of data for actionable anomalies, but use the full 12-month history for context ## Step 3: Generate Report Create a summary with: - Total anomalies detected in the last 7 days - For each anomaly: date, cost value, deviation from expected, severity (high/medium/low) - Trend analysis: whether costs are trending up, down, or stable - Top recommendations (e.g., investigate specific resource groups, check for new deployments, review reserved instances) ## Step 4: Teams Notification (ONLY if anomalies detected in last 7 days) If anomalies are found, send a notification to Microsoft Teams using the executing_code skill (ExecutePythonCode) to POST to this webhook URL: https://839eace659ab424397eca5b8fcc104.e4.environment.api.powerplatform.com:443/powerautomate/automations/direct/workflows/88ec6b6c43014d8f8cb13999714dddd8/triggers/manual/paths/invoke?api-version=1&sp=%2Ftriggers%2Fmanual%2Frun&sv=1.0&sig=br2rNi4x1zKjWp6CgKWcajvEUW_7EUBkHrkbnp6Hk2g Use Adaptive Card format for the Teams message with: - Title: "⚠️ Azure Cost Anomaly Detected" - Summary of anomalies (dates, values, deviations) - Severity indicator - Link back to this SRE Agent thread for details Python code example for the webhook POST: ```python import urllib.request import json webhook_url = "<colar-url-webhook-aqui>" card = { "type": "message", "attachments": [{ "contentType": "application/vnd.microsoft.card.adaptive", "content": { "$schema": "http://adaptivecards.io/schemas/adaptive-card.json", "type": "AdaptiveCard", "version": "1.4", "body": [ {"type": "TextBlock", "text": "⚠️ Azure Cost Anomaly Detected", "weight": "Bolder", "size": "Large"}, {"type": "TextBlock", "text": "<ANOMALY_SUMMARY_HERE>", "wrap": True}, {"type": "FactSet", "facts": [ {"title": "Date", "value": "<DATE>"}, {"title": "Actual Cost", "value": "<COST>"}, {"title": "Expected", "value": "<EXPECTED>"}, {"title": "Deviation", "value": "<DEVIATION>%"}, {"title": "Severity", "value": "<SEVERITY>"} ]} ], "actions": [{"type": "Action.OpenUrl", "title": "View in SRE Agent", "url": "https://sre.azure.com/agents/subscriptions/<sua-subscricao>/resourceGroups/finopshub-rg/providers/Microsoft.App/agents/finopshub/views/thread/7314d219-77d6-4e12-a3fb-f30606d13077"}] } }] } req = urllib.request.Request(webhook_url, data=json.dumps(card).encode('utf-8'), headers={'Content-Type': 'application/json'}, method='POST') response = urllib.request.urlopen(req) ``` ## Step 5: Report in Thread Always post a summary in this thread with: - Whether anomalies were found or not - Key metrics and trends - If no anomalies: "No material cost anomalies detected. Daily costs within expected range." ## Constraints - Read-only operations only against ADX - Max 5 KQL queries per execution - Do not modify any Azure resources ## Idempotence If no anomalies detected in the last 7 days and costs are within normal thresholds, output: "No material cost anomalies detected. Daily costs within expected range." ## Escalation If anomalies are detected for 3+ consecutive days, flag as HIGH severity in the Teams notification and recommend immediate investigation. ⑥ Notificação no Teams (Adaptive Card) Quando anomalias são detectadas, o SRE Agent envia um Adaptive Card rico para o Teams: ⚠️ AZURE COST ANOMALY DETECTED 🔴 HIGH — 2026-04-21 Custo Real $1,847.32 Custo Esperado $623.15 Desvio +196.5% (↑ $1,224.17) Score Anomalia 4.7 (threshold: 1.5) 🟡 MEDIUM — 2026-04-20 Custo Real $987.44 Desvio +59.5% (↑ $368.54) 📊 Trend (7d) $601 → $615 → $622 → $619 → $987 → $1,847 Exemplo de Adaptive Card enviado ao canal do Teams O card inclui botões: Ver Detalhes no SRE Agent e Abrir FinOps Hub (ADX) para investigação. ⑦ Testar a Integração (Simular Anomalia) Antes de confiar no agendamento, teste pedindo ao SRE Agent: "Simular uma anomalia de custo para eu receber no Teams" O agente enviará um Adaptive Card de teste com dados simulados para validar que o webhook está funcionando. Dica: Se o webhook retornar erro 400 - WorkflowTriggerIsNotEnabled, ative o flow em: Power Automate → My flows → Turn on. Como Funciona no Dia a Dia Horário Ação Resultado 08:00 UTC SRE Agent executa query KQL no ADX Dados de custo (12 meses) 08:01 UTC Análise de anomalias (últimos 7 dias) Identifica spikes e drops 08:02 UTC Se anomalia → Teams notification Adaptive Card no canal 08:02 UTC Se normal → log no thread "Custos dentro do esperado" Contínuo 3+ dias anomalia → escalação HIGH Investigação recomendada Gerenciamento da Task Após criada, a tarefa pode ser gerenciada pelo SRE Agent: Pausar: "Pausar a tarefa de anomalia de custo" Retomar: "Retomar a tarefa" Alterar horário: "Mudar para executar às 10h UTC" Ver histórico: "Mostrar histórico de execuções" Cancelar: "Cancelar a tarefa de anomalia" Conclusão Com essa configuração, você tem um sistema inteligente de vigilância de custos que: 🔍 Analisa 12 meses de histórico para detectar padrões sazonais 🤖 Usa ML nativo do Kusto — sem infraestrutura adicional 📱 Notifica proativamente no Teams — só quando há anomalia 📈 Escala automaticamente a severidade em anomalias persistentes 💬 Mantém histórico completo no thread do SRE Agent 🔧 É gerenciável por linguagem natural — sem YAML, sem pipelines A combinação FinOps Hub + Azure SRE Agent + Teams transforma a governança de custos de reativa (olhar dashboards) em proativa e automatizada. 🚀 Quer implementar na sua organização? Se você quer testar, o Azure SRE Agent está disponível como preview. Configure um agente na sua subscription e comece a conversar em linguagem natural. Já usa FinOps Hub? Conte nos comentários como você monitora anomalias de custo hoje! #FinOps #Azure #SREAgent #CostManagement #AzureDataExplorer #CloudGovernance #DevOps #MicrosoftTeams #AIOps359Views1like0CommentsFinOps Hub Privado: Implementação Manual em Ambientes Corporativos
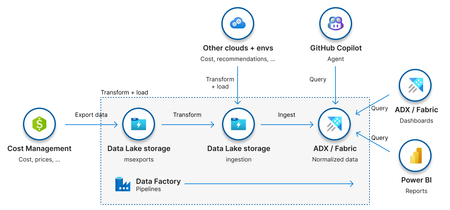
O que é o FinOps Hub? O FinOps Hub é uma solução open source da Microsoft, parte do FinOps Toolkit, que fornece uma base escalável e extensível para análise, governança e otimização de custos em nuvem. A solução centraliza dados de custos por meio de recursos de armazenamento e pipelines de dados, permitindo que as organizações padronizem a forma como analisam seus gastos na nuvem, adotando o modelo de dados FOCUS definido pela FinOps Foundation. Além de disponibilizar relatórios e dashboards prontos, o FinOps Hub expõe os dados de custos de forma estruturada por meio do Azure Data Explorer ou do Microsoft Fabric, possibilitando a criação de relatórios customizados no Power BI e o desenvolvimento de soluções internas sob medida, de acordo com as necessidades do negócio. Objetivo Esse artigo visa orientar a implementação manual do acesso privado ao FinOps Hub após uma implementação pública, sem usar diretamente a opção de implementação privada oferecida pelo template. Por que implementar o FinOps Hub com acesso privado de forma manual? O template disponibilizado para a implementação do FinOps Hub permite que selecionemos duas formas de implementação: Pública: forma de implementação mais simples e comum. Os recursos são provisionados com acesso público habilitado, sendo acessados por meio de seus endpoints públicos padrões do Azure. O controle de acesso é feito exclusivamente via permissões RBAC. Privada: forma de implementação mais segura. Os recursos são provisionados com acesso público desabilitado e expostos apenas por meio de private endpoints, ficando acessíveis somente através de redes privadas que possuem conectividade com a rede onde esses endpoints estão implementados. Embora a comunicação privada traga ganhos significativos de segurança, sua habilitação através do template do FinOps Hub introduz algumas implicações importantes no processo de implantação. O template, de forma automática, tenta: Criar uma rede virtual (/26); Provisionar Private DNS Zones; Criar os registros DNS associados aos private endpoints; Configurar os links entre as VNets e as zonas DNS. Em muitas organizações, esse tipo de configuração é restrito por políticas internas. A criação de redes, zonas DNS e seus respectivos vínculos costuma ser responsabilidade de times especializados, que garantem a padronização e a aderência às diretrizes arquiteturais definidas pela empresa. Em cenários onde a organização adota, por exemplo, uma topologia Hub & Spoke, com landing zones bem definidas para workloads e conectividade, é fundamental considerar alguns pontos adicionais: Garantir que a rede criada para os private endpoints não tenha sobreposição (overlap) com outras redes existentes; Assegurar que exista peering com a VNet de hub; Integrar os registros DNS dos novos private endpoints às Private DNS Zones centralizadas; Configurar corretamente os VNet links; Garantir que a resolução de nomes esteja funcional no ambiente on-premises, permitindo o acesso ao FinOps Hub por meio de VPN, ExpressRoute ou outras formas de conectividade híbrida. Esses fatores explicam por que, em muitos casos, o uso do template com configuração privada se torna inviável quando utilizado de forma isolada. Isso ocorre porque, frequentemente, o time de FinOps não é o mesmo time responsável por redes e DNS, possuindo permissão para implantar apenas parte dos recursos necessários. Nesses cenários, a implementação privada exige a orquestração entre diferentes times, cada um atuando dentro de suas responsabilidades. Como resultado, algumas etapas que o template tenta executar automaticamente precisam ser realizadas manualmente, conforme descrito nas próximas seções. Passo a Passo para Implementação Faça a implementação do template seguindo o tutorial documentado, com “Networking” em modo público. Assim que o template é implementado, alguns scripts de configuração são executados. Aguarde até que esses scripts sejam executados, ou seja, desapareçam do grupo de recursos onde o FinOps Hub foi implementado para seguir com os próximos passos. Exemplos dos “Deployment Scripts” que desaparecerão: Crie uma rede de tamanho mínimo /26 – valide com o time de infraestrutura o espaçamento que pode ser utilizado. Dentro dessa rede implemente uma subrede: private-endpoint-subnet (/28) – subrede para os private endpoints. Garanta a existência das Private DNS Zones: se seu ambiente possui zonas de DNS privadas centralizadas pré-configuradas. Garanta que as seguintes zonas já existam na subscription padrão para os seus recursos de rede: privatelink.blob.core.windows.net– para o Data Explorer e storage privatelink.dfs.core.windows.net– para o Data Explorer and o data lake hospedando os dados de FinOps data e configuração das pipelines privatelink.table.core.windows.net– para Data Explorer privatelink.queue.core.windows.net– para o Data Explorer privatelink.{location}.kusto.windows.net– para Data Explorer Configurando a Storage Account com Acesso Privado O primeiro recurso que a ser configurado será a Storage Account. A configuração a seguir deve ser realizada duas vezes uma para o target sub-resource “blob” e outra para o target sub-resource “dfs”. Acesse “Networking” e a aba “Private Endpoints” Na aba “Basics” defina: Subscription: mesma que o FinOps Hub foi implementado Resource Group: mesmo que o FinOps Hub foi implementado Name: use um nome que remeta ao recurso criado (private endpoint) e o sub recurso que ele fará exposição (blob/dfs). Exemplo: pe-storageaccount-blob/ pe-storageaccount-dfs Na aba “Resource” defina o target sub-resource para o qual a configuração está sendo feita. No caso, primeiro foi feito para “blob” e depois “dfs”. Na aba “Virtual Network”, deve-se selecionar a rede criada para os private endpoints bem como a subrede (private-endpoint-subnet). Na aba “DNS” selecione a private DNS zone na qual são realizados os registros do seus private endpoints. Quando estiver configurando o private endpoint para blob será privatelink.blob.core.windows.net e para dfs privatelink.dfs.core.windows.net. Adicione Tags caso seja necessário. Clique em “Review + create”. Ao final, dois private endpoints devem estar criados para a storage account: Agora será necessário configurar o private endpoint usado pelo Data Factory para acessar a Storage Account. Acesse o Data Factory e clique em "Launch Studio". No menu lateral, selecione a opção "Manage" -> "Linked services": Selecione o serviço correspondente ao Azure Data Lake Storage Gen2. Em “Connect via integration runtime” substitua “AutoResolveIntegrationRuntime” por New+: Em “Integration runtime setup” selecione “Azure” -> Botão “Continue”: Na aba “Settings”, apenas altere o campo “Name”. Use algo como “ManagedIntegrationRuntime”. Os demais campos, mantenha como estão: Na aba “Virtual Network”, configure conforme a imagem abaixo: Por fim, na aba “Data flow runtime”, use as configurações abaixo: Clique em “Create”. Agora, voltando a página “Edit linked Service”, adicione o “Managed Private Endpoint”. Ele ficará em estado “Pending”. Clique em “Save”. Além disso, use a managed identity fornecida na página “Edit linked Service”, e lhe dê os seguintes acessos na storage account: Reader Storage Account Contributor Storage Blob Data Contributor Por fim, acesse a seção “Networking” da Storage Account novamente, selecione o private endpoint criado pelo Data Factory e clique no botão “Approve”. Configurando o Linked Service ftkRepo no Data Factory Voltando na seção “Manage” do Azure Data Factory, será necessário editar o serviço “ftkRepo”. Nele, o único campo a ser alterado é o “Connect via integration runtime” usando o “ManagedIntegrationRuntime” criado na etapa de configuração da storage account. Clique em “Save”. Configurando o Azure Data Explorer com Acesso Privado Acesse a seção “Networking” cluster do Data Explorer criado pelo script do FinOps Hub e acesse a aba “Private Endpoint Connections” Clique em “+ Private Endpoint”. Em “Basics” inclua um nome para o private endpoint e garanta que a região selecionada é a de implementação do seu FinOps Hub e da vnet criada para ele. Na aba “Virtual Network” selecione a rede e subrede criadas para os private endpoints. Na aba “DNS”, associar cada configuração a sua private DNS zone correspondente. Se essas zonas já existirem no ambiente e forem utilizadas de forma centralizada, usar as existentes. Caso contrário, a configuração poderá criar private DNS zones novas: Novamente será preciso configurar o private endpoint gerenciado pelo Data Factory. Para isso, acesse “Managed” -> “Linked Services” e selecione o serviço referente ao Azure Data Explorer. Nessa seção, o único campo a ser editado é o “Connect via integration runtime” usando o “ManagedIntegrationRuntime” criado na etapa de configuração da storage account. Agora ainda em “Manage” no Data Factory, selecione a opção “Managed Private Endpoints”. Clique em “+New” -> “Azure Data Explorer (Kusto)” Forneça um nome para o private endpoint, marque a subscription na qual o Data Explorer foi implementado e em "Cluster" selecione o recurso implementado via template do FinOps Hub: Ao final, deve-se ter dois private endpoints configurados no Azure Data Explorer: Ajustes Finais e Validações de Conectividade Tanto para a Storage Account quanto para o Data Explorer, acesse as configurações de rede e altere o Public network access para “Disabled”. Por fim, no seu servidor local de DNS, crie o registro para o Data Explorer apontando para o forwarder correto no Azure seja ele uma máquina virtual ou o inbound endpoint do Azure Private Resolver. Não use o domínio com privatelink, mas sim o padrão, no caso do Data Explorer a forma geral é <localização>.kusto.windows.net conforme o exemplo abaixo: Ao configurar os apontamentos corretamente, será possível configurar os dashboards em máquinas locais/on-premises que tenham acesso privado ao ambiente Azure. Os dashboards precisam ser capazes de resolver a URL do cluster Data Explorer que é apontado como parâmetro do Dashboard em PowerBI. Se desejar validar a comunicação antes de configurar o dashboard de Power BI, teste da sua máquina local a resolução da URI do Data Explorer implementado para o FinOps Hub, usando nslookup conforme o exemplo abaixo.558Views5likes0Comments
Office hours: FinOps and the Microsoft marketplace
Want to unlock a faster time-to-value for your cloud and AI projects? Join us live, July 30, with your questions! Learn how the Microsoft marketplace can support your FinOps practitioners by sourcing thousands of pre-vetted solutions that accelerate AI transformation while better managing technology spend.1.1KViews1like3Comments
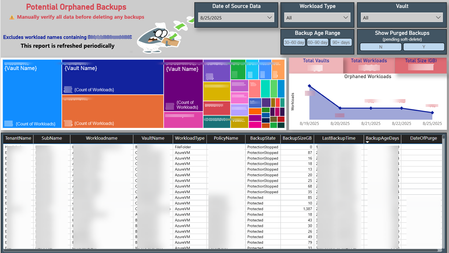
Mine your Azure backup data, it could save you 💰💡
Your data has a story to tell. Mine it, decipher it, and turn it into actionable outcomes. 📊🔍 Azure backups can become orphaned in several ways (I'll dive into that in a future post). But here’s a key point: orphaned doesn’t always mean useless, hence the word “Potential” in the title of my Power BI report. Each workload needs to be assessed individually. If a backup is no longer needed, you might be paying for it - unnecessarily and unknowingly. 🕵️♂️💸 To uncover these hidden costs, I combined data from the Azure Business Continuity Center with a PowerShell script I wrote to extract LastBackupTime and other metadata. This forms the foundation of my report, helping visualize and track backup usage over time. This approach helped me identify forgotten one-time backups, VMs deleted without stopping the backup, workloads excluded due to policy changes, and backups left behind after resource migrations. If you delete unneeded backups and have soft-delete enabled, the backup size drops to zero and Azure stops charging for it. ✅🧹 💡 Do your Azure backups have their own untold story to tell? 📸 Here's a snapshot of my report that helped me uncover these insights 👇270Views0likes0Comments