extended events
7 TopicsLesson Learned #492: Improving Extended Events in Azure SQL
In the last months, our Product Team has been working to enhance Extended Events for Azure SQL as you could see in their blog: Improving Extended Events in Azure SQL - Microsoft Community Hub. These updates simplify monitoring and troubleshooting Azure SQL databases, offering a more SQL Server-like experience and enabling more granular control over events and sessions.2.2KViews2likes0CommentsLesson Learned #400:Reigniting a Dormant Extended Event in Azure SQL Database with PowerShell
Extended events provide essential insights in Azure SQL Database, enabling efficient monitoring and troubleshooting. However, when an extended event becomes stops unexpectedly, it can hinder our ability to diagnose issues effectively. In this article, we will explore the process of re-starting an extended event using a PowerShell script designed specifically for Azure SQL Database.1.6KViews0likes0CommentsLesson Learned #525: Tracking Command Timeouts in Azure SQL: Beyond Query Store with Extended Events
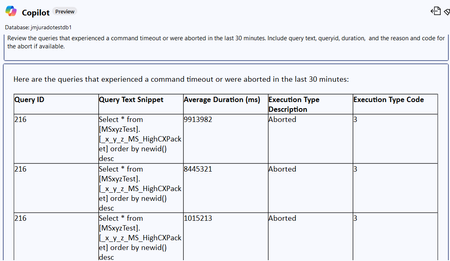
A few days ago, we were working on a support case where our customer was intermittently experiencing command timeouts. What made the case interesting was that queries which usually completed in under one second suddenly started taking more than 10 seconds to execute. Since the application — developed in Python using the ODBC Driver 18 for SQL Server — had a command timeout set to 5 seconds, the following error was triggered every time the threshold was exceeded: Error executing command, retrying in 5 seconds. Attempt 1 of 3 with new timeout 5. Error: ('HYT00', '[HYT00] [Microsoft][ODBC Driver 18 for SQL Server]Query timeout expired (0) (SQLExecDirectW)') The application had built-in retry logic, dynamically increasing the timeout in each of the three retry attempts, to allow time for the query to complete and to log enough data for post-error analysis. Example logs from the retry logic: (RunCommandTimeout) - Thread: 39808 - Error executing command, retrying in 5 seconds. Attempt 1 of 3 with new timeout 5. Error: ('HYT00', '[HYT00] [Microsoft][ODBC Driver 18 for SQL Server]Query timeout expired (0) (SQLExecDirectW)') INFO:root:Connecting to the DB jmjuradotestdb1 - Thread id 39808 - (Attempt 1/3) INFO:root:Connected to the Database in jmjuradotestdb1 - Thread id 39808 - 0.0445 seconds --- (RunCommandTimeout) - Thread: 39808 - Error executing command, retrying in 9 seconds. Attempt 2 of 3 with new timeout 9. Error: ('HYT00', '[HYT00] [Microsoft][ODBC Driver 18 for SQL Server]Query timeout expired (0) (SQLExecDirectW)') INFO:root:Connecting to the DB jmjuradotestdb1 - Thread id 39808 - (Attempt 1/3) INFO:root:Connected to the Database in jmjuradotestdb1 - Thread id 39808 - 0.0532 seconds --- (RunCommandTimeout) - Thread: 39808 - Error executing command, retrying in 13 seconds. Attempt 3 of 3 with new timeout 13. Error: ('HYT00', '[HYT00] [Microsoft][ODBC Driver 18 for SQL Server]Query timeout expired (0) (SQLExecDirectW)') (RunCommandTimeout) - Thread: 39808 - Loop:2/5 Execution Time: 9.7537 seconds My first prompt using SSMS Copilot was this "Review the queries that experienced a command timeout or were aborted in the last 30 minutes. Include query text, queryid, duration, and the reason and code for the abort if available." and I got the following results. So, all points that the query 216 got command timeouts. My next question, was, for query ID 216, show the number of total executions reporting that is 28 executions. The response showed 28 executions, but this number didn’t match the number of aborted and non-aborted executions observed in the application logs, why this difference? Checking the table sys.query_store_runtime_stats I found 10 rows all having execution_type = 3, and total executions 28. So, that's mean that Query Store aggregates query execution data over a fixed interval. So, the execution_type is an indicator that at least an execution during this runtime interval was aborted. So, at least several of them were aborted and other not. To obtain a more granular and accurate picture, I created an Extended Events session to capture these events using ring_buffer target. CREATE EVENT SESSION [CommandAborted] ON DATABASE ADD EVENT sqlserver.attention( ACTION ( sqlserver.client_app_name, sqlserver.client_hostname, sqlserver.username, sqlserver.database_name, sqlserver.sql_text ) ) ADD TARGET package0.ring_buffer WITH (MAX_MEMORY = 4096KB, EVENT_RETENTION_MODE = ALLOW_SINGLE_EVENT_LOSS); GO ALTER EVENT SESSION [CommandAborted] ON DATABASE STATE = START; after reproducing the command timeout scenario again, I was able to see only the aborted executions. So, in this case, 28 executions were executed and 7 executions were aborted. WITH RingBufferXML AS ( SELECT CAST(t.target_data AS XML) AS target_data FROM sys.dm_xe_database_session_targets t JOIN sys.dm_xe_database_sessions s ON t.event_session_address = s.address WHERE t.target_name = 'ring_buffer' AND s.name = 'CommandAborted' ) SELECT x.value('@name', 'varchar(50)') AS event_name, x.value('@timestamp', 'datetime2') AS event_time, x.value('(action[@name="client_app_name"]/value)[1]', 'nvarchar(256)') AS client_app_name, x.value('(action[@name="sql_text"]/value)[1]', 'nvarchar(max)') AS sql_text, x.value('(data[@name="duration"]/value)[1]', 'bigint') AS duration_microseconds, CAST(x.value('(data[@name="duration"]/value)[1]', 'bigint') / 1000000.0 AS decimal(10,3)) AS duration_seconds FROM RingBufferXML CROSS APPLY target_data.nodes('//event') AS tab(x) WHERE x.value('@name', 'varchar(50)') = 'attention' and x.value('(action[@name="client_app_name"]/value)[1]', 'nvarchar(256)') = 'TEST-DataCon' ORDER BY event_time DESC;400Views0likes0CommentsEnable auditing to identify Change Tracking history table drops using Extended Events (Azure SQL Db)
When Change Tracking is enabled, the system-maintained history table dbo.MSChange_tracking_history is a key place to look for cleanup progress and errors. For example, Microsoft’s troubleshooting guidance for Change Tracking auto-cleanup explicitly references querying the history table to validate whether cleanup is running and whether there are cleanup errors. In real-world environments, teams sometimes observe that dbo.MSChange_tracking_history “disappears” unexpectedly (for example, during cleanup troubleshooting), which then blocks visibility into cleanup progress and error history. When that happens, the most practical way to answer “who/what dropped the history table?” is to audit the DDL using Extended Events (XEvents)—a lightweight monitoring capability designed for troubleshooting. This post shows how to create a database-scoped XEvent session in Azure SQL Database that captures Change Tracking history table drops and related events, using the script you provided. Why Extended Events for this scenario? Extended Events are built to capture internal engine activities with relatively low overhead, and are supported across SQL Server and Azure SQL. In Azure SQL Database, XEvents are commonly used for investigation and troubleshooting when you need evidence of what happened and who initiated it. In this specific case, we want to capture: A history table drop event (Change Tracking-specific) A syscommittab truncate event (Change Tracking-specific) A generic object deletion event filtered to the history table name And we want to enrich each event with context (app, host, user, SQL text, stack, timestamps, etc.). The Extended Events session (copy/paste) Below is your script to create a database-scoped session named CTXEvent that audits the Change Tracking history table drop and related events: CREATE EVENT SESSION [CTXEvent] ON DATABASE ADD EVENT sqlserver.change_tracking_historytable_drop( ACTION(mdmtargetpkg.mdmget_TimeStampUTC,sqlserver.client_app_name,sqlserver.client_hostname,sqlserver.context_info,sqlserver.database_name,sqlserver.external_script_request_id,sqlserver.session_id,sqlserver.sql_text,sqlserver.transaction_id,sqlserver.tsql_stack,sqlserver.username)), ADD EVENT sqlserver.change_tracking_syscommittab_truncate( ACTION(mdmtargetpkg.mdmget_TimeStampUTC,sqlserver.client_app_name,sqlserver.client_hostname,sqlserver.context_info,sqlserver.database_name,sqlserver.external_script_request_id,sqlserver.session_id,sqlserver.sql_text,sqlserver.transaction_id,sqlserver.tsql_stack,sqlserver.username)), ADD EVENT sqlserver.object_deleted( ACTION(mdmtargetpkg.mdmget_TimeStampUTC,sqlserver.client_app_name,sqlserver.client_hostname,sqlserver.context_info,sqlserver.database_name,sqlserver.external_script_request_id,sqlserver.session_id,sqlserver.sql_text,sqlserver.transaction_id,sqlserver.tsql_stack,sqlserver.username) WHERE ([object_name]=N'MSchange_tracking_history')) WITH (MAX_MEMORY=16384 KB,EVENT_RETENTION_MODE=NO_EVENT_LOSS,MAX_DISPATCH_LATENCY=10 SECONDS,MAX_EVENT_SIZE=0 KB,MEMORY_PARTITION_MODE=NONE,TRACK_CAUSALITY=ON,STARTUP_STATE=OFF) GO Why these three events? sqlserver.change_tracking_historytable_drop: directly captures the Change Tracking “history table dropped” operation (purpose-built for this investigation). sqlserver.change_tracking_syscommittab_truncate: captures maintenance actions on syscommittab, which is central to Change Tracking’s internal state. sqlserver.object_deleted with a predicate on MSchange_tracking_history: provides a generic “safety net” if the drop manifests via generic DDL deletion paths. Why these actions? The actions you selected are the practical “who/what/where” context you usually need to attribute the operation: sqlserver.client_app_name / sqlserver.client_hostname: which app + which machine initiated the DDL sqlserver.username: identity executing the statement sqlserver.sql_text + sqlserver.tsql_stack: the statement and call stack (helpful if the drop occurs via a job, framework, or tooling) sqlserver.session_id / sqlserver.transaction_id: correlate activity across events TRACK_CAUSALITY=ON: enables correlation across related events within the session context. Starting and stopping the session Your session is created with STARTUP_STATE=OFF, meaning it does not start automatically. That’s typically a good practice for targeted investigations: enable it only during the window where you expect the issue. For Azure SQL Database, you can manage the session using SSMS or equivalent T-SQL workflows. Microsoft’s Extended Events QuickStart walks through creating sessions and working with session data, including the general workflow concepts. Tip (practical): Turn it on shortly before your expected “drop window,” reproduce/observe, then turn it off after you capture the event to minimize overhead. Where does the data go? Your script defines the events + actions + session options, but it does not define a target (for example, event_file). That’s OK for short, in-the-moment investigations, but for durable evidence and easy sharing, many teams prefer writing to an event file target. Option: Persist captured events to Azure Storage (recommended for multi-hour investigations) Microsoft provides a dedicated walkthrough for Azure SQL Database to create an event session with an event_file target stored in Azure Storage, including: creating a storage account + container granting access (RBAC or SAS) creating a database credential creating/starting the session viewing the event data If you choose this route, you can then read event files using sys.fn_xe_file_target_read_file (supported in Azure SQL Database, commonly used to consume XEL files from blob storage). How to interpret the results (what to look for) When the table drop happens, the captured event payload should allow you to confidently answer: Who initiated the operation? Look at sqlserver.username plus client_app_name and client_hostname. What executed the drop? Look at sql_text and tsql_stack. Was this tied to cleanup activity or another workflow? If you see change_tracking_syscommittab_truncate around the same time (and correlated via session/transaction/casuality identifiers), that can indicate the drop happened in proximity to Change Tracking maintenance behavior. Was the drop recurring or one-off? If you capture repeated events at a steady cadence, it points to an automated process (job, deployment pipeline, scheduled task, framework) rather than an ad-hoc human action. Why this matters: the history table is part of Change Tracking troubleshooting Microsoft’s Change Tracking cleanup troubleshooting guidance explicitly uses dbo.MSChange_tracking_history as the place to validate whether cleanup is running and whether errors are being logged. So if the history table is being dropped, you effectively lose an important “black box recorder” that you rely on to understand cleanup behavior—exactly why auditing the drop is so valuable. Operational tips (minimize noise, maximize signal) These are practical recommendations commonly used in incident investigations (treat them as operational guidance you can adapt to your environment): Run the session for a limited time window (enough to catch the drop). Keep actions focused (your list is already purpose-built for attribution). Prefer file target if you need durable evidence (especially when coordinating across teams). Document what “good” looks like before you enable the session (e.g., confirm whether the history table exists and whether it’s being written to), using the troubleshooting query from Microsoft docs. Common troubleshooting steps (when the audit session “doesn’t capture anything”) When you set up a targeted Extended Events session like CTXEvent, there are usually three places where things can go wrong: (1) Change Tracking state, (2) XEvent session scope/permissions, or (3) the target (storage/credential). The checklist below is written to help you isolate which layer is failing—quickly, and with minimal guesswork. 1) First, validate the Change Tracking baseline (so you’re not “tracing a ghost”) Does the history table exist—and is it expected to exist? Microsoft’s Change Tracking guidance uses dbo.MSChange_tracking_history as the first place to look for cleanup status and errors. If the table doesn’t exist, that can be a signal that auto-cleanup has never run (or hasn’t run since CT was re-enabled). Check whether auto-cleanup is enabled and whether it’s been running recently. The Change Tracking troubleshooting doc recommends checking sys.change_tracking_databases (to validate auto-cleanup is enabled) and querying the history table for recent entries (to validate cleanup is actually running). If dbo.MSChange_tracking_history is missing, confirm whether that’s due to CT lifecycle. A common “gotcha” is assuming the history table is created the moment CT is enabled. In practice, the table can be missing if CT was disabled and then re-enabled, or if only manual cleanup was used—because the history table is tied to auto-cleanup behavior. Why this matters: If the history table never existed (or is missing for expected reasons), your “history table drop” symptom might actually be a different behavior than a true DDL DROP—and you’ll want to confirm the CT lifecycle first before you rely on drop-auditing as the primary signal. 2) Confirm the Extended Events session is created in the right place (Azure SQL DB specifics) Make sure the session is database-scoped (Azure SQL Database requirement). In Azure SQL Database, Extended Events sessions are always database-scoped, and the event_file target writes to Azure Storage blobs (not local disk). If you accidentally create or manage the session as if it were server-scoped, you’ll hit confusing errors or see “no data.” Confirm you created the session in a user database (not master). Azure SQL Database doesn’t support creating database-scoped sessions from master. If you try, you can run into failures that look like target/session problems but are actually scope issues. Verify permissions: least privilege that still works. If the session creation/alter/start fails silently (or you can’t start it), confirm the principal has the right database permission. A practical minimum that works for managing DB-scoped sessions is ALTER ANY DATABASE EVENT SESSION (instead of granting broad CONTROL/db_owner). 3) If you’re using event_file: storage + credential is the most common failure point If the session starts but no .xel ever shows up, focus here first—because event_file in Azure SQL DB depends on a correct Storage setup. Validate the “happy path” prerequisites (in order): Storage account exists and a container exists. The Database Engine has access to that container either via RBAC (managed identity) or via a SAS token. A credential is created in the same database where the session is created. Microsoft’s event_file walkthrough is explicit about these steps, and missing any one of them can cause “target initialization” or “no output” symptoms. Quick diagnostic: temporarily switch to an in-memory target to prove events are firing. The Azure SQL Extended Events guidance notes you can use a ring_buffer target as a quick way to validate that the session is collecting events (without involving storage). If ring_buffer shows events but event_file does not, the issue is almost certainly storage/credential access. Common “it looks correct but still fails” causes (practical): You created the credential in the wrong database (or the session is in a different DB than the credential). The container permissions don’t actually include write access for the engine identity/token. The session was created correctly but never started (especially if STARTUP_STATE = OFF). 4) If you do capture events, but can’t attribute “who did it” Once the session is logging events, attribution usually comes down to having the right actions attached. The docs emphasize that Extended Events are designed to collect “as much or as little as necessary,” and in investigations you typically want the “who/what/where” context: app name, hostname, username, session_id, sql_text, etc. Practical tip: Start with your curated set of actions (like client_app_name, client_hostname, username, session_id, and sql_text), and only add more fields if you still can’t triangulate the origin. This keeps overhead and noise down while staying evidence driven. 5) If the table drop is periodic (hourly / scheduled), treat it like an automation clue In real customer scenarios, the symptom can be “history table disappears repeatedly,” which makes it especially important to correlate drops with client_app_name / hostname / username (and optionally transaction/session details) to determine whether this is a scheduled job, maintenance task, or application behavior. This is exactly the type of “pattern identification” where XEvents tends to outperform ad-hoc guessing. Quick “decision tree” summary History table missing? Start with CT lifecycle + auto-cleanup checks. Session exists but captures nothing? Confirm DB scope + permissions. Captures to ring_buffer but not to event_file? Storage/credential access problem. Captures events but no “who”? Add/verify the right actions (client_app_name/hostname/username/sql_text). References Extended Events QuickStart and overview (applies to Azure SQL Database). Change Tracking cleanup troubleshooting and history table usage (dbo.MSChange_tracking_history). Event File target for Azure SQL Database stored in Azure Storage + steps (RBAC/SAS + credential). Reading XEL output from blob using sys.fn_xe_file_target_read_file.300Views0likes0CommentsLessons Learned #559: Understanding query timeouts in Azure SQL Database
In a recent support case, an application using Hibernate and the Microsoft JDBC Driver for SQL Server reported "The query has timed out". The application team had timestamps for the failures, but the SQL evidence reviewed did not show matching query cancellations. This raised a question that developers and DBAs frequently ask: If the exception contains SQLServerException, does that mean the database engine generated the timeout? The important distinction is where the timeout is reported and enforced, versus what caused the operation to exceed that limit. A command timeout is controlled by the client. Its underlying cause can still be a slow query, blocking, a communication delay, or another issue along the client and database path. In this article, we will explain that distinction, what to capture when it happens, and when increasing the command timeout can be appropriate. The examples use invented values and generic statements; no customer identifiers or application SQL are included. First identify which timeout occurred An application request can wait at several different stages. Before changing a setting, identify the stage that failed. Stage What to check Acquiring a connection from the pool Pool capacity, connection lifetime, and the pool acquisition timeout Establishing a database connection Connection or login timeout, endpoint, authentication, and handshake evidence Executing a SQL command Effective JDBC query timeout or SqlClient CommandTimeout, query execution, and blocking Communicating with the server Driver socket settings and evidence of interrupted or delayed communication Processing the application request ORM processing and the application's request or transaction deadline Changing a connection timeout does not increase the query timeout. Similarly, an HTTP request deadline is not the same setting as a database command timeout. A failure while obtaining a pooled connection should not automatically be investigated as a query that timed out in SQL. The Microsoft JDBC timeout documentation distinguishes these settings. JDBC queryTimeout and cancelQueryTimeout use seconds; socketTimeout uses milliseconds. Understand what the exception tells us The useful part of the exception chain in this case was: org.hibernate.QueryTimeoutException Caused by: java.sql.SQLTimeoutException: The query has timed out. Caused by: com.microsoft.sqlserver.jdbc.SQLServerException: The query has timed out. ... TDSCommand.checkForInterrupt(...) The stack places the observed exception in the client/JDBC execution and response handling path, propagated through Hibernate. SQLServerException is a driver exception class. Its presence alone does not establish that SQL Server generated a corresponding engine error. This is a client reported query timeout. That describes the observed error, not the root cause. If blocking prevents a command from completing before the client's limit, the client raises the timeout, while the delay is explained by database activity. Developers and DBAs need to investigate the same attempt together. What queryTimeout actually controls The Microsoft JDBC Driver uses queryTimeout to limit its wait for a server response after sending an execute command. When that timeout expires, the documented behavior is to cancel the command. cancelQueryTimeout controls the subsequent wait for acknowledgment of cancellation before the driver closes the connection. These settings do not define an exact stopwatch for the entire business request. Pool acquisition, connection establishment, cancellation handling, retries, and application processing can have different deadlines. The caller's total elapsed time can therefore differ from the configured query timeout. For JDBC, setQueryTimeout sets the timeout on a statement in seconds. In .NET, the corresponding setting is SqlCommand.CommandTimeout. Its documented semantics include network reads during command execution or result processing; it is not a limit on all user code that processes those results. The default is also provider dependent. SqlClient documents a 30 second default. Do not assume the same default for JDBC or for statements created by an ORM. Check the effective value used by the failing operation. This client command timeout is not an Azure SQL Database engine configuration setting. The same distinction applies when the application connects to Azure SQL Managed Instance or SQL Server on an Azure VM. How a command timeout becomes an Attention The application configures the driver's deadline; it does not send a "CommandTimeout" SQL error to the engine. The diagram shows the cancellation path for a request already sent through the Microsoft JDBC Driver. If the command completes within the limit, no timeout driven Attention is needed. Figure 1. The application owns the deadline. The driver enforces it and requests cancellation; the engine handles the SQL request. The values are illustrative, not recommended settings. For an already submitted request, Attention is a TDS cancellation message. SQL Server marks the request for cancellation and honors it at yield points, as described in the Attention and error 3617 guidance. The timer expiring and the engine stopping are not necessarily simultaneous. The driver consumes the remaining response until it receives the cancellation acknowledgment. The TDS cancellation state describes this response cleanup. A query timeout normally leaves the connection open after that exchange; it does not immediately cut off all communication. If no acknowledgment arrives and a configured cancelQueryTimeout expires, the Microsoft JDBC Driver closes the connection. A socket timeout or transport failure can also close it. Closing the socket alone does not establish the SQL operation's outcome. Other providers can have different cancellation and connection handling details. What we could conclude from the case We reviewed the reported failure windows, the available SQL activity, and the query identified by the application team. Some client initiated aborts were recorded, but we could not correlate them with the reported failures. The resource metrics reviewed did not establish resource pressure as the cause either. The supported conclusion was that the client reported a query timeout, while the SQL evidence reviewed did not identify a matching cancellation or establish the root cause. Further correlation was required. The reported statement was a SELECT. The transaction and write examples later in this article explain additional design considerations; they are not findings of failed writes or abandoned transactions in this case. Statistics maintenance had also been performed, but that action did not establish why the client timed out. A fast maximum or average in the available query statistics does not prove that the failed attempt was fast. Confirm the query, parameter types, destination database and replica, execution context, and time window. Successful executions and retries may appear alongside the attempt that failed. Developers should capture each failed attempt The message alone is not enough. Record the failure as an individual attempt that a DBA can correlate with database evidence. Evidence to record Why it matters UTC start and error timestamps and elapsed time Establish the failure window and observed duration Request correlation identifier and attempt number Separate the original call from retries Full exception chain and available SQLState or error code Identify the provider and phase reporting the failure Driver and ORM versions and effective timeout with its unit Establish which settings actually applied Parameterized SQL template and parameter types Identify the statement without publishing customer data Protected destination and connection identifiers Correlate with the correct database, replica, and session Measure pool acquisition, execution, result reading, and subsequent application processing separately. A request duration alone cannot tell us where the time was spent. If the ordinary logs are insufficient, collect a targeted JDBC driver trace during the same window. Keep credentials and personal data out of diagnostic examples. Retain the necessary correlation details in controlled diagnostic records and anonymize them before sharing publicly. DBAs should correlate cancellations with execution evidence On the database side, use Extended Events to capture sqlserver.attention together with relevant batch or RPC start and completion events. Correlate the timestamps and session or connection information with the application's failed attempt. The query timeout troubleshooting guidance describes this approach. An Attention indicates a client cancellation signal, but it does not identify why the client canceled. A user pressing Cancel can also produce it. Compare the associated execution duration with the application's effective timeout and logs; do not interpret the Attention event's own duration as the query's total runtime. Query Store adds historical context. In sys.query_store_runtime_stats, execution_type = 3 means client initiated aborted execution. It is not an exclusive count of query timeouts. Query Store statistics are aggregated. Select intervals overlapping the incident window, aggregate rows for the same plan, execution type, and interval, and examine both aborted and regular executions. Filtering only on last_execution_time can miss relevant activity within an interval. A query hash identifies a query family, not an individual request. For additional examples, see Lesson Learned 1 on capturing a TSQL command timeout, Lesson Learned 202 on reproducing and finding a command timeout, and Lesson Learned 525 on tracking timeouts beyond Query Store with Extended Events. For Azure SQL Database, use database scoped Extended Events. Check capture coverage, filters, retention, and possible event loss before interpreting missing events. Do not expect every command timeout to appear in the SQL error log. Also check transaction cleanup. Canceling a statement does not guarantee that the entire explicit transaction has been rolled back. The application's error handling must account for the resulting transaction state, as explained in the Azure SQL blocking guidance. When increasing the command timeout makes sense In Lesson Learned 253 and Lesson Learned 372, I shared examples that increase the execution timeout across retry attempts, including a PowerShell example. That technique changes how long the client is prepared to wait. It does not make the SQL statement execute faster. A bounded increase may be appropriate when the workload legitimately needs more time, or as a temporary mitigation while investigating. It can also help a controlled diagnostic execution complete so its behavior can be examined. If the operation normally completes quickly but suddenly exceeds the limit, investigate blocking, plan changes, resource waits, and communication before treating a larger timeout as the permanent solution. Verify the change against representative load and the application's response time requirements. The following examples show where the setting belongs. They assume an already open connection and run a generic statement with an intentional delay. Use them only in a test environment. For Java with the Microsoft JDBC Driver: try (java.sql.Statement statement = connection.createStatement()) { statement.setQueryTimeout(20); // seconds statement.execute("WAITFOR DELAY '00:00:12'; SELECT 1;"); } For .NET with Microsoft.Data.SqlClient: using var command = connection.CreateCommand(); command.CommandTimeout = 20; // seconds command.CommandText = "WAITFOR DELAY '00:00:12'; SELECT 1;"; using var reader = command.ExecuteReader(); With a 5 second command timeout, the deliberate 12 second delay should produce a timeout. With 20 seconds, the operation should have time to complete under normal test conditions. The delay has not become shorter; only the client's permitted wait has changed. This demonstrates the mechanism, not a fix for the original case. For each test, record the UTC start and end, effective timeout, elapsed time, exception, and attempt identifier. Capture Attention and the related execution events at the same time. Compare the two runs: the application setting changed, while the SQL statement and database configuration remained the same. Use the captured events to verify the expected behavior rather than assuming exact timestamps or a fixed event count. When an ORM creates the statement, apply the equivalent setting through the supported ORM configuration and verify its effective value and unit. Setting setQueryTimeout(0) or CommandTimeout = 0 removes that statement's timeout limit; it should not be a routine response to unexplained failures. If retries are used, record the timeout on every attempt, limit the attempts, allow a delay between them, and keep the total within the request's overall deadline. Transactions determine what must succeed or fail together A single UPDATE, INSERT, or DELETE already executes within a transaction in autocommit mode. Use an explicit transaction when several statements form one business operation and must be committed or rolled back together. The transaction documentation describes these transaction modes. For example, an application might UPDATE inventory, INSERT an order, and DELETE its reservation. If the first two statements finish and the third is canceled, the outcome depends on how the unit of work was managed. Transaction design What the application must account for Each statement in autocommit Earlier statements may already be committed. Canceling the later statement does not undo those earlier commits. One explicit transaction for all three statements Earlier changes remain part of that transaction until it is committed or rolled back. An Attention alone does not guarantee rollback of the whole transaction. COMMIT sent but its confirmation not received The client may not know whether the transaction committed. Verify the outcome before retrying the business operation. One transaction preserves the intended unit of work; it does not replace timeout and error handling. An open transaction left after cancellation can retain locks and delay other sessions. A poorly handled timeout can therefore contribute to further timeouts. Keep the transaction as short as the business rules allow. Do not include user interaction or unrelated external calls while holding it open. A command timeout also does not automatically limit the transaction's total duration: if the application sends several commands separately, each command has its own limit. Track the total operation deadline as well. A rollback inside TSQL CATCH may never run for Attention This is an important detail for developers: T-SQL TRY CATCH does not catch Attentions, including client interrupt requests. Placing ROLLBACK only in a stored procedure's CATCH block is therefore insufficient protection against a client cancellation. The application or ORM that owns the transaction must handle the failed call and resolve that transaction. Attempt rollback using its transaction API when the connection remains usable; log cleanup failures separately and do not continue using an unresolved transaction. A rollback attempt is not proof of a completed rollback. Follow the provider's cleanup rules before returning the connection to normal pool use. SET XACT_ABORT ON controls transaction abortion for applicable runtime errors. Microsoft's Attention and transaction guidance also describes it as a way to control rollback when a cancellation occurs. Set it deliberately for the SQL session or batch and validate the behavior with the actual driver, ORM, and transaction ownership model. It does not change CommandTimeout, and it cannot undo a transaction that already committed. In a disposable test environment, repeat the cancellation experiment inside a transaction after a small data modification. Compare XACT_ABORT OFF and ON. After cancellation acknowledgment, inspect transaction state on the same usable connection and ensure cleanup. If cancellation closes the connection, record that outcome instead of claiming to have queried its former session. This test is separate from the original SELECT investigation. A timeout does not establish whether a write committed If a connection fails after COMMIT was processed but before its acknowledgment reaches the application, the client can receive an error even though the changes were committed. Retrying an INSERT or increment blindly can then duplicate a business operation. Microsoft's connection resiliency documentation describes this commit failure and idempotency issue. Use a stable operation identifier that is reused across retries. Record it atomically with the business changes and enforce uniqueness in the database, so a repeated attempt can identify the prior operation rather than apply it again. If the original transaction is still in progress, resolve or wait for its outcome; an absent record in a single check is not always conclusive. The transaction provides atomicity for the changes. An operation identifier and deliberate retry handling help the application manage an uncertain result. Together, they make the timeout response part of the business operation's design.