ebpf
13 TopicsAnnouncing the Open-Source Release of ML Video Codec (MLVC)
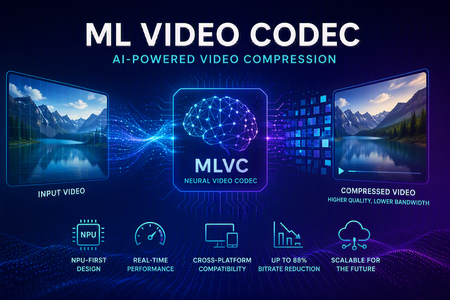
Video codecs compress video for transmission or storage, reducing bandwidth and storage requirements. MLVC is a modern machine-learning-based codec that uses substantially less bandwidth than conventional codecs, improving streaming and video-call quality—especially on constrained or unreliable networks—while lowering delivery and storage costs. MLVC is the product iteration of DCVC (Deep Contextual Video Compression) family of NVC (Neural Video Codec), open sourced by Microsoft Research since 2021, with improved compression efficiency, real-time performance on commodity Neural Processing Units (NPUs), and cross-platform support. We recently published this work in the paper MLVC: Multi-platform Learned Video Codec for Real-World Deployment. We are releasing the source code because we believe the next generation of video coding will be built openly, and we want the broader community — researchers, video codec engineers, platform vendors, product teams, as well as general developer community — to build it with us. Why MLVC Traditional video codecs (e.g., H.264/AVC, H.265/HEVC) have served the industry for a long time, but each generation requires enormous engineering effort for incremental gains and needs dedicated hardware which takes years to become commonly available. MLVC replaces conventional primitives — motion estimation, transforms, entropy modeling — with end-to-end learned neural compression, trained directly against rate-distortion objectives, and run on general-purpose NPU devices. The table below compares MLVC to popular video codecs, showing its lower bitrate and resulting savings in bandwidth and storage. Resolution vs H.264 vs H.265 360p 87.8% 75.5% 540p 82.7% 65.4% For example, for 360p video at 30 fps, where H.264 requires 1 Mbps, MLVC requires roughly 122 kbps for equivalent quality — about one-eight the bitrate under real-time conditions. The inference compute was kept approximately equal for the 360p and 540p resolutions. These results are based on a P.910 subjective test and are based on the Video Conferencing Dataset (VCD) dataset that we developed and also recently released as an open-source project. The following video demo illustrates the extent of quality enhancement achieved by MLVC relative to H.265/HEVC at the same bitrate of 200kbps (please watch by opening in a new window for better demonstration) \ Beyond video compression efficiency, MLVC also offers: NPU-first design. MLVC is built to run almost entirely on the AI accelerators already shipping in modern devices — Apple Neural Engine, Qualcomm and Intel NPUs — at no more than 50% NPU utilization, leaving NPU headroom for the rest of the system. Real-time execution at the targeted operating points. Demonstrated 540p at 30 fps on Apple, Intel, and Qualcomm hardware. A scaling-law trajectory. Empirically, MLVC's coding efficiency improves with increased model capacity and additional training compute. Content-adaptive behavior out of the box, without hand-tuned Rate Distortion Optimization heuristics. Already running in Microsoft Teams MLVC is more than just a research concept for Microsoft. We are currently rolling it out in Microsoft Teams, where it is being validated on real peer-to-peer video calls with active telemetry and A/B testing. The integration runs alongside fallback to conventional video codecs for hardware or reliability constraints — the kind of mixed-environment deployment that real products need. The scaling and reliability insights from this rollout are shaping the codec and its roadmap. We welcome your contributions We can not cover every use case, every device class, or every content domain by ourselves. That is why we are open sourcing MLVC. If you work on: Streaming, Video On Demand (VOD), or live broadcast Real-time communication and conferencing Cloud gaming or remote rendering Surveillance, drones, or robotics Mobile capture, Augmented Reality (AR) / Virtual Reality (VR), or volumetric video Codec hardware, NPUs, or inference runtimes We would love your help. Contributions of all kinds are welcome, including model improvements, training recipes, new platform ports and conversion targets, runtime backends, domain-specific fine-tunes, evaluation tooling, bug reports, and feedback on what is missing for your scenario. We particularly welcome platform ports that expand NPU coverage and efficiency improvements that push the rate-distortion frontier. What's in the release The MLVC repository is available at https://github.com/microsoft/mlvc and shared under the MIT License. It includes: MLVC model source code of the full network architecture. Trained model weights ready to run. Training scripts used to produce shipping models. Training data collection documentation to help reproduce and improve MLVC. Platform conversion scripts to target different NPUs and runtimes. Issues and pull requests will be open from day one. A follow-up release will add a C++ codec library, simplifying integration into real-world applications. Where we're heading Our long-term goal with MLVC is to create an open, learned video codec that meets or exceeds the coding efficiency of the best conventional codecs across the full range of video content, runs efficiently on the AI hardware already shipping in client and cloud devices, scales with compute the way modern ML systems do, and evolves in the open at the pace of the ML community rather than the pace of standardization cycles. In the near term that means stabilizing 540p real-time performance, expanding hardware coverage, and improving loss resilience. In the medium term: higher resolution, e.g., 1080p, and broader streaming scenarios. In the long term: an open video codec ecosystem that meaningfully replaces legacy stacks where it makes sense to. We can't create the future of MLVC alone. We're glad you're here, and we are looking forward to building the next-generation video codec with you. Who are we MLVC is brought to you by the following awesome folks working on the project at Microsoft: Ross Cutler, Ando Saabas, Tanel Pärnamaa, Ardi Loot, Haiyan Xie, Lauri Ehrenpreis, Andrei Znobishchev, Martin Lumiste, Evgenii Indenbom, Yan Lu, Bin Li, Jiahao Li, Naba Kumar, Babak Naderi, Juhee Cho, Badal Yadav, Jinxin Zhou, Tianyu Ding, Patrick Gregory. — The MLVC Team, Microsoft16KViews0likes5CommentsIntroducing kars - an Agent Reference Stack for Kubernetes
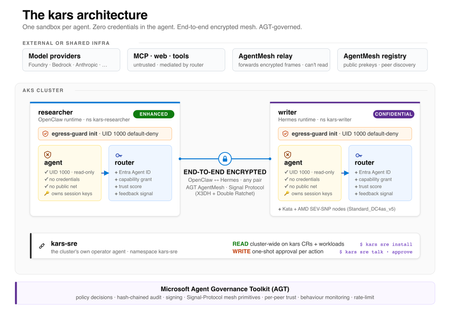
kars is an open-source, Kubernetes-native runtime for AI agents on Azure. It treats every agent as untrusted code - per-pod kernel isolation, zero credentials in the agent process, and an end-to-end encrypted inter-agent mesh - and governs agents on any framework with one set of Kubernetes policies via the Microsoft Agent Governance Toolkit. kars dev runs a governed agent on your laptop in minutes.2.6KViews1like2CommentseBPF-Powered Observability Beyond Azure: A Multi-Cloud Perspective with Retina
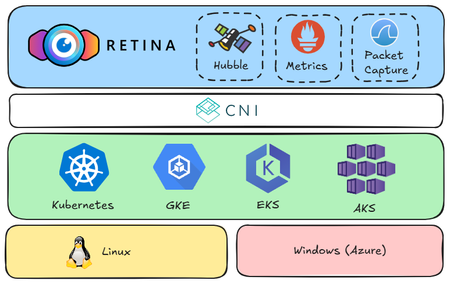
Kubernetes simplifies container orchestration but introduces observability challenges due to dynamic pod lifecycles and complex inter-service communication. eBPF technology addresses these issues by providing deep system insights and efficient monitoring. The open-source Retina project leverages eBPF for comprehensive, cloud-agnostic network observability across AKS, GKE, and EKS, enhancing troubleshooting and optimization through real-world demo scenarios.1.9KViews10likes0CommentsFrom Policy to Practice: Built-In CIS Benchmarks on Azure - Flexible, Hybrid-Ready
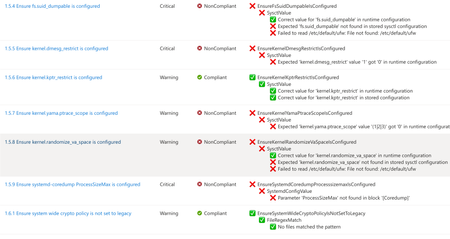
Security is more important than ever. The industry-standard for secure machine configuration is the Center for Internet Security (CIS) Benchmarks. These benchmarks provide consensus-based prescriptive guidance to help organizations harden diverse systems, reduce risk, and streamline compliance with major regulatory frameworks and industry standards like NIST, HIPAA, and PCI DSS. In our previous post, we outlined our plans to improve the Linux server compliance and hardening experience on Azure and shared a vision for integrating CIS Benchmarks. Today, that vision has turned into reality. We're now announcing the next phase of this work: Center for Internet Security (CIS) Benchmarks are now available on Azure for all Azure endorsed distros, at no additional cost to Azure and Azure Arc customers. With today's announcement, you get access to the CIS Benchmarks on Azure with full parity to what’s published by the Center for Internet Security (CIS). You can adjust parameters or define exceptions, tailoring security to your needs and applying consistent controls across cloud, hybrid, and on-premises environments - without having to implement every control manually. Thanks to this flexible architecture, you can truly manage compliance as code. How we achieve parity To ensure accuracy and trust, we rely on and ingest CIS machine-readable Benchmark content (OVAL/XCCDF files) as the source of truth. This guarantees that the controls and rules you apply in Azure match the official CIS specifications, reducing drift and ensuring compliance confidence. What’s new under the hood At the core of this update is kompli - a lightweight, open-source module developed by the Azure Core Linux team. It evaluates Linux systems directly against industry-standard benchmarks like CIS, supporting both audit and, in the future, auto-remediation. This enables accurate, scalable compliance checks across large Linux fleets. Here you can read more about kompli. Dynamic rule evaluation The new compliance engine supports simple fact-checking operations, evaluation of logic operations on them (e.g., anyOf, allOf) and Lua based scripting, which allows to express complex checks required by the CIS Critical Security Controls - all evaluated natively without external scripts. Scalable architecture for large fleets When the assignment is created, the Azure control plane instructs the machine to pull the latest Policy package via the Machine Configuration agent. kompli is integrated as a light-weight library to the package and called by Machine Configuration agent for evaluation – which happens every 15-30minutes. This ensures near real-time compliance state without overwhelming resources and enables consistent evaluation across thousands of VMs and Azure Arc-enabled servers. Future-ready for remediation and enforcement While the Public Preview starts with audit-only mode, the roadmap includes per-rule remediation and enforcement using technologies like eBPF for kernel-level controls. This will allow proactive prevention of configuration drift and runtime hardening at scale. Please reach out if you interested in auto-remediation or enforcement. Extensibility beyond CIS Benchmarks The architecture was designed to support other security and compliance standards as well and isn’t limited to CIS Benchmarks. The compliance engine is modular, and we plan to extend the platform with STIG and other relevant industry benchmarks. This positions Azure as a platform for a place where you can manage your compliance from a single control-plane without duplicating efforts elsewhere. Collaboration with the CIS This milestone reflects a close collaboration between Microsoft and the CIS to bring industry-standard security guidance into Azure as a built-in capability. Our shared goal is to make cloud-native compliance practical and consistent, while giving customers the flexibility to meet their unique requirements. We are committed to continuously supporting new Benchmark releases, expanding coverage with new distributions and easing adoption through built-in workflows, such as moving from your current Benchmark version to a new version while preserving your custom configurations. Certification and trust We can proudly announce that kompli has met all the requirements and is officially certified by the CIS for Benchmark assessment, so you can trust compliance results as authoritative. Minor benchmark updates will be applied automatically, while major version will be released separately. We will include workflows to help migrate customizations seamlessly across versions. Key Highlights Built-in CIS Benchmarks for Azure Endorsed Linux distributions Full parity with official CIS Benchmarks content and certified by the CIS for Benchmark Assessment Flexible configuration: adjust parameters, define exceptions, tune severity Hybrid support: enforce the same baseline across Azure, on-prem, and multi-cloud with Azure Arc Reporting format in CIS tooling style Supported use cases Certified CIS Benchmarks for all Azure Endorsed Distros - Audit only (L1/L2 server profiles) Hybrid / On-premises and other cloud machines with Azure Arc for the supported distros Compliance as Code (example via Github -> Azure OIDC auth and API integration) Compatible with GuestConfig workbook What’s next? Our next mission is to bring the previously announced auto-remediation capability into this experience, expand the distribution coverage and elevate our workflows even further. We’re focused on empowering you to resolve issues while honoring the unique operational complexity of your environments. Stay tuned! Get Started Documentation link for this capability Enable CIS Benchmarks in Machine Configuration and select the “Official Center for Internet Security (CIS) Benchmarks for Linux Workloads” then select the distributions for your assignment, and customize as needed. In case if you want any additional distribution supported or have any feedback for kompli – please open an Azure support case or a Github issue here Relevant Ignite 2025 session: Hybrid workload compliance from policy to practice on Azure Connect with us at Ignite Meet the Linux team and stop by the Linux on Azure booth to see these innovations in action: Session Type Session Code Session Name Date/Time (PST) Theatre THR 712 Hybrid workload compliance from policy to practice on Azure Tue, Nov 18/ 3:15 PM – 3:45 PM Breakout BRK 143 Optimizing performance, deployments, and security for Linux on Azure Thu, Nov 20/ 1:00 PM – 1:45 PM Breakout BRK 144 Build, modernize, and secure AKS workloads with Azure Linux Wed, Nov 19/ 1:30 PM – 2:15 PM Breakout BRK 104 From VMs and containers to AI apps with Azure Red Hat OpenShift Thu, Nov 20/ 8:30 AM – 9:15 AM Theatre THR 701 From Container to Node: Building Minimal-CVE Solutions with Azure Linux Wed, Nov 19/ 3:30 PM – 4:00 PM Lab Lab 505 Fast track your Linux and PostgreSQL migration with Azure Migrate Tue, Nov 18/ 4:30 PM – 5:45 PM PST Wed, Nov 19/ 3:45 PM – 5:00 PM PST Thu, Nov 20/ 9:00 AM – 10:15 AM PST1.6KViews0likes0Comments
Enhancing Observability with Inspektor Gadget
Thorough observability is essential to a pain free cloud experience. Azure provides many general-purpose observability tools, but you may want to create custom tooling . Inspektor Gadget is an open-source framework that makes customizable data collection easy. Microsoft recently contributed new features to Inspektor Gadget that further enhance its modular framework, making it even easier to meet your specific systems inspection needs. Of course, we also made it easy for Azure Kubernetes Service (AKS) users to use.1.2KViews0likes0CommentsScaling DNS on AKS with Cilium: NodeLocal DNSCache, LRP, and FQDN Policies
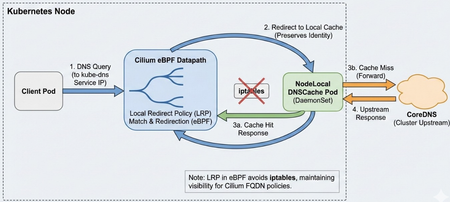
Why Adopt NodeLocal DNSCache? The primary drivers for adoption are usually: Eliminating Conntrack Pressure: In high-QPS UDP DNS scenarios, conntrack contention and UDP tracking can cause intermittent DNS response loss and retries; depending on resolver retry/timeouts, this can appear as multi-second lookup delays and sometimes much longer tails. Reducing Latency: By placing a cache on every node, you remove the network hop to the CoreDNS service. Responses are practically instantaneous for cached records. Offloading CoreDNS: A DaemonSet architecture effectively shards the DNS query load across the entire cluster, preventing the central CoreDNS deployment from becoming a single point of congestion during bursty scaling events. Who needs this? You should prioritize this architecture if you run: Large-scale clusters large clusters (hundreds of nodes or thousands of pods), where CoreDNS scaling becomes difficult to manage. High-churn endpoints, such as spot instances or frequent auto-scaling jobs that trigger massive waves of DNS queries. Real-time applications where multi-second (and occasionally longer) DNS lookup delays are unacceptable. The Challenge with Cilium Deploying NodeLocal DNSCache on a cluster managed by Cilium (CNI) requires a specific approach. Standard NodeLocal DNSCache relies on node-level interface/iptables setup. In Cilium environments, you can instead implement the interception via Cilium Local Redirect Policy (LRP), which redirects traffic destined to the kube-dns ClusterIP service to a node-local backend pod. This post details a production-ready deployment strategy aligned with Cilium’s Local Redirect Policy model. It covers necessary configuration tweaks to avoid conflicts and explains how to maintain security filtering. Architecture Overview In a standard Kubernetes deployment, NodeLocal DNSCache creates a dummy network interface and uses extensive iptables rules to hijack traffic destined for the Cluster DNS IP. When using Cilium, we can achieve this more elegantly and efficiently using Local Redirect Policies. DaemonSet: Runs node-local-dns on every node. Configuration: Configured to skip interface creation and iptables manipulation. Redirection: Cilium LRP intercepts traffic to the kube-dns Service IP and redirects it to the local pod on the same node. 1. The NodeLocal DNSCache DaemonSet The critical difference in this manifest is the arguments passed to the node-local-dns binary. We must explicitly disable its networking setup functions to let Cilium handle the traffic. The NodeLocal DNSCache deployment also requires the node-local-dns ConfigMap and the kube-dns-upstream Service (plus RBAC/ServiceAccount). For brevity, the snippet below shows only the DaemonSet arguments that differ in the Cilium/LRP approach. The node-cache reads the template Corefile (/etc/coredns/Corefile.base) and generates the active Corefile (/etc/Corefile). The -conf flag points CoreDNS at the active Corefile it should load. The node-cache binary accepts -localip as an IP list; 0.0.0.0 is a valid value and makes it listen on all interfaces, appropriate for the LRP-based redirection model. apiVersion: apps/v1 kind: DaemonSet metadata: name: node-local-dns namespace: kube-system labels: k8s-app: node-local-dns spec: selector: matchLabels: k8s-app: node-local-dns template: metadata: labels: k8s-app: node-local-dns annotations: # Optional: policy.cilium.io/no-track-port can be used to bypass conntrack for DNS. # Validate the impact on your Cilium version and your observability/troubleshooting needs. policy.cilium.io/no-track-port: "53" spec: # IMPORTANT for the "LRP + listen broadly" approach: # keep hostNetwork off so you don't hijack node-wide :53 hostNetwork: false # Don't use cluster DNS dnsPolicy: Default containers: - name: node-cache image: registry.k8s.io/dns/k8s-dns-node-cache:1.15.16 args: - "-localip" # Use a bind-all approach. Ensure server blocks bind broadly in your Corefile. - "0.0.0.0" - "-conf" - "/etc/Corefile" - "-upstreamsvc" - "kube-dns-upstream" # CRITICAL: Disable internal setup - "-skipteardown=true" - "-setupinterface=false" - "-setupiptables=false" ports: - containerPort: 53 name: dns protocol: UDP - containerPort: 53 name: dns-tcp protocol: TCP # Ensure your Corefile includes health :8080 so the liveness probe works livenessProbe: httpGet: path: /health port: 8080 initialDelaySeconds: 60 timeoutSeconds: 5 volumeMounts: - name: config-volume mountPath: /etc/coredns - name: kube-dns-config mountPath: /etc/kube-dns volumes: - name: kube-dns-config configMap: name: kube-dns optional: true - name: config-volume configMap: name: node-local-dns items: - key: Corefile path: Corefile.base 2. The Cilium Local Redirect Policy (LRP) Instead of iptables, we define a CRD that tells Cilium: "When you see traffic for `kube-dns`, send it to the `node-local-dns` pod on this same node." apiVersion: "cilium.io/v2" kind: CiliumLocalRedirectPolicy metadata: name: "nodelocaldns" namespace: kube-system spec: redirectFrontend: # ServiceMatcher mode is for ClusterIP services serviceMatcher: serviceName: kube-dns namespace: kube-system redirectBackend: # The backend pods selected by localEndpointSelector must be in the same namespace as the LRP localEndpointSelector: matchLabels: k8s-app: node-local-dns toPorts: - port: "53" name: dns protocol: UDP - port: "53" name: dns-tcp protocol: TCP This is an LRP-based NodeLocal DNSCache deployment: we disable node-cache’s iptables/interface setup and let Cilium LRP handle local redirection. This differs from the upstream NodeLocal DNSCache manifest, which uses hostNetwork + dummy interface + iptables. LRP must be enabled in Cilium (e.g., localRedirectPolicies.enabled=true) before applying the CRD. Official Cilium LRP doc DNS-Based FQDN Policy Enforcement Flow The diagram below illustrates how Cilium enforces FQDN-based egress policies using DNS observation and datapath programming. During the DNS resolution phase, queries are redirected to NodeLocal DNS (or CoreDNS), where responses are observed and used to populate Cilium’s FQDN-to-IP cache. Cilium then programs these mappings into eBPF maps in the datapath. In the connection phase, when the client initiates an HTTPS connection to the resolved IP, the datapath checks the IP against the learned FQDN map and applies the policy decision before allowing or denying the connection. The Network Policy "Gotcha" If you use CiliumNetworkPolicy to restrict egress traffic, specifically for FQDN filtering, you typically allow access to CoreDNS like this: - toEndpoints: - matchLabels: k8s:io.kubernetes.pod.namespace: kube-system k8s:k8s-app: kube-dns toPorts: - ports: - port: "53" protocol: ANY This will break with local redirection. Why? Because LRP redirects the DNS request to the node-local-dns backend endpoint; strict egress policies must therefore allow both kube-dns (upstream) and node-local-dns (the redirected destination). The Repro Setup To demonstrate this failure, the cluster is configured with: NodeLocal DNSCache: Deployed as a DaemonSet (node-local-dns) to cache DNS requests locally on every node. Local Redirect Policy (LRP): An active LRP intercepts traffic destined for the kube-dns Service IP and redirects it to the local node-local-dns pod. Incomplete Network Policy: A strict CiliumNetworkPolicy (CNP) is enforced on the client pod. While it explicitly allows egress to kube-dns, it misses the corresponding rule for node-local-dns. Reveal the issue using Hubble: In this scenario, the client pod dns-client is attempting to resolve the external domain github.com. When inspecting the traffic flows, you will see EGRESS DENIED verdicts. Crucially, notice the destination pod in the logs below: kube-system/node-local-dns, not kube-dns. Although the application originally sent the packet to the Cluster IP of CoreDNS, Cilium's Local Redirect Policy modified the destination to the local node cache. Since strictly defined Network Policies assume traffic is going to the kube-dns identity, this redirected traffic falls outside the allowed rules and is dropped by the default deny stance. The Fix: You must allow egress to both labels. - toEndpoints: - matchLabels: k8s:io.kubernetes.pod.namespace: kube-system k8s:k8s-app: kube-dns # Add this selector for the local cache - matchLabels: k8s:io.kubernetes.pod.namespace: kube-system k8s:k8s-app: node-local-dns toPorts: - ports: - port: "53" protocol: ANY Without this addition, pods protected by strict egress policies will timeout resolving DNS, even though the cache is running. Use Hubble to observe the network flows: After adding matchLabels: k8s:k8s-app: node-local-dns, the traffic is now allowed. Hubble confirms a policy verdict of EGRESS ALLOWED for UDP traffic on port 53. Because DNS resolution now succeeds, the response populates the Cilium FQDN cache, subsequently allowing the TCP traffic to github.com on port 443 as intended. Real-World Example: Restricting Egress with FQDN Policies Here is a complete CiliumNetworkPolicy that locks down a workload to only access api.example.com. Note how the DNS rule explicitly allows traffic to both kube-dns (for upstream) and node-local-dns (for the local cache). apiVersion: "cilium.io/v2" kind: CiliumNetworkPolicy metadata: name: secure-workload-policy spec: endpointSelector: matchLabels: app: critical-workload egress: # 1. Allow DNS Resolution (REQUIRED for FQDN policies) - toEndpoints: - matchLabels: k8s:io.kubernetes.pod.namespace: kube-system k8s:k8s-app: kube-dns # Allow traffic to the local cache redirection target - matchLabels: k8s:io.kubernetes.pod.namespace: kube-system k8s:k8s-app: node-local-dns toPorts: - ports: - port: "53" protocol: ANY rules: dns: - matchPattern: "*" # 2. Allow specific FQDN traffic (populated via DNS lookups) - toFQDNs: - matchName: "api.example.com" toPorts: - ports: - port: "443" protocol: TCP Configuration & Upstream Loops When configuring the ConfigMap for node-local-dns, use the standard placeholders provided by the image. The binary replaces them at runtime: __PILLAR__CLUSTER__DNS__: The Upstream Service IP (kube-dns-upstream). __PILLAR__UPSTREAM__SERVERS__: The system resolvers (usually /etc/resolv.conf). Ensure kube-dns-upstream exists as a Service selecting the CoreDNS pods so cache misses are forwarded to the actual CoreDNS backends. Alternative: AKS LocalDNS LocalDNS is an Azure Kubernetes Services (AKS)-managed node-local DNS proxy/cache. Pros: Managed lifecycle at the node pool level. Support for custom configuration via localdnsconfig.json (e.g., custom server blocks, cache tuning). No manual DaemonSet management required. Cons & Limitations: Incompatibility with FQDN Policies: As noted in the official documentation, LocalDNS isn’t compatible with applied FQDN filter policies in ACNS/Cilium; if you rely on FQDN enforcement, prefer a DNS path that preserves FQDN learning/enforcement. Updating configuration requires reimaging the node pool. For environments heavily relying on strict Cilium Network Policies and FQDN filtering, the manual deployment method described above (using LRP) can be more reliable and transparent. AKS recommends not enabling both upstream NodeLocal DNSCache and LocalDNS in the same node pool, as DNS traffic is routed through LocalDNS and results may be unexpected. References Kubernetes Documentation: NodeLocal DNSCache Cilium Documentation: Local Redirect Policy AKS Documentation: Configure LocalDNS1.2KViews3likes2CommentsFour open source projects to explore at Microsoft Build
Open source is where developers experiment, collaborate, and turn new ideas into tools that others can build on. At Microsoft Build, we’re creating a dedicated space for that energy: the Open Source Zone. This year, the Open Source Zone will bring together maintainers, contributors, and developers working on some of the most interesting open source projects in AI. Whether you’re building agents, experimenting with local models, exploring prompt workflows, or looking for practical ways to bring AI into your development process, this is a place to meet the people behind the projects and see what they’re building. The Open Source Zone is inspired by similar community spaces we’ve hosted at GitHub Universe: hands-on, conversation-driven, and centered on the people and projects moving open source forward. Meet the projects OpenClaw OpenClaw, originally Clawbot, formerly Clawdbot and briefly Moltbot,before landing on its current name (because naming is hard), is a personal AI assistant project built for developers who want more control over how AI agents run across tools, devices, and workflows. Its repository describes it as “your own personal AI assistant” across operating systems and platforms, with support for agent workspaces, skills, and device nodes. It has also become one of the fastest-growing open source projects on GitHub, with over 370,000 stars to date. At the Open Source Zone, attendees can learn how OpenClaw approaches personal agents, extensibility, and local-first experimentation. AutoGPT AutoGPT is one of the best-known open source projects in the autonomous agent space. The project’s mission is to make AI accessible for everyone to use and build on, with tools for building, testing, and delegating work to agents. Visit AutoGPT in the Open Source Zone to learn how the project is evolving agent development, benchmarking, frontend experiences, and practical workflows for building agent-powered applications. Come for the autonomous agents; stay for the very human maintainers. AutoGPT is also a member of GitHub’s Secure Open Source Fund, with a goal of enhancing AI security across the open source ecosystem. Open WebUI Open WebUI is a self-hosted, extensible AI platform for working with large language models. The project supports Ollama and OpenAI-compatible APIs and includes built-in RAG capabilities, making it a strong option for developers and organizations exploring local, private, or provider-flexible AI experiences. At Build, the Open WebUI team will show how developers can run, customize, and extend AI interfaces for their own environments. prompts.chat prompts.chat, formerly Awesome ChatGPT Prompts, is a curated collection of prompt examples for AI chat models. The project is designed to help people discover, share, and build better prompts for modern AI assistants. Created by Fatih Kadir Akın, a GitHub Star from Istanbul, prompts.chat reflects his work at the intersection of open source, developer education, and AI-assisted development. Fatih leads Developer Relations at Teknasyon, has authored books on JavaScript and prompt engineering, and is active in the community as a speaker, organizer, and contributor. Stop by to explore prompt libraries, prompt engineering resources, self-hosting options, and ways the community is making prompting more reusable and collaborative. Register for Microsoft Build Microsoft Build takes place June 2–3, 2026, in San Francisco and online. In-person passes are available, and online registration is free for livestreamed keynote and select session access. Register for Microsoft Build and come visit the Open Source Zone to meet the teams behind OpenClaw, AutoGPT, Open WebUI, and prompts.chat. We’ll see you there. <3900Views0likes0CommentsRetina 1.0 Is Now Available
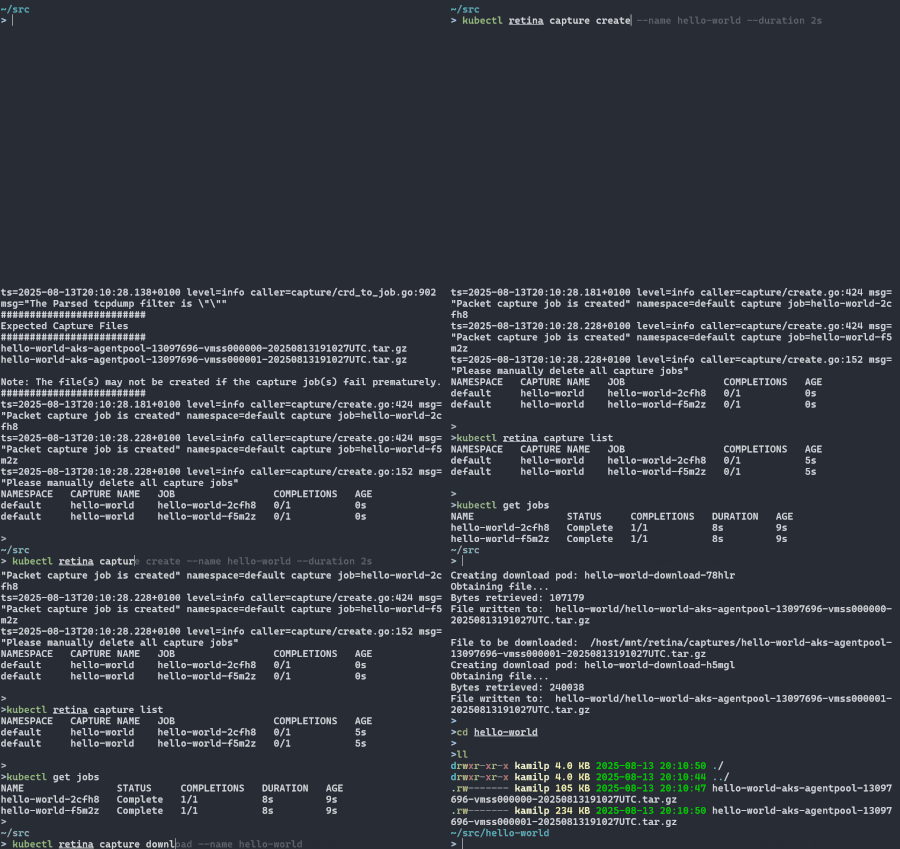
We are excited to announce the first major release of Retina - a significant milestone for the project. This version brings along many new features, enhancements and bug fixes. The Retina maintainer team would like to thank all contributors, community members, and early adopters who helped make this 1.0 release possible. What is Retina? Retina is an open-source, Kubernetes network observability platform. It enables you to continuously observe and measure network health, and investigate network issues on-demand with integrated Kubernetes-native workflows. Why Retina? Kubernetes networking failures are rarely isolated or easy to reproduce. Pods are ephemeral, services span multiple nodes, and network traffic crosses multiple layers (CNI, kube-proxy, node networking, policies), making crucial evidence difficult to capture. Manually connecting to nodes and stitching together logs or packet captures simply does not scale as clusters grow in size and complexity. A modern approach to observability must automate and centralize data collection while exposing rich, actionable insights. Retina represents a major step forward in solving the complexities of Kubernetes observability by leveraging the power of eBPF. Its cloud-agnostic design, deep integration with Hubble, and support for both real-time metrics and on-demand packet captures make it an invaluable tool for DevOps, SecOps, and compliance teams across diverse environments. What Does It Do? Retina can collect two types of telemetry: metrics and packet captures. The Retina shell enables ad-hoc troubleshooting via pre-installed networking tools. Metrics Metrics provide continuous observability. They can be exported to multiple storage options such as Prometheus or Azure Monitor, and visualized in a variety of ways, including Grafana or Azure Log Analytics. Retina supports two control planes: Hubble and Standard. Both are supported regardless of the underlying CNI. The choice of control plane affects the metrics which are collected. Hubble metrics Standard metrics You can customize which metrics are collected by enabling/disabling their corresponding plugins. Some examples of metrics may include: Incoming/outcoming traffic Dropped packets TCP/UDP DNS API Server latency Node/interface statistics Packet Captures Captures provide on-demand observability. They allow users to perform distributed packet captures across the cluster, based on specified Nodes/Pods and other supported filters. They can be triggered via the CLI or through the capture CRD, and may be output to persistent storage options such as the host filesystem, a PVC, or a storage blob. The result of the capture contains more than just a .pcap file. Retina also captures a number of networking metadata such as iptables rules, socket statistics, kernel network information from /proc/net, and more. Shell The Retina shell enables deep ad-hoc troubleshooting by providing a suite of networking tools. The CLI command starts an interactive shell on a Kubernetes node that runs a container image which includes standard tools such as ping or curl, as well as specialized tools like bpftool, pwru, Inspektor Gadget and more. The Retina shell is currently only available on Linux. Note that some tools require particular capabilities to execute. These can be passed as parameters through the CLI. Use Cases Debugging Pod Connectivity Issues: When services can’t communicate, Retina enables rapid, automated distributed packet capture and drop metrics, drastically reducing troubleshooting time. The Retina shell also brings specialized tools for deep manual investigations. Continuous Monitoring of Network Health: Operators can set up alerts and dashboards for DNS failures, API server latency, or packet drops, gaining ongoing visibility into cluster networking. Security Auditing and Compliance: Flow logs (in Hubble mode) and metrics support security investigations and compliance reporting, enabling quick identification of unexpected connections or data transfers. Multi-Cluster / Multi-Cloud Visibility: Retina standardizes network observability across clouds, supporting unified dashboards and processes for SRE teams. Where Does It Run? Retina is designed for broad compatibility across Kubernetes distributions, cloud providers, and operating systems. There are no Azure-specific dependencies - Retina runs anywhere Kubernetes does. Operating Systems: Both Linux and Windows nodes are supported. Kubernetes Distributions: Retina is distribution-agnostic, deployable on managed services (AKS, EKS, GKE) or self-managed clusters. CNI / Network Stack: Retina works with any CNI, focusing on kernel-level events rather than CNI-specific logs. Cloud Integration: Retina exports metrics to Azure Monitor and Log Analytics, with pre-built Grafana dashboards for AKS. Integration with AWS CloudWatch or GCP Stackdriver is possible via Prometheus. Observability Stacks: Retina integrates with Prometheus & Grafana, Cilium Hubble (for flow logs and UI), and can be extended to other exporters. Design Overview Retina’s architecture consists of two layers: a data collection layer in the kernel-space, and processing layer that converts low-level signals into Kubernetes-aware telemetry in the user-space. When Retina is installed, each node in the cluster runs a Retina agent which collects raw network telemetry from the host kernel - backed by eBPF on Linux, and HNS/VFP on Windows. The agent processes the raw network data and enriches it with Kubernetes metadata, which is then exported for consumption by monitoring tools such as Prometheus, Grafana, or Hubble UI. Modularity and extensibility are central to the design philosophy. Retina's plugin model lets you enable only the telemetry you need, and add new sources by implementing a common plugin interface. Built-in plugins include Drop Reason, DNS, Packet Forward, and more. Check out our architecture docs for a deeper dive into Retina's design. Get Started Thanks to Helm charts deploying Retina is streamlined across all environments, and can be done with one configurable command. For complete documentation, visit our installation docs. To install Retina with the Standard control plane and Basic metrics mode: VERSION=$( curl -sL https://api.github.com/repos/microsoft/retina/releases/latest | jq -r .name) helm upgrade --install retina oci://ghcr.io/microsoft/retina/charts/retina \ --version $VERSION \ --namespace kube-system \ --set image.tag=$VERSION \ --set operator.tag=$VERSION \ --set logLevel=info \ --set operator.enabled=true \ --set enabledPlugin_linux="\[dropreason\,packetforward\,linuxutil\,dns\]" Once Retina is running in your cluster, you can then configure Prometheus and Grafana to scrape and visualize your metrics. Install the Retina CLI with Krew: kubectl krew install retina Get Involved Retina is open-source under the MIT License and welcomes community contributions. Since its announcement in early 2024, the project has gained significant traction, with contributors from multiple organizations helping to expand its capabilities. The project is hosted on GitHub · microsoft/retina and documentation is available at retina.sh. If you would like to contribute to Retina you can follow our contributor guide. What's Next? Retina 1.1 of course! We are also discussing the future roadmap, and exploring the possibility of moving the project to community ownership. Stay tuned! In the meantime, we welcome you to raise an issue if you find any bugs, or start a discussion if you have any questions or suggestions. You can also reach out to the Retina team via email, we would love to hear from you! References Retina Deep Dive into Retina Open-Source Kubernetes Network Observability Troubleshooting Network Issues with Retina Retina: Bridging Kubernetes Observability and eBPF Across the Clouds823Views0likes0CommentsNow Generally Available: Built-in CIS Benchmark Auditing for Linux on Azure
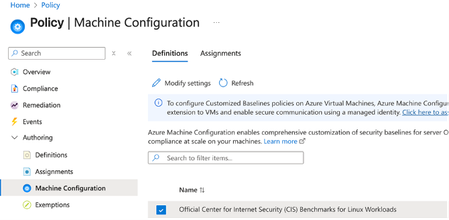
A few months ago, in From Policy to Practice: Built-in CIS Benchmarks on Azure – Flexible, Hybrid-Ready, we introduced a new way to bring Center for Internet Security (CIS) Benchmarks to your Linux estate using Azure Policy with Machine Configuration. It builds on the broader customizable security baseline policies in Machine Configuration capability. Today we're excited to share the next milestone: the audit capability for CIS Benchmarks on Linux is now Generally Available (GA). This release is officially powered by kompli - our native Linux compliance and hardening engine for CIS, STIG, and custom baselines. kompli is the evolution of the engine that drove the preview, now established as the dedicated home for this capability going forward. What "GA" means for you The audit experience is now ready for production use. You can continuously assess your Linux workloads against official, CIS-certified benchmarks - at scale, across Azure and hybrid environments through Azure Arc - and get clear, CIS-style compliance reporting directly in Azure Policy and Azure Resource Graph. If you've read the previous post, the how hasn't changed, so we'll keep this one short: Automated compliance assessment - continuously monitor Linux systems against official CIS benchmarks. Tailored benchmarks - customize evaluations with exceptions and custom parameters, no code changes required. Compliance reporting - detailed, CIS-style reports across your fleet. Hybrid-ready - the same baselines apply to Azure VMs and Arc-enabled servers on-premises or in other clouds. All supported benchmarks are CIS Benchmark Assessment Certified and stay in parity with the content published on the CIS website. Supported distributions and benchmark versions With this release, audit is GA across the following distributions, covering Level 1 + Level 2 Server profiles: Distribution CIS Benchmark Version(s) Profiles Audit Ubuntu 20.04 / 22.04 / 24.04 LTS + Pro v3.0.0 / v2.0.0 + v3.0.0 / v1.0.0 L1 + L2 Server ✓ Red Hat Enterprise Linux 8 / 9 / 10 v3.0.0 + v4.0.0 / v2.0.0 / v1.0.1 L1 + L2 Server ✓ AlmaLinux 8 / 9 v3.0.0 + v4.0.0 / v2.0.0 L1 + L2 Server ✓ Rocky Linux 8 / 9 v2.0.0 + v3.0.0 / v2.0.0 L1 + L2 Server ✓ Oracle Linux 8 / 9 v3.0.0 + v4.0.0 / v2.0.0 L1 + L2 Server ✓ Debian 11 / 12 v2.0.0 / v1.1.0 L1 + L2 Server ✓ SUSE Linux Enterprise 12 / 15 v3.2.1 / v2.0.1 L1 + L2 Server ✓ AKS Optimized Azure Linux 3 v1.0.0 L1 + L2 Server ✓ This GA covers the audit (assessment) capability. Looking ahead, STIG benchmarks are coming next, followed by a granular per-rule auto-remediation capability with dynamic scope assignments. You can run these benchmarks against your own hardened images, against CIS hardened images, and against custom images built on top of vanilla distros — as long as /etc/os-release retains its original content. We're also working with vendors to minimize deviations. Getting started Open Azure Policy in the Azure portal. Under Authoring, select the new Machine Configuration blade. Choose Official Center for Internet Security (CIS) Benchmarks for Linux Workloads, then Modify Settings to pick the distributions you want to assess. Full documentation, including per-distribution rule details, supported parameters, and any known deviations from the official CIS toolset, is available here: Overview: CIS Security Benchmarks for Linux Workloads Per-distribution references: AlmaLinux, Azure Linux, Debian, Oracle Linux, Red Hat Enterprise Linux, Rocky Linux, SUSE Linux Enterprise, and Ubuntu - all linked from the overview page. We're building this with you As part of this GA release, we've also expanded the set of exposed rule parameters compared to the preview - giving you more out-of-the-box customization across rules and distributions. That said, our customer-driven approach still stands: we keep the experience clean by enabling parameters based on real demand, so if there's a rule, benchmark version, or distribution you'd like parameters enabled for - or any feedback on rules, evaluations, or distro coverage - let us know: Open a GitHub issue in the kompli repository Open an Azure support case Try it out, tell us what you think, and help shape what we build next.500Views1like0Comments