ebpf
27 TopicsAnnouncing the Open-Source Release of ML Video Codec (MLVC)
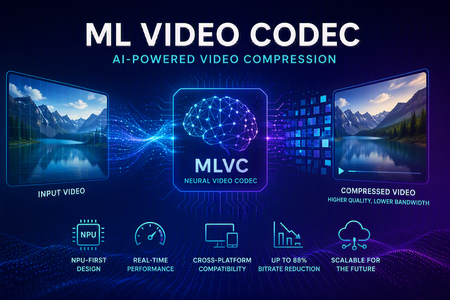
Video codecs compress video for transmission or storage, reducing bandwidth and storage requirements. MLVC is a modern machine-learning-based codec that uses substantially less bandwidth than conventional codecs, improving streaming and video-call quality—especially on constrained or unreliable networks—while lowering delivery and storage costs. MLVC is the product iteration of DCVC (Deep Contextual Video Compression) family of NVC (Neural Video Codec), open sourced by Microsoft Research since 2021, with improved compression efficiency, real-time performance on commodity Neural Processing Units (NPUs), and cross-platform support. We recently published this work in the paper MLVC: Multi-platform Learned Video Codec for Real-World Deployment. We are releasing the source code because we believe the next generation of video coding will be built openly, and we want the broader community — researchers, video codec engineers, platform vendors, product teams, as well as general developer community — to build it with us. Why MLVC Traditional video codecs (e.g., H.264/AVC, H.265/HEVC) have served the industry for a long time, but each generation requires enormous engineering effort for incremental gains and needs dedicated hardware which takes years to become commonly available. MLVC replaces conventional primitives — motion estimation, transforms, entropy modeling — with end-to-end learned neural compression, trained directly against rate-distortion objectives, and run on general-purpose NPU devices. The table below compares MLVC to popular video codecs, showing its lower bitrate and resulting savings in bandwidth and storage. Resolution vs H.264 vs H.265 360p 87.8% 75.5% 540p 82.7% 65.4% For example, for 360p video at 30 fps, where H.264 requires 1 Mbps, MLVC requires roughly 122 kbps for equivalent quality — about one-eight the bitrate under real-time conditions. The inference compute was kept approximately equal for the 360p and 540p resolutions. These results are based on a P.910 subjective test and are based on the Video Conferencing Dataset (VCD) dataset that we developed and also recently released as an open-source project. The following video demo illustrates the extent of quality enhancement achieved by MLVC relative to H.265/HEVC at the same bitrate of 200kbps (please watch by opening in a new window for better demonstration) \ Beyond video compression efficiency, MLVC also offers: NPU-first design. MLVC is built to run almost entirely on the AI accelerators already shipping in modern devices — Apple Neural Engine, Qualcomm and Intel NPUs — at no more than 50% NPU utilization, leaving NPU headroom for the rest of the system. Real-time execution at the targeted operating points. Demonstrated 540p at 30 fps on Apple, Intel, and Qualcomm hardware. A scaling-law trajectory. Empirically, MLVC's coding efficiency improves with increased model capacity and additional training compute. Content-adaptive behavior out of the box, without hand-tuned Rate Distortion Optimization heuristics. Already running in Microsoft Teams MLVC is more than just a research concept for Microsoft. We are currently rolling it out in Microsoft Teams, where it is being validated on real peer-to-peer video calls with active telemetry and A/B testing. The integration runs alongside fallback to conventional video codecs for hardware or reliability constraints — the kind of mixed-environment deployment that real products need. The scaling and reliability insights from this rollout are shaping the codec and its roadmap. We welcome your contributions We can not cover every use case, every device class, or every content domain by ourselves. That is why we are open sourcing MLVC. If you work on: Streaming, Video On Demand (VOD), or live broadcast Real-time communication and conferencing Cloud gaming or remote rendering Surveillance, drones, or robotics Mobile capture, Augmented Reality (AR) / Virtual Reality (VR), or volumetric video Codec hardware, NPUs, or inference runtimes We would love your help. Contributions of all kinds are welcome, including model improvements, training recipes, new platform ports and conversion targets, runtime backends, domain-specific fine-tunes, evaluation tooling, bug reports, and feedback on what is missing for your scenario. We particularly welcome platform ports that expand NPU coverage and efficiency improvements that push the rate-distortion frontier. What's in the release The MLVC repository is available at https://github.com/microsoft/mlvc and shared under the MIT License. It includes: MLVC model source code of the full network architecture. Trained model weights ready to run. Training scripts used to produce shipping models. Training data collection documentation to help reproduce and improve MLVC. Platform conversion scripts to target different NPUs and runtimes. Issues and pull requests will be open from day one. A follow-up release will add a C++ codec library, simplifying integration into real-world applications. Where we're heading Our long-term goal with MLVC is to create an open, learned video codec that meets or exceeds the coding efficiency of the best conventional codecs across the full range of video content, runs efficiently on the AI hardware already shipping in client and cloud devices, scales with compute the way modern ML systems do, and evolves in the open at the pace of the ML community rather than the pace of standardization cycles. In the near term that means stabilizing 540p real-time performance, expanding hardware coverage, and improving loss resilience. In the medium term: higher resolution, e.g., 1080p, and broader streaming scenarios. In the long term: an open video codec ecosystem that meaningfully replaces legacy stacks where it makes sense to. We can't create the future of MLVC alone. We're glad you're here, and we are looking forward to building the next-generation video codec with you. Who are we MLVC is brought to you by the following awesome folks working on the project at Microsoft: Ross Cutler, Ando Saabas, Tanel Pärnamaa, Ardi Loot, Haiyan Xie, Lauri Ehrenpreis, Andrei Znobishchev, Martin Lumiste, Evgenii Indenbom, Yan Lu, Bin Li, Jiahao Li, Naba Kumar, Babak Naderi, Juhee Cho, Badal Yadav, Jinxin Zhou, Tianyu Ding, Patrick Gregory. — The MLVC Team, Microsoft16KViews0likes5CommentsFrom Policy to Practice: Built-In CIS Benchmarks on Azure - Flexible, Hybrid-Ready
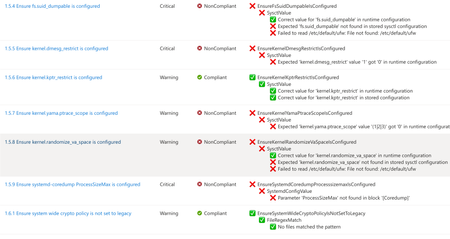
Security is more important than ever. The industry-standard for secure machine configuration is the Center for Internet Security (CIS) Benchmarks. These benchmarks provide consensus-based prescriptive guidance to help organizations harden diverse systems, reduce risk, and streamline compliance with major regulatory frameworks and industry standards like NIST, HIPAA, and PCI DSS. In our previous post, we outlined our plans to improve the Linux server compliance and hardening experience on Azure and shared a vision for integrating CIS Benchmarks. Today, that vision has turned into reality. We're now announcing the next phase of this work: Center for Internet Security (CIS) Benchmarks are now available on Azure for all Azure endorsed distros, at no additional cost to Azure and Azure Arc customers. With today's announcement, you get access to the CIS Benchmarks on Azure with full parity to what’s published by the Center for Internet Security (CIS). You can adjust parameters or define exceptions, tailoring security to your needs and applying consistent controls across cloud, hybrid, and on-premises environments - without having to implement every control manually. Thanks to this flexible architecture, you can truly manage compliance as code. How we achieve parity To ensure accuracy and trust, we rely on and ingest CIS machine-readable Benchmark content (OVAL/XCCDF files) as the source of truth. This guarantees that the controls and rules you apply in Azure match the official CIS specifications, reducing drift and ensuring compliance confidence. What’s new under the hood At the core of this update is kompli - a lightweight, open-source module developed by the Azure Core Linux team. It evaluates Linux systems directly against industry-standard benchmarks like CIS, supporting both audit and, in the future, auto-remediation. This enables accurate, scalable compliance checks across large Linux fleets. Here you can read more about kompli. Dynamic rule evaluation The new compliance engine supports simple fact-checking operations, evaluation of logic operations on them (e.g., anyOf, allOf) and Lua based scripting, which allows to express complex checks required by the CIS Critical Security Controls - all evaluated natively without external scripts. Scalable architecture for large fleets When the assignment is created, the Azure control plane instructs the machine to pull the latest Policy package via the Machine Configuration agent. kompli is integrated as a light-weight library to the package and called by Machine Configuration agent for evaluation – which happens every 15-30minutes. This ensures near real-time compliance state without overwhelming resources and enables consistent evaluation across thousands of VMs and Azure Arc-enabled servers. Future-ready for remediation and enforcement While the Public Preview starts with audit-only mode, the roadmap includes per-rule remediation and enforcement using technologies like eBPF for kernel-level controls. This will allow proactive prevention of configuration drift and runtime hardening at scale. Please reach out if you interested in auto-remediation or enforcement. Extensibility beyond CIS Benchmarks The architecture was designed to support other security and compliance standards as well and isn’t limited to CIS Benchmarks. The compliance engine is modular, and we plan to extend the platform with STIG and other relevant industry benchmarks. This positions Azure as a platform for a place where you can manage your compliance from a single control-plane without duplicating efforts elsewhere. Collaboration with the CIS This milestone reflects a close collaboration between Microsoft and the CIS to bring industry-standard security guidance into Azure as a built-in capability. Our shared goal is to make cloud-native compliance practical and consistent, while giving customers the flexibility to meet their unique requirements. We are committed to continuously supporting new Benchmark releases, expanding coverage with new distributions and easing adoption through built-in workflows, such as moving from your current Benchmark version to a new version while preserving your custom configurations. Certification and trust We can proudly announce that kompli has met all the requirements and is officially certified by the CIS for Benchmark assessment, so you can trust compliance results as authoritative. Minor benchmark updates will be applied automatically, while major version will be released separately. We will include workflows to help migrate customizations seamlessly across versions. Key Highlights Built-in CIS Benchmarks for Azure Endorsed Linux distributions Full parity with official CIS Benchmarks content and certified by the CIS for Benchmark Assessment Flexible configuration: adjust parameters, define exceptions, tune severity Hybrid support: enforce the same baseline across Azure, on-prem, and multi-cloud with Azure Arc Reporting format in CIS tooling style Supported use cases Certified CIS Benchmarks for all Azure Endorsed Distros - Audit only (L1/L2 server profiles) Hybrid / On-premises and other cloud machines with Azure Arc for the supported distros Compliance as Code (example via Github -> Azure OIDC auth and API integration) Compatible with GuestConfig workbook What’s next? Our next mission is to bring the previously announced auto-remediation capability into this experience, expand the distribution coverage and elevate our workflows even further. We’re focused on empowering you to resolve issues while honoring the unique operational complexity of your environments. Stay tuned! Get Started Documentation link for this capability Enable CIS Benchmarks in Machine Configuration and select the “Official Center for Internet Security (CIS) Benchmarks for Linux Workloads” then select the distributions for your assignment, and customize as needed. In case if you want any additional distribution supported or have any feedback for kompli – please open an Azure support case or a Github issue here Relevant Ignite 2025 session: Hybrid workload compliance from policy to practice on Azure Connect with us at Ignite Meet the Linux team and stop by the Linux on Azure booth to see these innovations in action: Session Type Session Code Session Name Date/Time (PST) Theatre THR 712 Hybrid workload compliance from policy to practice on Azure Tue, Nov 18/ 3:15 PM – 3:45 PM Breakout BRK 143 Optimizing performance, deployments, and security for Linux on Azure Thu, Nov 20/ 1:00 PM – 1:45 PM Breakout BRK 144 Build, modernize, and secure AKS workloads with Azure Linux Wed, Nov 19/ 1:30 PM – 2:15 PM Breakout BRK 104 From VMs and containers to AI apps with Azure Red Hat OpenShift Thu, Nov 20/ 8:30 AM – 9:15 AM Theatre THR 701 From Container to Node: Building Minimal-CVE Solutions with Azure Linux Wed, Nov 19/ 3:30 PM – 4:00 PM Lab Lab 505 Fast track your Linux and PostgreSQL migration with Azure Migrate Tue, Nov 18/ 4:30 PM – 5:45 PM PST Wed, Nov 19/ 3:45 PM – 5:00 PM PST Thu, Nov 20/ 9:00 AM – 10:15 AM PST1.7KViews0likes0CommentsNow Generally Available: Built-in CIS Benchmark Auditing for Linux on Azure
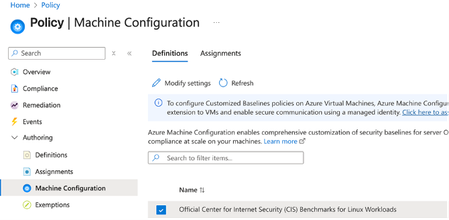
A few months ago, in From Policy to Practice: Built-in CIS Benchmarks on Azure – Flexible, Hybrid-Ready, we introduced a new way to bring Center for Internet Security (CIS) Benchmarks to your Linux estate using Azure Policy with Machine Configuration. It builds on the broader customizable security baseline policies in Machine Configuration capability. Today we're excited to share the next milestone: the audit capability for CIS Benchmarks on Linux is now Generally Available (GA). This release is officially powered by kompli - our native Linux compliance and hardening engine for CIS, STIG, and custom baselines. kompli is the evolution of the engine that drove the preview, now established as the dedicated home for this capability going forward. What "GA" means for you The audit experience is now ready for production use. You can continuously assess your Linux workloads against official, CIS-certified benchmarks - at scale, across Azure and hybrid environments through Azure Arc - and get clear, CIS-style compliance reporting directly in Azure Policy and Azure Resource Graph. If you've read the previous post, the how hasn't changed, so we'll keep this one short: Automated compliance assessment - continuously monitor Linux systems against official CIS benchmarks. Tailored benchmarks - customize evaluations with exceptions and custom parameters, no code changes required. Compliance reporting - detailed, CIS-style reports across your fleet. Hybrid-ready - the same baselines apply to Azure VMs and Arc-enabled servers on-premises or in other clouds. All supported benchmarks are CIS Benchmark Assessment Certified and stay in parity with the content published on the CIS website. Supported distributions and benchmark versions With this release, audit is GA across the following distributions, covering Level 1 + Level 2 Server profiles: Distribution CIS Benchmark Version(s) Profiles Audit Ubuntu 20.04 / 22.04 / 24.04 LTS + Pro v3.0.0 / v2.0.0 + v3.0.0 / v1.0.0 L1 + L2 Server ✓ Red Hat Enterprise Linux 8 / 9 / 10 v3.0.0 + v4.0.0 / v2.0.0 / v1.0.1 L1 + L2 Server ✓ AlmaLinux 8 / 9 v3.0.0 + v4.0.0 / v2.0.0 L1 + L2 Server ✓ Rocky Linux 8 / 9 v2.0.0 + v3.0.0 / v2.0.0 L1 + L2 Server ✓ Oracle Linux 8 / 9 v3.0.0 + v4.0.0 / v2.0.0 L1 + L2 Server ✓ Debian 11 / 12 v2.0.0 / v1.1.0 L1 + L2 Server ✓ SUSE Linux Enterprise 12 / 15 v3.2.1 / v2.0.1 L1 + L2 Server ✓ AKS Optimized Azure Linux 3 v1.0.0 L1 + L2 Server ✓ This GA covers the audit (assessment) capability. Looking ahead, STIG benchmarks are coming next, followed by a granular per-rule auto-remediation capability with dynamic scope assignments. You can run these benchmarks against your own hardened images, against CIS hardened images, and against custom images built on top of vanilla distros — as long as /etc/os-release retains its original content. We're also working with vendors to minimize deviations. Getting started Open Azure Policy in the Azure portal. Under Authoring, select the new Machine Configuration blade. Choose Official Center for Internet Security (CIS) Benchmarks for Linux Workloads, then Modify Settings to pick the distributions you want to assess. Full documentation, including per-distribution rule details, supported parameters, and any known deviations from the official CIS toolset, is available here: Overview: CIS Security Benchmarks for Linux Workloads Per-distribution references: AlmaLinux, Azure Linux, Debian, Oracle Linux, Red Hat Enterprise Linux, Rocky Linux, SUSE Linux Enterprise, and Ubuntu - all linked from the overview page. We're building this with you As part of this GA release, we've also expanded the set of exposed rule parameters compared to the preview - giving you more out-of-the-box customization across rules and distributions. That said, our customer-driven approach still stands: we keep the experience clean by enabling parameters based on real demand, so if there's a rule, benchmark version, or distribution you'd like parameters enabled for - or any feedback on rules, evaluations, or distro coverage - let us know: Open a GitHub issue in the kompli repository Open an Azure support case Try it out, tell us what you think, and help shape what we build next.551Views1like0CommentsIntroducing kars - an Agent Reference Stack for Kubernetes
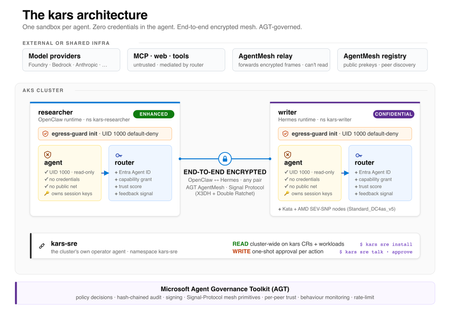
kars is an open-source, Kubernetes-native runtime for AI agents on Azure. It treats every agent as untrusted code - per-pod kernel isolation, zero credentials in the agent process, and an end-to-end encrypted inter-agent mesh - and governs agents on any framework with one set of Kubernetes policies via the Microsoft Agent Governance Toolkit. kars dev runs a governed agent on your laptop in minutes.2.7KViews1like2CommentsFour open source projects to explore at Microsoft Build
Open source is where developers experiment, collaborate, and turn new ideas into tools that others can build on. At Microsoft Build, we’re creating a dedicated space for that energy: the Open Source Zone. This year, the Open Source Zone will bring together maintainers, contributors, and developers working on some of the most interesting open source projects in AI. Whether you’re building agents, experimenting with local models, exploring prompt workflows, or looking for practical ways to bring AI into your development process, this is a place to meet the people behind the projects and see what they’re building. The Open Source Zone is inspired by similar community spaces we’ve hosted at GitHub Universe: hands-on, conversation-driven, and centered on the people and projects moving open source forward. Meet the projects OpenClaw OpenClaw, originally Clawbot, formerly Clawdbot and briefly Moltbot,before landing on its current name (because naming is hard), is a personal AI assistant project built for developers who want more control over how AI agents run across tools, devices, and workflows. Its repository describes it as “your own personal AI assistant” across operating systems and platforms, with support for agent workspaces, skills, and device nodes. It has also become one of the fastest-growing open source projects on GitHub, with over 370,000 stars to date. At the Open Source Zone, attendees can learn how OpenClaw approaches personal agents, extensibility, and local-first experimentation. AutoGPT AutoGPT is one of the best-known open source projects in the autonomous agent space. The project’s mission is to make AI accessible for everyone to use and build on, with tools for building, testing, and delegating work to agents. Visit AutoGPT in the Open Source Zone to learn how the project is evolving agent development, benchmarking, frontend experiences, and practical workflows for building agent-powered applications. Come for the autonomous agents; stay for the very human maintainers. AutoGPT is also a member of GitHub’s Secure Open Source Fund, with a goal of enhancing AI security across the open source ecosystem. Open WebUI Open WebUI is a self-hosted, extensible AI platform for working with large language models. The project supports Ollama and OpenAI-compatible APIs and includes built-in RAG capabilities, making it a strong option for developers and organizations exploring local, private, or provider-flexible AI experiences. At Build, the Open WebUI team will show how developers can run, customize, and extend AI interfaces for their own environments. prompts.chat prompts.chat, formerly Awesome ChatGPT Prompts, is a curated collection of prompt examples for AI chat models. The project is designed to help people discover, share, and build better prompts for modern AI assistants. Created by Fatih Kadir Akın, a GitHub Star from Istanbul, prompts.chat reflects his work at the intersection of open source, developer education, and AI-assisted development. Fatih leads Developer Relations at Teknasyon, has authored books on JavaScript and prompt engineering, and is active in the community as a speaker, organizer, and contributor. Stop by to explore prompt libraries, prompt engineering resources, self-hosting options, and ways the community is making prompting more reusable and collaborative. Register for Microsoft Build Microsoft Build takes place June 2–3, 2026, in San Francisco and online. In-person passes are available, and online registration is free for livestreamed keynote and select session access. Register for Microsoft Build and come visit the Open Source Zone to meet the teams behind OpenClaw, AutoGPT, Open WebUI, and prompts.chat. We’ll see you there. <3949Views0likes0CommentsInspektor Gadget Completes Its First Independent Security Audit
Inspektor Gadget, the CNCF eBPF tool for Kubernetes and Linux observability, has completed its first independent security audit, conducted by Shielder and coordinated by OSTIF and CNCF. The audit found two Medium and one Low-severity issue, now patched in release v0.50.1. Learn what the auditors discovered, the hardening recommendations the maintainers are acting on, and why this milestone matters for the open source community.333Views0likes0Comments
Metrics Filtering and Log Aggregation Now GA for Advanced Container Networking Services
We are thrilled to announce that Advanced Container Networking Services (ACNS) for Azure Kubernetes Service (AKS) now delivers two powerful observability features in General Availability: container network metrics filtering and container network log filtering and aggregation. Together, these capabilities set a new standard for Kubernetes network observability, giving you high-fidelity visibility at dramatically lower cost and noise. These capabilities fundamentally redefine how network observability works at scale while delivering up to 97% cost reduction. Why this is a Milestone? Most Kubernetes observability solutions face a fundamental tension: collect everything and drown in noise and cost, or sample and miss the signals that matter, with new features of Advanced Container Networking Services that tradeoff has been eliminated. With this release, Azure becomes the first cloud provider to deliver on-node metrics filtering and flow log aggregation for Kubernetes networking, capabilities now also contributed to the upstream Hubble project, making them available to the broader open-source community. For AKS customers running Cilium-based clusters, this means: Every flow you care about is captured. Everything else is dropped at the source. Log volume is compressed by up to 45% through aggregation, without losing security verdicts or error context. Costs scale with what you monitor, not with cluster size. What’s been improved in observability? This release introduces two capabilities that work together: container network metrics filtering and container network log filtering and aggregation. Both are available on AKS clusters with the Cilium data plane and give you precise controls to keep observability costs predictable while maintaining the visibility you need. Container Network Metrics Filtering Container network metrics are generated for all pods by default whenever Advanced Container Networking Services is enabled. With metrics filtering, you now control what gets collected at the point of ingestion, on the node, before anything is scraped or transmitted. A single ContainerNetworkMetric CRD per cluster defines which metric types (dns, flow, tcp, drop), namespaces, pod labels, and protocols to ingest. It supports both include and exclude filters, so you can maintain broad collection while carving out specific workloads or namespaces. Anything that doesn't match is dropped on the node. Changes reconcile in a few seconds, with no Cilium agent or Prometheus restarts required. Container Network Log Filtering and Aggregation Unlike metrics, container network logs are not generated automatically. You start capturing network flows only after applying a ContainerNetworkLog CRD that defines exactly which traffic to capture-by namespace, pod, service, protocol, or verdict. Only matching flows are logged, giving you a precise, targeted view rather than a fire hose. This is where Azure's first-to-market innovation comes in. Flow log aggregation, now built into Advanced Container Networking Services and contributed upstream to Hubble for the open-source community, groups similar flows into summarized records every 30 seconds. The result is dramatically reduced data volume while preserving security verdicts, service identity, and error context. What previously required custom post-processing pipelines is now built directly into the platform before storage costs are incurred. Every matched flow log captures: source and destination pods, namespaces, ports, protocols, traffic direction, and policy verdicts. Logs are stored in a Log Analytics workspace (ContainerNetworkLogs table) with a choice of using the Analytics or Basic tier. Built-in Azure portal dashboards are available for both tiers. Logs can also be exported to external log collectors such as Splunk or Datadog. First to Market: Azure and the upstream Hubble Contribution Advanced Container Networking Services built-in filtering and aggregation capabilities were engineered from the ground up to solve real production observability challenges at scale. Rather than keeping this innovation proprietary, Azure contributed the log aggregation and filtering capabilities to the upstream Hubble project, the observability layer of the Cilium ecosystem. This means: AKS customers get a fully managed, Azure-native experience with portal dashboards, Log Analytics integration, and Grafana visualization, out of the box. The broader open-source community gains access to the same filtering and aggregation primitives through upstream Hubble. Azure is the first to ship this capability in a managed Kubernetes service, and the first to give it back to the community. Key Benefits 💰 Lower observability cost. Metrics filtering drops unwanted data on the node before Prometheus ever scrapes it. Flow log aggregation compresses log data by up to 97% in lab testing. Your cost scales with what you choose to monitor, not with cluster size. 📉 Less noise, more signal. Metrics filtering carves out the namespaces and workloads that matter, so dashboards show only relevant signals. Log filters scope collection to specific pods and verdicts. Engineers start every investigation with data that's already relevant. ⚡ Faster root-cause isolation. Every metric carries source and destination pod context. Targeted flow logs add the forensic detail, which policy, destination, or port is involved. Together, they cut mean time to resolution from hours of guesswork to minutes of structured investigation. 🔒 Full signal, zero gaps. Within the scope you define, every flow is captured and every pattern is preserved. Aggregation compresses volume without losing security verdicts or error context. Who Benefits Platform engineers managing multi-tenant clusters can scope data collection per namespace, so each team gets visibility into their own traffic without contributing to a shared cost pool. SREs can isolate packet drops, TCP resets, or DNS failures to a specific workload in minutes, starting with data that's already scoped to what matters. Decision-makers evaluating observability spend get predictable, controllable ingestion costs that scale with intent, not infrastructure size. How to optimize metrics and logs with filtering? Enable Advanced Container Networking Services ( ACNS) on your AKS cluster with the Cilium data plane: az aks create --enable-acns Or on an existing cluster: az aks update --resource-group $RESOURCE_GROUP --name $CLUSTER --enable-acns Apply a ContainerNetworkMetric CRD to filter which metrics are collected on each node. Start by excluding noisy system namespaces, then scope to business-critical workloads. Apply a ContainerNetworkLog CRD to define which flows to capture. Enable Azure Monitor integration with --enable-container-network-logs to send logs to a Log Analytics workspace, or export logs from the node to an external logging system such as Splunk or Datadog. Check your dashboards. Open your cluster in the Azure portal and go to Monitor > Insights > Networking for bytes, drops, DNS errors, and flows. For flow logs, use the built-in Azure portal dashboards available for both Basic and Analytics tiers. Conclusion Kubernetes network observability has long meant choosing between visibility and cost. With container network metrics filtering and log filtering and aggregation now GA in Advanced Container Networking Services (ACNS) and contributed to upstream Hubble for the open-source community, that tradeoff is gone. Azure is first to market with this capability. AKS customers get it fully managed, out of the box, with built-in dashboards with Log Analytics integration. And the broader Cilium ecosystem gets it through upstream Hubble. High-fidelity visibility. Lower cost. No compromise. Learn more: Container network metrics overview: Container network metrics overview - Azure Kubernetes Service | Microsoft Learn Container network logs overview: Container Network Logs Overview - Azure Kubernetes Service | Microsoft Learn Configure container network metrics filtering: Configure Container network metrics filtering for Azure Kubernetes Service (AKS) - Azure Kubernetes Service | Microsoft Learn Set up container network logs: Set up container network logs - Azure Kubernetes Service | Microsoft Learn 576Views0likes0Comments
Project Pavilion Presence at KubeCon EU 2026
KubeCon + CloudNativeCon Europe 2026 took place from 23 to 26 March at RAI Amsterdam, and it was a strong one. The themes running through the week reflected where the cloud native community is right now: AI moving from experimentation into production, platform engineering continuing to mature, and security and sovereignty top of mind for organizations across Europe. Microsoft was there throughout, and once again supported a range of open source projects in the Project Pavilion. The Project Pavilion is a dedicated, vendor-neutral space on the show floor reserved for CNCF projects. It is where the work gets talked about honestly. Maintainers and contributors meet directly with end users, share what they are building, get real feedback on what is and is not working, and have the kinds of technical conversations that are hard to have anywhere else. For open source communities, it is one of the most valuable parts of the event. Why Our Presence Matters Microsoft's products and services are built on and alongside many of the technologies represented in the pavilion, and the health of these communities matters to us directly. Showing up means our teams hear firsthand what is working, what is missing, and where these projects need to go next. It also means we get to contribute as community members, not just as a company name on a sponsor board. That distinction matters to us, and to the communities we are part of. Microsoft-Supported Pavilion Projects Confidential Containers Representative: Jeremi Piotrowski The Confidential Containers booth gave attendees a chance to learn more about the project and its approach to protecting workloads using hardware-based trusted execution environments. Jeremi was on hand throughout the kiosk hours, fielding questions from interested users and developers exploring confidential computing in Kubernetes environments. Conversations touched on use cases around data privacy, regulated workloads, and the role Confidential Containers plays in the broader cloud-native security landscape. Drasi Representative: Daniel Gerlag and Nandita Valsan The Drasi team had a busy time in the pavilion, engaging around 40 attendees across two kiosk shifts in focused technical conversations. Most visitors were developers and platform engineers curious about change-driven architectures and real-time data processing. There was strong positive feedback on the newly introduced Drasi Server modes and embeddable library, which complement Drasi for Kubernetes. The team came away with useful validation of current design decisions and good input for the roadmap ahead. Envoy Representative: Mikhail Krinkin The Envoy booth was staffed for the full duration of KubeCon EU by maintainers from Microsoft, Google, Isovalent, and Tetrate, reflecting the broad and healthy contributor base behind the project. The biggest topic at the booth was migration from ingress-nginx to Gateway API implementations. The archival of ingress-nginx pushed a lot of users into making changes they were not quite ready for, and questions ranged from technical specifics like HTTP default differences between Envoy and Nginx, to more foundational questions about what Envoy and Gateway API actually are. The team had anticipated this and invested in the ingress2gateway project to give users a clear migration path. Extensibility was another frequent conversation topic, with dynamic modules increasingly becoming the go-to answer for user-specific requirements. Starting with the 1.38 release of Envoy, dynamic modules will have a backward compatible ABI, a sign of real production readiness for that feature. Flatcar Representative: Thilo Fromm and Mathieu Tortuyaux The Flatcar booth had great energy, with maintainers from Microsoft, STACKIT, and CloudBase joining for conversations throughout the pavilion hours. Operational sovereignty came up again and again as a theme, with users and consulting partners sharing how they are building their Kubernetes offerings on Flatcar because of how reliable and secure it is. There were a lot of meaningful conversations. Lambda.ai currently runs Flatcar on their control plane and is looking at extending it to worker and customer clusters, with interest in contributing to the project. ReeVo has built their hosted Kubernetes distro on Flatcar across multi-cloud and bare metal environments and is planning to move hundreds of customer clusters over soon. Users from ClearScore, Avassa, Recorded Future, and several other organizations also stopped by with positive feedback on the project's robustness and security. STACKIT uses Flatcar as the default OS for their hosted Kubernetes offering and sponsors a full-time maintainer for the project. The team also connected with TAG Infrastructure to talk through Flatcar's CNCF graduation progress. Headlamp Representatives: René Dudfield and Santhosh Nagaraj S The Headlamp booth was a busy one, with users, contributors, and partner projects all stopping by throughout the pavilion hours. Conversations covered real-world deployments, federation challenges, multi-tenant namespace visibility, and feature requests like multi-CR data aggregation. There was notable interest from consultancies deploying Headlamp across hundreds of customer clusters, as well as from companies already running it at cloud scale. Several CNCF projects expressed interest in building UIs for their own projects inside Headlamp, with a few even getting started right there at the conference. The team also heard from users getting budget approved to migrate from the deprecated Kubernetes Dashboard, which is a good sign for the project's growing momentum. Demand for air-gapped AI agent support and deeper Azure and AKS integrations for internal developer platforms came up as clear areas to watch. Hyperlight Representative: Ralph Squillace The Hyperlight booth ran as a half-day session on Tuesday, in line with the project's current Sandbox status, but the corner location in the project area made a real difference in visibility. Ralph was fielding questions from the moment the doors opened, with a steady stream of visitors right up until the shift ended. Live and recorded demos were central to the conversations, helping attendees quickly grasp what Hyperlight does and how it fits into their environments. One standout visit came from an engineer at SAP who spent nearly an hour at the booth, pushing the conversation from fundamentals and embedding examples all the way through to agentic protection scenarios in Kubernetes. That conversation continued beyond KubeCon and turned into a scheduled meeting to explore a proof of concept, a good example of the kind of follow-on engagement the pavilion can generate. Inspektor Gadget Representative: Michael Friese and Qasim Sarfraz The Inspektor Gadget booth had a lot of great energy, drawing in contributors, new users, and people just discovering the project for the first time. There was genuine excitement around Inspektor Gadget Desktop and its visual troubleshooting experience for Kubernetes and Linux environments. The integration with HolmesGPT, which was also featured in the keynote, came up frequently and was one of the main talking points throughout the event. A theme that surfaced consistently in conversations with platform engineers was multi-tenancy, with teams looking for ways to safely give developers ad-hoc access to troubleshoot issues independently while keeping overall control at the platform level. It was a good set of conversations that reflected both the project's maturity and the growing demand for a flexible observability framework. Istio Representative: Mitch Connors, Mikhail Krinkin, Jackie Maertens and Mike Morris The Istio booth had steady traffic throughout the conference, with a noticeable shift in who was stopping by. More visitors came from teams with existing sidecar-based production deployments looking for guidance on moving to ambient mode, which is a change from previous years when ambient interest was mostly coming from greenfield users. The motivation to make the move was often tied to cost optimization and performance, with teams having read case studies and feeling more confident about the direction. That said, the increased interest also surfaced some real gaps, including requests for clearer migration guidance, more clarity around architectural differences like mTLS egress workflows, and better support for VM-based workloads. The team is planning to prioritize migration guidance over the coming months. The updated Istio Day format, with a half day of sessions at the Cloud Native Theater stage, also drew a strong crowd with standing room only throughout. Notary Project Representative: Toddy Mladenov and Flora Taagen The Notary Project kiosk drew a wide range of visitors, from people learning about container image signing for the first time to experienced engineers asking detailed questions about what is coming next on the roadmap. A major highlight of the week was the project's conference talk on per-layer dm-verity signing, which drew a packed room and over 660 online sign-ups, one of the stronger turnouts for a project-level session at the event. The talk walked through how the new capability moves container security beyond pull-time verification to continuous runtime protection, backed by dm-verity, which generated a lengthy Q&A and a lot of enthusiasm from the audience. The team also sees a real opportunity ahead as AI workloads push organizations to think harder about the integrity of models, datasets, and container images, and the interest at the booth reinforced that Notary Project is well positioned to play a big role in securing those workflows. ORAS Representative: Toddy Mladenov The ORAS kiosk was staffed by maintainers from Microsoft, NVIDIA, and Red Hat, a good reflection of the healthy multi-vendor community the project has built. Attendees engaged with maintainers on ORAS use cases and adoption, with conversations ranging from how artifacts are tagged and packaged to how ORAS fits into broader multi-cloud workflows. One practical takeaway from maintainer conversations was around leveraging the ORAS SDK more often as a substitute for CLI operations when working with container registries, which helps teams build simpler and more robust tooling. Radius Representative: Sylvain Niles and Will Tsai The Radius booth, supported by the Microsoft Azure Incubations team, attracted a good mix of enterprise platform teams, prospective adopters, and fellow open source maintainers throughout the pavilion hours. There was strong interest in the extensible Radius Resource Types feature and how it helps teams abstract infrastructure complexity and move workloads across different environments. Conversations also surfaced useful feedback on where the project should focus next, including agent-driven infrastructure workflows and using the Radius application graph to improve observability and operational visibility for cloud-native applications. Conclusion KubeCon EU 2026 was a good reminder of why this community continues to grow. The conversations in the Project Pavilion were substantive, the feedback was honest, and the connections made there will carry forward into the work. Microsoft will be back for KubeCon NA in Salt Lake City this November, and we are already looking forward to it. If you are interested in getting involved with any of these projects, the best starting point is each project's community directly. You are also welcome to reach out to Lexi Nadolski at lexinadolski@microsoft.com with any questions.137Views0likes0CommentsAnnouncing public preview: Cilium mTLS encryption for Azure Kubernetes Service
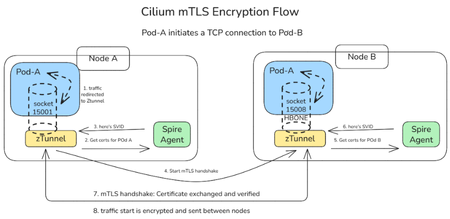
We are thrilled to announce the public preview of Cilium mTLS encryption in Azure Kubernetes Service (AKS), delivered as part of Advanced Container Networking Services and powered by the Azure CNI dataplane built on Cilium. This capability is the result of a close engineering collaboration between Microsoft and Isovalent (now part of Cisco). It brings transparent, workload‑level mutual TLS (mTLS) to AKS without sidecars, without application changes, and without introducing a separate service mesh stack. This public preview represents a major step forward in delivering secure, high‑performance, and operationally simple networking for AKS customers. In this post, we’ll walk through how Cilium mTLS works, when to use it, and how to get started. Why Cilium mTLS encryption matters Traditionally, teams looking to in-transit traffic encryption in Kubernetes have had two primary options: Node-level encryption (for example, WireGuard or virtual network encryption), which secures traffic in transit but lacks workload identity and authentication. Service meshes, which provide strong identity and mTLS guarantees but introduce operational complexity. This trade‑off has become increasingly problematic, as many teams want workload‑level encryption and authentication, but without the cost, overhead, and architectural impact of deploying and operating a full-service mesh. Cilium mTLS closes this gap directly in the dataplane. It delivers transparent, inline mTLS encryption and authentication for pod‑to‑pod TCP traffic, enforced below the application layer. And implemented natively in the Azure CNI dataplane built on Cilium, so customers gain workload‑level security without introducing a separate service mesh, resulting in a simpler architecture with lower operational overhead. To see how this works under the hood, the next section breaks down the Cilium mTLS architecture and follows a pod‑to‑pod TCP flow from interception to authentication and encryption. Architecture and design: How Cilium mTLS works Cilium mTLS achieves workload‑level authentication and encryption by combining three key components, each responsible for a specific part of the authentication and encryption lifecycle. Cilium agent: Transparent traffic interception and wiring Cilium agent which already exists on any cluster running with Azure CNI powered by cilium, is responsible for making mTLS invisible to applications. When a namespace is labelled with “io.cilium/mtls-enabled=true”, The Cilium agent enrolls all pods in that namespace. It enters each pod's network namespace and installs iptables rules that redirect outbound traffic to ztunnel on port 15001. It is also responsible for passing workload metadata (such as pod IP and namespace context) to ztunnel. Ztunnel: Node‑level mTLS enforcement Ztunnel is an open source, lightweight, node‑level Layer 4 proxy that was originally created by Istio. Ztunnel runs as a DaemonSet, on the source node it looks up the destination workload via XDS (streamed from the Cilium agent) and establishes mutually authenticated TLS 1.3 sessions between source and destination nodes. Connections are held inline until authentication is complete, ensuring that traffic is never sent in plaintext. The destination ztunnel decrypts the traffic and delivers it into the target pod, bypassing the interception rules via an in-pod mark. The application sees a normal plaintext connection — it is completely unaware encryption happened. SPIRE: Workload identity and trust SPIRE (SPIFFE Runtime Environment) provides the identity foundation for Cilium mTLS. SPIRE acts as the cluster Certificate Authority, issuing short‑lived X.509 certificates (SVIDs) that are automatically rotated and validated. This is a key design principle of Cilium mTLS - trust is based on workload identity, not network topology. Each workload receives a cryptographic identity derived from: Kubernetes namespace Kubernetes ServiceAccount These identities are issued and rotated automatically by SPIRE and validated on both sides of every connection. As a result: Identity remains stable across pod restarts and rescheduling Authentication is decoupled from IP addresses Trust decisions align naturally with Kubernetes RBAC and namespace boundaries This enables a zero‑trust networking model that fits cleanly into existing AKS security practices. End‑to‑End workflow example To see how these components work together, consider a simple pod‑to‑pod connection: A pod initiates a TCP connection to another pod. Traffic intercepted inside the pod network namespace and redirected to the local ztunnel instance. ztunnel retrieves the workload identity using certificates issued by SPIRE. ztunnel establishes a mutually authenticated TLS session with the destination node’s ztunnel. Traffic is encrypted and sent between pods. The destination ztunnel decrypts the traffic and delivers it to the target pod. Every packet from an enrolled pod is encrypted. There is no plaintext window, and no dropped first packets. The connection is held inline by ztunnel until the mTLS tunnel is established, then traffic flows bidirectionally through an HBONE (HTTP/2 CONNECT) tunnel. Workload enrolment and scope Cilium mTLS in AKS is opt‑in and scoped at the namespace level. Platform teams enable mTLS by applying a single label to a namespace. From that point on: All pods in that namespace participate in mTLS Authentication and encryption are mandatory between enrolled workloads Non-enrolled namespaces continue to operate unchanged Encryption is applied only when both pods are enrolled. Traffic between enrolled and non‑enrolled workloads continues in plaintext without causing connectivity issues or hard failures. This model enables gradual rollout, staged migrations, and low-risk adoption across environments. Getting started in AKS Cilium mTLS encryption is available in public preview for AKS clusters that use: Azure CNI powered by Cilium Advanced Container Networking Services You can enable mTLS: When creating a new cluster, or On an existing cluster by updating the Advanced Container Networking Services configuration Once enabled, enrolling workloads is as simple as labelling a namespace. 👉 Learn more Concepts: How Cilium mTLS works, architecture, and trust boundaries How-to guide: Step-by-step instructions to enable and verify mTLS in AKS Looking ahead This public preview represents an important step forward in simplifying network security for AKS and reflects a deep collaboration between Microsoft and Isovalent to bring open, standards‑based innovation into production‑ready cloud platforms. We’re continuing to work closely with the community to improve the feature and move it toward general availability. If you’re looking for workload‑level encryption without the overhead of a traditional service mesh, we invite you to try Cilium mTLS in AKS and share your experience.1.8KViews3likes0CommentsScaling DNS on AKS with Cilium: NodeLocal DNSCache, LRP, and FQDN Policies
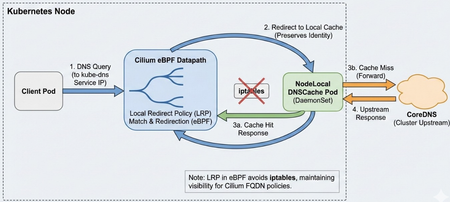
Why Adopt NodeLocal DNSCache? The primary drivers for adoption are usually: Eliminating Conntrack Pressure: In high-QPS UDP DNS scenarios, conntrack contention and UDP tracking can cause intermittent DNS response loss and retries; depending on resolver retry/timeouts, this can appear as multi-second lookup delays and sometimes much longer tails. Reducing Latency: By placing a cache on every node, you remove the network hop to the CoreDNS service. Responses are practically instantaneous for cached records. Offloading CoreDNS: A DaemonSet architecture effectively shards the DNS query load across the entire cluster, preventing the central CoreDNS deployment from becoming a single point of congestion during bursty scaling events. Who needs this? You should prioritize this architecture if you run: Large-scale clusters large clusters (hundreds of nodes or thousands of pods), where CoreDNS scaling becomes difficult to manage. High-churn endpoints, such as spot instances or frequent auto-scaling jobs that trigger massive waves of DNS queries. Real-time applications where multi-second (and occasionally longer) DNS lookup delays are unacceptable. The Challenge with Cilium Deploying NodeLocal DNSCache on a cluster managed by Cilium (CNI) requires a specific approach. Standard NodeLocal DNSCache relies on node-level interface/iptables setup. In Cilium environments, you can instead implement the interception via Cilium Local Redirect Policy (LRP), which redirects traffic destined to the kube-dns ClusterIP service to a node-local backend pod. This post details a production-ready deployment strategy aligned with Cilium’s Local Redirect Policy model. It covers necessary configuration tweaks to avoid conflicts and explains how to maintain security filtering. Architecture Overview In a standard Kubernetes deployment, NodeLocal DNSCache creates a dummy network interface and uses extensive iptables rules to hijack traffic destined for the Cluster DNS IP. When using Cilium, we can achieve this more elegantly and efficiently using Local Redirect Policies. DaemonSet: Runs node-local-dns on every node. Configuration: Configured to skip interface creation and iptables manipulation. Redirection: Cilium LRP intercepts traffic to the kube-dns Service IP and redirects it to the local pod on the same node. 1. The NodeLocal DNSCache DaemonSet The critical difference in this manifest is the arguments passed to the node-local-dns binary. We must explicitly disable its networking setup functions to let Cilium handle the traffic. The NodeLocal DNSCache deployment also requires the node-local-dns ConfigMap and the kube-dns-upstream Service (plus RBAC/ServiceAccount). For brevity, the snippet below shows only the DaemonSet arguments that differ in the Cilium/LRP approach. The node-cache reads the template Corefile (/etc/coredns/Corefile.base) and generates the active Corefile (/etc/Corefile). The -conf flag points CoreDNS at the active Corefile it should load. The node-cache binary accepts -localip as an IP list; 0.0.0.0 is a valid value and makes it listen on all interfaces, appropriate for the LRP-based redirection model. apiVersion: apps/v1 kind: DaemonSet metadata: name: node-local-dns namespace: kube-system labels: k8s-app: node-local-dns spec: selector: matchLabels: k8s-app: node-local-dns template: metadata: labels: k8s-app: node-local-dns annotations: # Optional: policy.cilium.io/no-track-port can be used to bypass conntrack for DNS. # Validate the impact on your Cilium version and your observability/troubleshooting needs. policy.cilium.io/no-track-port: "53" spec: # IMPORTANT for the "LRP + listen broadly" approach: # keep hostNetwork off so you don't hijack node-wide :53 hostNetwork: false # Don't use cluster DNS dnsPolicy: Default containers: - name: node-cache image: registry.k8s.io/dns/k8s-dns-node-cache:1.15.16 args: - "-localip" # Use a bind-all approach. Ensure server blocks bind broadly in your Corefile. - "0.0.0.0" - "-conf" - "/etc/Corefile" - "-upstreamsvc" - "kube-dns-upstream" # CRITICAL: Disable internal setup - "-skipteardown=true" - "-setupinterface=false" - "-setupiptables=false" ports: - containerPort: 53 name: dns protocol: UDP - containerPort: 53 name: dns-tcp protocol: TCP # Ensure your Corefile includes health :8080 so the liveness probe works livenessProbe: httpGet: path: /health port: 8080 initialDelaySeconds: 60 timeoutSeconds: 5 volumeMounts: - name: config-volume mountPath: /etc/coredns - name: kube-dns-config mountPath: /etc/kube-dns volumes: - name: kube-dns-config configMap: name: kube-dns optional: true - name: config-volume configMap: name: node-local-dns items: - key: Corefile path: Corefile.base 2. The Cilium Local Redirect Policy (LRP) Instead of iptables, we define a CRD that tells Cilium: "When you see traffic for `kube-dns`, send it to the `node-local-dns` pod on this same node." apiVersion: "cilium.io/v2" kind: CiliumLocalRedirectPolicy metadata: name: "nodelocaldns" namespace: kube-system spec: redirectFrontend: # ServiceMatcher mode is for ClusterIP services serviceMatcher: serviceName: kube-dns namespace: kube-system redirectBackend: # The backend pods selected by localEndpointSelector must be in the same namespace as the LRP localEndpointSelector: matchLabels: k8s-app: node-local-dns toPorts: - port: "53" name: dns protocol: UDP - port: "53" name: dns-tcp protocol: TCP This is an LRP-based NodeLocal DNSCache deployment: we disable node-cache’s iptables/interface setup and let Cilium LRP handle local redirection. This differs from the upstream NodeLocal DNSCache manifest, which uses hostNetwork + dummy interface + iptables. LRP must be enabled in Cilium (e.g., localRedirectPolicies.enabled=true) before applying the CRD. Official Cilium LRP doc DNS-Based FQDN Policy Enforcement Flow The diagram below illustrates how Cilium enforces FQDN-based egress policies using DNS observation and datapath programming. During the DNS resolution phase, queries are redirected to NodeLocal DNS (or CoreDNS), where responses are observed and used to populate Cilium’s FQDN-to-IP cache. Cilium then programs these mappings into eBPF maps in the datapath. In the connection phase, when the client initiates an HTTPS connection to the resolved IP, the datapath checks the IP against the learned FQDN map and applies the policy decision before allowing or denying the connection. The Network Policy "Gotcha" If you use CiliumNetworkPolicy to restrict egress traffic, specifically for FQDN filtering, you typically allow access to CoreDNS like this: - toEndpoints: - matchLabels: k8s:io.kubernetes.pod.namespace: kube-system k8s:k8s-app: kube-dns toPorts: - ports: - port: "53" protocol: ANY This will break with local redirection. Why? Because LRP redirects the DNS request to the node-local-dns backend endpoint; strict egress policies must therefore allow both kube-dns (upstream) and node-local-dns (the redirected destination). The Repro Setup To demonstrate this failure, the cluster is configured with: NodeLocal DNSCache: Deployed as a DaemonSet (node-local-dns) to cache DNS requests locally on every node. Local Redirect Policy (LRP): An active LRP intercepts traffic destined for the kube-dns Service IP and redirects it to the local node-local-dns pod. Incomplete Network Policy: A strict CiliumNetworkPolicy (CNP) is enforced on the client pod. While it explicitly allows egress to kube-dns, it misses the corresponding rule for node-local-dns. Reveal the issue using Hubble: In this scenario, the client pod dns-client is attempting to resolve the external domain github.com. When inspecting the traffic flows, you will see EGRESS DENIED verdicts. Crucially, notice the destination pod in the logs below: kube-system/node-local-dns, not kube-dns. Although the application originally sent the packet to the Cluster IP of CoreDNS, Cilium's Local Redirect Policy modified the destination to the local node cache. Since strictly defined Network Policies assume traffic is going to the kube-dns identity, this redirected traffic falls outside the allowed rules and is dropped by the default deny stance. The Fix: You must allow egress to both labels. - toEndpoints: - matchLabels: k8s:io.kubernetes.pod.namespace: kube-system k8s:k8s-app: kube-dns # Add this selector for the local cache - matchLabels: k8s:io.kubernetes.pod.namespace: kube-system k8s:k8s-app: node-local-dns toPorts: - ports: - port: "53" protocol: ANY Without this addition, pods protected by strict egress policies will timeout resolving DNS, even though the cache is running. Use Hubble to observe the network flows: After adding matchLabels: k8s:k8s-app: node-local-dns, the traffic is now allowed. Hubble confirms a policy verdict of EGRESS ALLOWED for UDP traffic on port 53. Because DNS resolution now succeeds, the response populates the Cilium FQDN cache, subsequently allowing the TCP traffic to github.com on port 443 as intended. Real-World Example: Restricting Egress with FQDN Policies Here is a complete CiliumNetworkPolicy that locks down a workload to only access api.example.com. Note how the DNS rule explicitly allows traffic to both kube-dns (for upstream) and node-local-dns (for the local cache). apiVersion: "cilium.io/v2" kind: CiliumNetworkPolicy metadata: name: secure-workload-policy spec: endpointSelector: matchLabels: app: critical-workload egress: # 1. Allow DNS Resolution (REQUIRED for FQDN policies) - toEndpoints: - matchLabels: k8s:io.kubernetes.pod.namespace: kube-system k8s:k8s-app: kube-dns # Allow traffic to the local cache redirection target - matchLabels: k8s:io.kubernetes.pod.namespace: kube-system k8s:k8s-app: node-local-dns toPorts: - ports: - port: "53" protocol: ANY rules: dns: - matchPattern: "*" # 2. Allow specific FQDN traffic (populated via DNS lookups) - toFQDNs: - matchName: "api.example.com" toPorts: - ports: - port: "443" protocol: TCP Configuration & Upstream Loops When configuring the ConfigMap for node-local-dns, use the standard placeholders provided by the image. The binary replaces them at runtime: __PILLAR__CLUSTER__DNS__: The Upstream Service IP (kube-dns-upstream). __PILLAR__UPSTREAM__SERVERS__: The system resolvers (usually /etc/resolv.conf). Ensure kube-dns-upstream exists as a Service selecting the CoreDNS pods so cache misses are forwarded to the actual CoreDNS backends. Alternative: AKS LocalDNS LocalDNS is an Azure Kubernetes Services (AKS)-managed node-local DNS proxy/cache. Pros: Managed lifecycle at the node pool level. Support for custom configuration via localdnsconfig.json (e.g., custom server blocks, cache tuning). No manual DaemonSet management required. Cons & Limitations: Incompatibility with FQDN Policies: As noted in the official documentation, LocalDNS isn’t compatible with applied FQDN filter policies in ACNS/Cilium; if you rely on FQDN enforcement, prefer a DNS path that preserves FQDN learning/enforcement. Updating configuration requires reimaging the node pool. For environments heavily relying on strict Cilium Network Policies and FQDN filtering, the manual deployment method described above (using LRP) can be more reliable and transparent. AKS recommends not enabling both upstream NodeLocal DNSCache and LocalDNS in the same node pool, as DNS traffic is routed through LocalDNS and results may be unexpected. References Kubernetes Documentation: NodeLocal DNSCache Cilium Documentation: Local Redirect Policy AKS Documentation: Configure LocalDNS1.3KViews3likes2Comments