devops
427 TopicsVirtual nodes on Azure Container Instances: a new compute layer for AKS
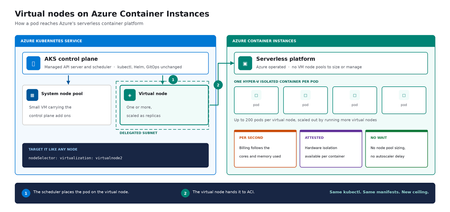
Meet virtual nodes on ACI Azure Kubernetes Service (AKS) gives you managed Kubernetes: the full Kubernetes API without operating the control plane yourself. Virtual nodes on Azure Container Instances go a step further, letting your pods run directly on Azure's serverless container platform, with the elasticity and with no capacity planning and no waiting for machines. Whether you already run AKS or want a managed Kubernetes that bursts without node management, this is for you. In short: virtual nodes on ACI attach Azure's serverless container platform to your cluster as Kubernetes nodes. Pods run as Hyper-V isolated containers, sized per pod rather than packed onto a fixed VM, up to 200 pods per virtual node. Run multiple virtual nodes, scaled as replicas, for more. They behave like any other pod: same kubectl, Helm, and GitOps. Kubernetes has always assumed a fixed set of machines underneath it. That assumption shapes everything above it: you size a node pool for a specific VM type in a specific region, you plan for peak rather than for average, and every workload on a node shares the same kernel and the same security boundary. Virtual nodes on ACI relaxs that assumption, which is what makes both elastic capacity and per container isolation possible without a different Kubernetes. If you've used the original AKS virtual nodes add-on (Virtual Kubelet based), this is not a rebrand. It is a new implementation that integrates far more deeply with Kubernetes, lifts most prior limitations (init containers, persistent volumes, managed identity, richer networking), and adds confidential containers as a first-class capability. The migration guide can be found here. Two capabilities carry the rest of this post: effortless burst capacity, and confidential containers. How virtual nodes on ACI work ACI runs every container as a Hyper-V isolated container, which means each one gets its own lightweight virtual machine boundary rather than sharing a kernel with its neighbors. Azure operates that platform. A virtual node connects it to your cluster. The cluster's control plane, the component that decides where each container runs, sees two kinds of destination: a small pool of virtual machines carrying cluster services, and one or more virtual nodes. From the application manifest's perspective, nothing changes. The pod lands on a virtual node; the virtual node hands it off to ACI. See Microsoft Learn: virtual nodes on ACI for the official capability and current limits. Virtual nodes on ACI in practice The rest of this post is hands on. You do not need to be a Kubernetes expert to follow it. kubectl is the command line tool for talking to a cluster, Helm installs packaged software into one, and a manifest is a text file describing what you want to run. If you have a cluster, everything below runs against it as written. The manifests behind the examples live in a companion demo repo. Setup is documented officially, and you can reproduce this end to end from the ACI virtual nodes documentation and the microsoft/virtualnodesOnAzureContainerInstances Helm repo. One requirement before you start: deploy into a delegated ACI subnet, meaning a subnet in your virtual network set aside for the ACI platform to place containers in. Size it for peak pod count plus headroom, since every pod consumes an address from it for its lifetime. Demo manifest files can be found in this repo, a personal sample repo provided as is and not a supported Microsoft artifact. Enable virtual nodes on ACI The virtual node is deployed via Helm. The Microsoft GitHub repo is itself a Helm repository, so a single helm install is all you strictly need. Cloning first, shown here, just makes it easier to customize values. Running kubectl get nodes afterward confirms the node registered. git clone https://github.com/microsoft/virtualnodesOnAzureContainerInstances.git helm install <yourReleaseName> ./virtualnodesOnAzureContainerInstances/Helm/virtualnode kubectl get nodes The virtual node appears alongside any existing capacity, ready to accept work. A virtual node is a Kubernetes node You target it the same way you would target any node. These few lines in a manifest say "run this on the virtual node": nodeSelector: virtualization: virtualnode2 kubernetes.io/os: linux tolerations: - key: virtual-kubelet.io/provider operator: Exists effect: NoSchedule That is the entire integration surface. No new API to learn, no separate deployment pipeline, no application changes. kubectl describe, kubectl logs, and kubectl exec, the standard commands for inspecting and troubleshooting, all work as they would anywhere else, including opening a shell inside a container running in a Hyper-V isolated boundary. Scaling stays trivial. kubectl scale deployment demo-deployment --replicas=10 lands every replica on the same virtual node, with no VMSS scale event, no provisioning latency, no climbing node-count chart. The same flow scales just as cleanly to hundreds. Cost follows the same shape. Each pod is billed per second against the cores and memory it requests, at ACI rates, and billing stops when the pod stops. Logs and metrics flow through the same path you already use, so existing dashboards and alerts keep working. One annotation makes a pod confidential Turning a regular container into a confidential one takes a single addition to its manifest: a policy that pins exactly which images, commands, environment variables, mounts, and capabilities are permitted inside the Trusted Execution Environment. The format is a base64 encoded Rego document, called a CCE (Container Confidential Enforcement) policy. You do not write that policy by hand. A tool generates it from the manifest you already have: az extension add -n confcom az confcom acipolicygen --virtual-node-yaml ./hello-world-deployment.yaml The tool pulls each image, hashes its layers, builds the allow-list, and injects the annotation back into the manifest. kubectl apply, and you're done. (acipolicygen has prerequisites of its own, including a working Docker installation; see the confcom documentation.) Here is why this is a genuinely new isolation primitive rather than a stronger version of an existing one. Most container security policy is enforced by software in the cluster, which means an attacker who compromises the host can potentially bypass it. This policy is enforced by the guest operating system inside the TEE instead. The underlying hardware, AMD SEV-SNP, also produces an attestation report, retrievable from inside the container, which is a cryptographic proof that the workload running is the workload you specified and nothing tampered with it. That is the guarantee regulated industries have been asking for, and increasingly the one AI workloads running untrusted code need too. The same per pod boundary is also what makes multi-tenancy on a single cluster realistic, though multi-tenancy in production still depends on your network and identity boundaries, which sit outside what the isolation layer itself provides. Background: Microsoft Learn: confidential containers on ACI. Wrapping up Virtual nodes on ACI give containers on Azure two things that were previously hard to deliver cleanly on Kubernetes: Effortless burst capacity on Azure's serverless container platform, billed per second for the cores and memory used, with no capacity planning and no waiting for machines. Confidential containers with hardware attested, per container isolation inside a Trusted Execution Environment. Virtual nodes are additive, not a replacement. Traditional node pools remain the right home for steady state, DaemonSet, and persistent volume workloads, and AKS features such as Node Auto Provisioning and Virtual Machine Node Pools already make that baseline more flexible. Virtual nodes on ACI absorb the spikes, the short-lived jobs, and the specialized isolation work on top. Where to start New to containers on Azure? Start with a small AKS cluster and add a virtual node from day one. You get a managed Kubernetes environment without having to guess your peak capacity in advance, and the elastic layer is there the first time you need it. Already running AKS? Add a virtual node to an existing cluster and move one bursty or short lived workload to it. Nothing else changes, and the comparison is immediate. Evaluating platforms? The capability that is hard to find elsewhere is the confidential containers path: hardware attested isolation per container, reachable through a standard Kubernetes manifest. The result: virtual nodes on ACI expand what AKS can run, with more capacity and stronger isolation, without changing the Kubernetes operating model you already use. Same kubectl, same manifests, same GitOps. New ceiling. For the high-level overview, official documentation, and Helm details, the Microsoft Learn is the source of truth. The companion repo holds the demo manifests used in this post. Acknowledgements I'd like to thank Gurpreet Virdi, Partner Group Engineering Manager, whose guidance shaped this post from the first outline through to publication. Her product leadership ensured this post reflects both the technical depth and the customer value of virtual nodes on ACI. Thanks to Gabriel Fuhrman, Senior Software Engineer, for his detailed technical review. His feedback refined the technical content and significantly improved the accuracy and depth of this post. Christopher Little, Principal CSA, shaped the enterprise adoption perspective, and Adam Sharif, CSA, reviewed the post from the earliest draft. Thanks also to Kirthi Maguluri, Senior Product Manager, and Varun Shandilya, Principal Product Manager, for their review of the blog.86Views0likes0Comments
How to recover global admin access to tenant
I have already tried posting this to the general Microsoft Q&A forums and received no response. We are desperate to figure something out so if this is not the correct line of communication, please direct me to where I should go. My company is in a bit of a bind right now, and I am at my wit's end after almost a week of trying to get in contact with anyone who could help. We have multiple directories in Azure that belong to us, but they are all independent of each other. As such, some directories have multiple global admins (and thus are not an issue); others -- and quite frankly, the most important ones -- only have one global admin, and it was our DevOps person, who is no longer employed with us. We have no way of accessing his account, and thus no way of accessing a global admin account for these directories/tenants. Access to these directories is critical to our operations. We were informed last Friday by someone from the data protection team that they could not give us access to these tenants we pay thousands of dollars a month for because: Our former DevOps person registered all other users as guests/external users, and DPT "can't give external users admin permissions", and To reset the MFA of the current global admin account, the owner of the account (who no longer works for our company) would need to contact them and verify their identity What options do we have here? We have blobs full of user-uploaded files in these tenants. Starting over from scratch is a doomsday scenario we are trying everything we can to avoid. Surely there has to be something that can be done?603Views1like6CommentsHow Azure uses AI to turn feedback into improved customer experience
Authors: eshaanbhattad, jenniferjhan, lakshminarasimha, bharadwajr The Challenge: Synthesizing fragmented feedback signals, to improve Azure's experience quality at scale Customers experience products and services end to end, but product experiences are often structured around individual service. One team may only know its top issues, while another may see only its own slice of experience. That structure makes it difficult to identify cross-cutting friction across the broader product experience. The feedback signals themselves are also fragmented. Customers share feedback through in-product surveys, support cases, field conversations, and social channels. Most product teams can see only part of that picture, making it hard to distinguish isolated comments from meaningful trends, understand which issues were having the greatest impact, and avoid missing critical feedback. For the Azure team, the challenges of fragmentation were amplified by scale. The team processed roughly 10,000 to 15,000 customer feedback reports each month, and synthesizing that feedback required 80 to 100 hours of expert analysis. Additional effort was needed to translate findings into consistent engineering work items. As feedback volume grew, manual analysis became increasingly unsustainable creating delays in identifying and addressing customer priorities. Compounding the challenge was the absence of an effective feedback loop to measure the impact of quality improvements. Teams struggled to justify investments in quality over new features because the return on those investments was difficult to quantify. The absence of a closed-loop measurement system made it difficult to consistently assess the customer impact of quality improvements. The team needed a system that could operate across organizational boundaries and across the product development lifecycle: Identify the most critical customer issues across fragmented feedback channels and product areas. Convert those insights into actionable engineering work, help teams address issues effectively, and measure outcomes to close the loop. The solution needed to preserve team-specific context, maintain auditability, continuously improve through feedback, and keep human experts in control of decisions that require judgment. To address these challenges, Microsoft launched the Great Experiences Matter (GEM) initiative. GEM is designed to analyze feedback signals in aggregate, with access controls and privacy safeguards designed to limit exposure of customer-identifiable information while helping teams identify patterns across channels. The Solution: an agentic feedback-to-fix loop with humans in control GEM created an AI-enabled feedback-to-fix workflow that connects customer listening, engineering action, and impact measurement across the product development lifecycle. The workflow uses Microsoft Foundry, Azure Data Explorer, Microsoft Fabric, Azure DevOps, and a set of custom agents to transform large volumes of qualitative feedback into prioritized insights and actionable engineering work. Fig 1. GEM AI-enabled automation workflow The system closes the loop through two connected motions. Find. Agentic workflows remove noise and duplicate reports, assess relevance and actionability, classify feedback against known issues from UX research, cluster related issues, and surface likely root causes. GEM builds on years of deep end-to-end UX research that has identified systemic friction across customer journeys and product boundaries. By continuously triangulating GEM signals with ongoing research, we combine broad, scalable listening with deep human insight to inform a more cohesive Azure experience. The results are surfaced through global scorecards for cross-cutting Azure issues and vertical scorecards tailored to individual product teams. Fig 2. GEM Global scorecard of top issues with Azure, data has been fictionalized to protect intellectual property Fix. The workflow creates Azure DevOps work items with the customer context, likely reproduction steps, recommended next actions, and an auditable trace of the supporting analysis. To date, 42% of the identified issues have been addressed through engineering action. The team is also extending an AI-assisted engineering workflow, using GitHub Copilot cloud agent, that can generate proposed fixes for straightforward issues. Engineers remain responsible for reviewing, refining, approving, and shipping any changes. The architecture is designed for inspection rather than blind automation. The recommendations include an auditable evidence trail allowing reviewers to inspect the source feedback, classifications, supporting references, confidence indicators, and recommendation actions. Human expertise enters the system at several points. Researchers shape the issue taxonomies and qualitative grounding. Product teams define ownership boundaries, business priorities, domain-specific vocabulary, and trusted sources that guide agent analysis. Engineers review and act on resulting work items, while leaders use scorecards to inform investment decisions. This context is captured in configuration files that evolve alongside the products they support. Teams can add new issue categories, refine keywords, clarify ownership boundaries, or identify trusted research sources. The next analysis cycle automatically incorporates the updated context without requiring changes to the underlying agents. That design creates a "feedback loop for the feedback loop". Teams review the root-cause analyses and work-item quality, identify gaps, and refine their configurations. This enables teams to continuously embed domain expertise into the workflow, improving how feedback is interpreted and prioritized without requiring changes to the underlying infrastructure. Their input improves subsequent runs, helping the system become more precise while preserving local product knowledge. The agent also maintains access to reports from previous runs and uses tools such as Web IQ and MCP servers to assess whether previously identified issues are improving, still require attention, or can be confidently closed. Fig 3. Example of the vertical feedback agent reasoning through customer feedback to find new work items One demonstrated example surfaced customer reports that a networking tool lacked IPv6 validation and support. The workflow generated an engineering work item describing the issue, customer impact, likely reproduction path, and recommended actions. The networking team reproduced the issue, validated the finding, and added it to its backlog. The goal is not to remove people from the process. Agents assume much of the cognitive load associated with sorting, clustering, tracing, and drafting, allowing experts to focus on judgment, prioritization, and implementation. Teams remain accountable for what is fixed, what is funded, and what is allowed to ship. The Impact: measurable experience gains at Microsoft production scale GEM began with manual interventions and is now scaling through AI-enabled workflows. The combined approach has produced measurable results across the Azure Portal and individual product experiences: The workflow aggregates and analyzes approximately 10,000 to 15,000 feedback reports each month across in-product, support, and social channels. Automated analysis reduced manual synthesis time by over 95 percent, turning a process that required 110 to 160 hours each month into a workflow that runs in under 60 minutes. Between October 2025 and April 2026, Azure Portal feedback rates declined by 30%. During that same period, GEM helped teams identify and prioritize experience improvements, creating a clearer link between customer feedback, engineering action, and outcome measurement. Service-level outcomes also demonstrate how better signals can drive business impact. For example, improvements to VM Connect experiences reduced overall Core Compute support volume by 1-2% per month, resulting in proportionate cost savings. The Azure Growth team increased subscription conversion by 9.1 percent after prioritizing issues highlighted through GEM. The value goes beyond speed. Leaders gain a more consistent basis for prioritization, and engineering teams receive work that is already connected to customer evidence and impact signals. Most importantly, every completed cycle creates new learning. Teams can measure changes in customer feedback and support volumes following improvements, incorporate partner input into future analyses, and continuously refine both the system and the products it helps improve. Key learnings and transferable practices The GEM experience offers several lessons for teams building agentic systems around complex, qualitative business processes: Start with real problems, not AI - Value comes from understanding the genuine business needs and applying AI where it is demonstrably better than existing approaches. Applying AI without a clearly defined problem often adds complexity without delivering meaningful value. Design for the end-to-end workflow - Value comes from connecting insights to the broader business process, including grounding in prior knowledge, prioritization, engineering action, post-fix measurement and reporting. Standalone AI output creates limited value, while an integrated workflow drives outcomes. Design for human judgment and accountability - Agents can reduce toil and cognitive load, but researchers, product managers, engineers, and leaders remain responsible for validating insights and determining appropriate actions. Ground agents in the knowledge of the teams they serve - Shared models require local context. Editable configuration files allow teams to define ownership, business priorities, releases, examples, and trusted sources without modifying underlying agents. Build observability and feedback mechanisms into the agentic system itself - Making analysis inspectable through reasoning traces, source context, and recommendations enables experts to identify gaps, improve outputs, and build trust over time. Build feedback mechanisms directly into the flow of work, making it effortless for users to provide input on the system. Tailor outputs to the people making decisions - Executives need trends and investment signals. Researchers need evidence and themes. Engineers need reproducible, actionable work. Effective systems deliver the right information to the right audience. Start small and iterate quickly - The AI landscape continues to evolve rapidly. Begin with a well-defined problem, measure outcomes, learn from feedback, and iterate as capabilities mature. Looking forward GEM continues to scale across the Azure Portal ecosystem. In addition to the global scorecard, vertical scorecards are now live with seven teams, expanding to the top 20 portal extensions representing more than 80% of portal traffic and feedback, with longer-term plans to extend coverage across the entire ecosystem. The roadmap includes expanded feedback ingestion, streamlined work-item tracking, AI-assisted remediation workflows, stronger evaluation, and a self-improving architecture. Proposed fixes would remain subject to engineer review, approval, and standard release controls before deployment. GEM is also developing AI-assisted pre-release governance workflows for production code that help identify potential quality issues during development. We will share more about these pre-release workflows in a future post. New tools and models will continue to evolve, but the enduring principle remains the same: combine enterprise-scale automation with clear ownership, trusted grounding, and human control. For Microsoft, Customer Zero means deploying these systems in real production environments, learning from the complexities, and sharing those lessons broadly. GEM shows what becomes possible when AI does more than summarize feedback. It helps an organization listen, act, measure outcomes, and continuously learn at customer scale. Microsoft's Customer Zero blog series gives an insider view of how Microsoft builds and operates Microsoft using our trusted, enterprise-grade agentic platform. Learn best practices from our engineering teams through real-world lessons, architectural patterns, and operational strategies for building, operating, and scaling AI-powered systems across the organization.764Views2likes0CommentsWiring Azure DevOps Pipeline Templates Without the Parameter Sprawl: The Manifest Facade Pattern
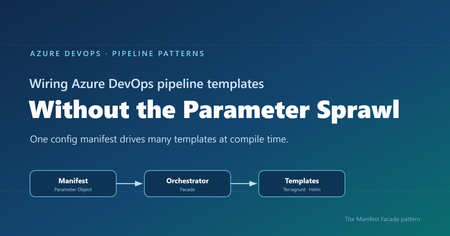
Where reusable pipelines start to hurt Who this is for: Platform and DevOps engineers who build shared Azure DevOps Pipeline Templates and want other teams to adopt them consistently. If you have ever built a set of shared Azure DevOps Pipeline Templates, you probably know how this goes. You write a whole library of clean, well-factored templates: provisioning infrastructure, deploying apps, scanning, promotion, and more. Each one is tidy on its own. Then the first team tries to actually use them together, and things get messy fast. That is exactly what happened to us on a customer engagement, while building a DevOps framework for their engineering teams. The templates themselves were fine. The trouble was wiring them together. Every consumer pipeline had to know how to call each template it used: the right order, which values one template fed another, and the full parameter list for every one of them. As the library grew, those consumer pipelines grew with it, long and repetitive. That friction turned into a real adoption problem. Getting started meant wading through pages of parameters, so teams put it off, copied whatever the team next door had, or quietly built their own thing instead. This post follows that story, from the tangle of parameters to the solution we landed on. Here is how it comes together. Where we started: Good templates, hard to adopt The DevOps framework we built had many templates. To keep this walkthrough concrete, we will follow just two of them: one that provisions infrastructure with Terragrunt (a wrapper around Terraform), and one that deploys an app to Kubernetes with Helm. Both are trimmed down to the essentials here so they are easy to follow. The infrastructure template, templates/infra/terragrunt-deploy.yml : parameters: - name: stack type: string - name: workingDir type: string steps: - script: | cd ${{ parameters.workingDir }} terragrunt plan -out=tfplan terragrunt apply -auto-approve tfplan displayName: "Deploy ${{ parameters.stack }}" The application template, templates/app/helm-deploy.yml : parameters: - name: releaseName type: string - name: chart type: string - name: namespace type: string - name: imageTag type: string steps: - script: | helm upgrade --install ${{ parameters.releaseName }} ${{ parameters.chart }} \ --namespace ${{ parameters.namespace }} \ --set image.tag=${{ parameters.imageTag }} displayName: "Deploy ${{ parameters.releaseName }}" There is nothing wrong with either file. The pain showed up in the pipeline that had to use them, where a team had to stitch the templates together by hand, remember the order, and repeat that boilerplate for every environment. Do that across a dozen services and you get long, copy-pasted pipelines that teams struggle to adopt. And because the wiring is done by hand, it leaves loopholes: a team can skip a step or override a parameter and slip past the guardrails you thought were in place. Challenge 1: Wiring the templates together The obvious move was to hide the wiring behind a single template that owned the order and the plumbing. We called it the orchestrator template: a consumer pipeline called that one template, and it wired up the rest. # templates/deployment-orchestrator.yml (the single orchestrator) parameters: - name: infraStack type: string - name: infraWorkingDir type: string - name: releaseName type: string - name: chart type: string - name: namespace type: string - name: imageTag type: string # ...and this list just kept growing stages: - stage: Infra jobs: - job: infra steps: - template: infra/terragrunt-deploy.yml parameters: stack: ${{ parameters.infraStack }} workingDir: ${{ parameters.infraWorkingDir }} - stage: App dependsOn: Infra jobs: - job: app steps: - template: app/helm-deploy.yml parameters: releaseName: ${{ parameters.releaseName }} chart: ${{ parameters.chart }} namespace: ${{ parameters.namespace }} imageTag: ${{ parameters.imageTag }} A team used it by calling that one template and passing a value for every parameter it exposed: # azure-pipelines.yml (a team's pipeline) parameters: - name: imageTag type: string extends: template: templates/deployment-orchestrator.yml parameters: infraStack: network infraWorkingDir: infra/network releaseName: orders-api chart: charts/orders-api namespace: orders imageTag: ${{ parameters.imageTag }} # ...and a value for every other parameter, too This solved the ordering and the copy-paste, but it handed us a new headache. This one template now had to expose every parameter of every template underneath it, and the list grew each time we added a capability. Worse, a real service usually needed more than one infrastructure stack and more than one Helm release. A flat list of parameters cannot express “two infrastructure stacks and three Helm releases” without silly names like infraStack1 , infraStack2 , and so on. Nobody could learn the thing. We had solved the wiring, only to trade it for a parameter problem. Challenge 2: The orchestrator’s parameter list explodes So how do you shrink that list? Step back and ask what you are really describing: a set of things to deploy. So the input should describe that set, not a long flat list of loose values. That is where the deployment manifest came in: one small config that lists the infrastructure to create and the apps to deploy. It reads about how you would expect: infrastructure: - stack: network workingDir: infra/network applications: - releaseName: orders-api chart: charts/orders-api namespace: orders Now the orchestrator can take that single manifest and loop over it, instead of exposing dozens of separate parameters. Its parameter list collapses to one, and a ${{ each }} loop turns each entry into a stage or job: # templates/deployment-orchestrator.yml (the orchestrator, now manifest-driven) parameters: - name: manifest type: object - name: imageTag type: string stages: - stage: Infra jobs: - ${{ each stack in parameters.manifest.infrastructure }}: - job: infra_${{ stack.stack }} steps: - template: infra/terragrunt-deploy.yml parameters: stack: ${{ stack.stack }} workingDir: ${{ stack.workingDir }} # ...an App stage loops over parameters.manifest.applications the same way And a consumer passes that manifest straight to the orchestrator: # azure-pipelines.yml (a team's pipeline) parameters: - name: imageTag type: string extends: template: templates/deployment-orchestrator.yml parameters: imageTag: ${{ parameters.imageTag }} manifest: infrastructure: - stack: network workingDir: infra/network applications: - releaseName: orders-api chart: charts/orders-api namespace: orders The parameter problem is solved. But hand-writing that whole manifest inside every pipeline is a lot to repeat, so the natural instinct is to pull it out into its own file. That is where things get tricky. Challenge 3: The manifest is read too late to shape the pipeline So we tried exactly that: we moved the manifest into a deployment-manifest.yml file and had the orchestrator read it back and expand it into stages and jobs. It sounded reasonable, but it did not work. To see why, you need to know how Azure DevOps builds a pipeline before it runs anything. An Azure DevOps pipeline actually happens in two phases, and they are further apart than people expect. First comes the build phase, before anything runs. Azure DevOps reads your YAML, pulls in every template, evaluates every ${{ }} expression, and unrolls every ${{ each }} loop. Out of this it produces one final, fully assembled pipeline. At this point no agent has started and no repo has been checked out. Only parameters and template expressions exist yet. Then comes the run phase. The assembled pipeline runs. An agent starts, checks out your code, and only now can a script open a file on disk. Here is the problem. Your deployment-manifest.yml does not exist as far as the pipeline is concerned until an agent checks out the repo, and that checkout happens during the run phase. So if the manifest is supposed to decide how many stages there are, or how many apps each get their own job, that decision has to be made earlier, while the pipeline is still being built. Important: The shape of the pipeline, its stages, jobs, and loops, is locked in while the pipeline is being built. A file you read during the run comes too late to change any of it. That was the wall we hit. The manifest was the right idea, but reading it from a file happened too late for the orchestrator to turn it into stages and jobs. So the manifest could not come from a file read during the run phase. It had to already exist, as an object, before the pipeline was assembled. The Manifest Facade pattern: Build the config while the pipeline is assembled The solution is to stop thinking of the manifest as a file to read, and start thinking of it as an object you build while the pipeline is being assembled. Parameters are available then. Template expressions can build a whole object then. So we added a small template, kept in the team’s own repo, with one job: take a couple of simple inputs, build the full manifest from them, and pass it to the shared orchestrator. We called it the builder, since assembling the manifest is its only job. It stays thin and lives next to the team’s pipeline, while the orchestrator stays in the shared platform repo. This is not a brand-new invention so much as a few familiar ideas working together, applied at pipeline build time. The manifest is a Parameter Object (Martin Fowler’s refactoring for collapsing a long parameter list into one structured value). The orchestrator is a Facade (the Gang of Four pattern for putting one simple, unified interface over a subsystem, here the underlying leaf templates). And the small template in the team’s repo is the piece that assembles that Parameter Object from a couple of inputs. What makes it an Azure DevOps pattern is the timing: the manifest is built as an object while the pipeline is assembled, so it can drive template expansion instead of sitting in a file that only gets read during the run. That is the twist we did not see written down anywhere, so we gave it a name: the Manifest Facade pattern. In practice it comes together in three small pieces: the consumer pipeline references the builder, the builder assembles the manifest and hands it to the shared orchestrator, and the orchestrator expands that manifest into stages and jobs. Here is how the files extend into one another: Here is each piece in turn. Step 1: The consumer references the builder The consumer pipeline extends the builder that lives in its own repo. It also declares the shared platform repo as a resource, so the orchestrator the builder calls is available while the pipeline is built. # azure-pipelines.yml (the team's pipeline) parameters: - name: imageTag displayName: Image tag type: string resources: repositories: - repository: platform type: git name: platform/pipeline-templates ref: refs/tags/v1.0.0 trigger: - main extends: template: config/deployment.yml@self parameters: environment: dev service: orders imageTag: ${{ parameters.imageTag }} Because the image tag is a runtime parameter, it is declared here in the consumer pipeline, which is what makes it appear in the Run pipeline panel for someone to fill in. Beyond that, the team passes only an environment and a service name, and the builder works out the rest. Step 2: The builder assembles the manifest The builder takes those inputs and assembles the whole manifest from them, then hands it to the orchestrator. Every structural value here is a parameter or a template expression, so all of it is ready while the pipeline is being assembled. # config/deployment.yml (builder, in the team's repo) parameters: - name: environment type: string - name: service type: string - name: imageTag type: string extends: template: deployment-orchestrator.yml@platform parameters: imageTag: ${{ parameters.imageTag }} manifest: schemaVersion: v1 infrastructure: - stack: network workingDir: infra/${{ parameters.environment }}/network applications: - releaseName: ${{ parameters.service }} chart: charts/${{ parameters.service }} namespace: ${{ parameters.service }} The builder assembles the manifest inline from the environment and service, then passes it straight to the orchestrator. The image tag is different: it is a runtime parameter the user supplies at queue time, so it is passed through to the orchestrator template and never becomes part of the manifest. The team gets a tiny interface, and the orchestrator still gets the full structure it needs. Step 3: The orchestrator turns the config into stages and jobs The orchestrator takes a single object and loops over it with ${{ each }} . Each stage and job gets generated while the pipeline is assembled. # deployment-orchestrator.yml (shared platform repo) parameters: - name: manifest type: object - name: imageTag type: string stages: # a ValidateManifest stage runs first (covered in the next section) - stage: Infra jobs: - ${{ each stack in parameters.manifest.infrastructure }}: - job: infra_${{ stack.stack }} steps: - template: infra/terragrunt-deploy.yml parameters: stack: ${{ stack.stack }} workingDir: ${{ stack.workingDir }} - stage: App dependsOn: Infra jobs: - ${{ each app in parameters.manifest.applications }}: - job: app_${{ app.releaseName }} steps: - template: app/helm-deploy.yml parameters: releaseName: ${{ app.releaseName }} chart: ${{ app.chart }} namespace: ${{ app.namespace }} imageTag: ${{ parameters.imageTag }} Because the manifest is a real object by the time the loops run, ${{ each }} unrolls it into actual jobs. List two stacks and you get two jobs. List two apps and you get two deploy jobs. And because the team only describes what to deploy, the sensitive wiring like service connections stays inside the platform templates, out of reach. The loophole is gone because the parameter is gone. Why the order of things matters The whole pattern comes down to who does what, and when. The builder turns a simple intent (“deploy orders to dev”) into a full manifest, while the pipeline is being assembled. The orchestrator turns that manifest into real stages and jobs, still while the pipeline is being assembled. Only the leaf templates do the real deployment work during the run: checkout, terragrunt apply , helm upgrade . Nothing about the shape of the pipeline waits for the run, so nothing about it depends on a file that only shows up after checkout. That is the whole trick. If you do have values you genuinely cannot know until the run, like a secret fetched from a vault or an artifact version an earlier stage writes to a variable, those still belong in runtime variables and variable groups. The manifest is for the structure and config you already know when you queue the build, which is almost always the part that was causing the pain. Validating the manifest against a schema Once the manifest became the one interface every team fills in, it needed a contract. We wrote that contract as a JSON Schema and kept it in the shared platform repo under schema/v1/ . The folder name is the version: backward-compatible additions go straight into v1 , and the day we need a breaking change we add a schema/v2/ alongside it, so existing consumers keep working while the schema evolves. Each manifest carries a schemaVersion so the orchestrator knows which contract to hold it to. On top of that, we validate in three layers, each catching a different class of mistake. Layer 1 is build time, for free. Because the orchestrator’s parameters are typed, with manifest declared as an object , Azure DevOps catches a range of structural problems while it expands the templates, before anything runs. For example, if a manifest left out infrastructure or misspelled it, the orchestrator’s ${{ each stack in parameters.manifest.infrastructure }} loop would have nothing valid to iterate over, and the failure would surface during template expansion rather than halfway through a deployment. Layer 2 is a version check that runs at build time. Both the ${{ if }} and parameters.manifest.schemaVersion are resolved while the pipeline is being assembled, so the orchestrator decides right then whether it understands the manifest’s version. If it does not, the only thing it generates is a single failing stage, and the real deployment stages are never built, so nothing runs against a contract the orchestrator does not know: # deployment-orchestrator.yml (shared platform repo) parameters: - name: manifest type: object stages: # Layer 2: reject schema versions this orchestrator does not understand - ${{ if not(containsValue(split('v1', ','), parameters.manifest.schemaVersion)) }}: - stage: UnsupportedSchemaVersion jobs: - job: fail steps: - script: | echo "##vso[task.logissue type=error]Unsupported manifest schemaVersion '${{ parameters.manifest.schemaVersion }}'" exit 1 # the ValidateManifest, Infra, and App stages below are generated only when the version is supported Layer 3 is a run-time check against the full schema. The first stage the orchestrator generates is ValidateManifest . Because the schema lives in the platform repo, the job checks that repo out first. Then it serializes the manifest object to JSON with the convertToJson expression, writes that JSON out to a file, and runs a JSON Schema checker to compare the file against the schema. If the manifest breaks the contract, the pipeline stops here, before any infrastructure or app stage runs: # Layer 3: validate the real manifest object against the JSON Schema - stage: ValidateManifest jobs: - job: validate steps: # the schema lives in the platform repo, so check it out first - checkout: platform - script: | echo '${{ convertToJson(parameters.manifest) }}' > manifest.json pip install check-jsonschema check-jsonschema --schemafile schema/${{ parameters.manifest.schemaVersion }}/deployment.schema.json manifest.json displayName: "Validate manifest against schema" Layer 1 is automatic, Layer 2 rejects an unknown contract at build time so the deployment stages are never generated, and Layer 3 confirms the actual values match the schema before any real work begins. Together they turn “the manifest looked right” into “the manifest is provably valid.” A few trade-offs to keep in mind No pattern comes without trade-offs. A few things worth weighing: The manifest has to be something template expressions can build. You can compose objects, loop, and branch with ${{ if }} , but there is no running arbitrary code while the pipeline is assembled. Anything fancier may need a prep step or a file generated upstream. Every team carries a small builder template. We think that is a fair trade, since it keeps their intent local and readable, but it is one more file per repo. Keep it thin and let the orchestrator hold the real logic. Treat the schema as living documentation. Because the manifest’s JSON Schema spells out every field and what it means, teams can read it to build their own manifest with confidence, instead of reverse-engineering the orchestrator. Pin the shared repo to a tag, like the v1.0.0 above, so a change to the orchestrator does not silently change everyone’s pipeline on the next run. Debugging takes a small shift in habit. When something looks off, use the pipeline’s preview to see the fully assembled YAML before it runs. It shows you exactly what the loops produced. Tip: Use the Azure DevOps pipeline preview to see the fully assembled YAML without running anything. It is the fastest way to confirm your manifest unrolled into the stages and jobs you expected. Wrapping up It is a journey a lot of platform teams will recognize. Clean templates, messy wiring, one orchestrator that fixes the order but drowns in parameters, a config file that brings back sanity, and then the surprise that reading it at the wrong moment means it can never shape the pipeline. The solution is small and it sticks. Put a thin builder template next to each team, let it assemble the manifest from a couple of simple inputs, and let a shared orchestrator turn that manifest into stages and jobs. Teams get an interface they can easily understand and adopt. The platform team keeps the wiring and the guardrails in one place. And the timing gap that trips up so many “just read the config file” attempts stops being a problem, because you are working with it instead of against it. Key takeaways Shared Pipeline Templates stall on adoption when every team has to wire them together by hand. A single orchestrator template fixes the ordering, but a flat parameter list does not scale to real adoption. A config file read during the pipeline run cannot shape the pipeline, because stages and jobs are decided earlier, while the pipeline is assembled. The Manifest Facade pattern builds the config as an object at assembly time, so one small input drives many templates, consistently and with the guardrails baked in. Give the manifest a versioned JSON Schema and validate it in layers, so a broken contract fails fast instead of halfway through a deployment. How are you handling template sprawl in your own pipelines? We would love to hear what has worked for your teams in the comments.377Views1like0CommentsSyncing Multiple Azure DevOps Orgs to One ServiceNow Instance Without Forcing a Shared Workflow
If your organization runs more than one Azure DevOps org, whether from an acquisition, a spun-up subsidiary, or business units that never consolidated onto one instance, you already know the visibility gap. Central ServiceNow has no idea what's happening in any of them unless someone checks manually. Your team ends up pulling status updates by hand, chasing changes across orgs, and reconciling what got closed where. That works well for a couple of orgs, but it falls apart past that. Why a Shared Workflow Usually Creates a Bigger Problem Migrating everyone onto a single Azure DevOps org would close the visibility gap on paper. Each org's area paths, iterations, states, and processes took years to get right, and a forced migration undoes all of it. A sync layer between each Azure DevOps org and your central ServiceNow instance closes the same gap without touching how any individual org works day to day. Each org keeps its own configuration. ServiceNow ends up with a rolled-up view across all of them. Common Use Cases Post-Acquisition Org Sprawl Current Setup: A company acquires another company, or runs several business units, each with its own Azure DevOps org and its own way of working. Problem: Central ops has no single view across orgs, and checking each one by hand doesn't scale past a few teams. Solution: Connect each Azure DevOps org to the central ServiceNow instance separately, each with its own sync rules. ServiceNow gets one rolled-up view, and no org has to change how it works. Bi-Directional Status Sync Between Delivery and Support Current Setup: Support logs incidents in ServiceNow. Development tracks the corresponding work in Azure DevOps, sometimes across several orgs. Problem: Support has to ask developers for status or check Azure DevOps boards directly, and developers end up relaying the same update twice. Solution: Sync status, comments, and priority both ways, so an update in either system shows up automatically on the other side. Field-Level Control Per Org Current Setup: Each business unit or subsidiary has its own rules about what data can leave its Azure DevOps org. Problem: A single shared integration with one set of mapping rules risks exposing fields an org never agreed to share outside its own boundary. Solution: Give each org's connection its own outgoing rules, so a subsidiary decides exactly which fields leave its Azure DevOps org, field by field. Handling Closed and Read-Only Work Items Current Setup: ServiceNow blocks writes to closed incidents through ACLs, and Azure DevOps can hit a similar restriction on closed or read-only work items. Problem: A sync that keeps trying to write to a closed item throws the same error repeatedly, and the real problems get buried under the noise. Solution: Filter closed and read-only states out of the sync, or let the errors surface if operations wants visibility into them. What to Evaluate When Choosing an Approach A few criteria matter more than others once you're running this across multiple orgs. Decentralized configuration: does each Azure DevOps org get its own connection and its own rules, or does everything route through one shared setup? Filtering: can you scope the sync with something like WIQL queries on the Azure DevOps side, by area path, iteration, work item type, or tag? Field mapping: does it handle the difference between ServiceNow's field structure and Azure DevOps work item fields without dropping data? Common pairs are ServiceNow State to Azure DevOps State, ServiceNow Priority to Azure DevOps Priority, and ServiceNow Assignment Group to Azure DevOps Area Path. Custom fields usually need explicit mapping rules. Conflict handling: what happens when both sides update the same field at the same time, and what happens with closed or read-only items specifically? Security: Entra ID or OAuth authentication, PAT management per org, role-based access, audit logging, and whatever compliance certifications your security team asks for during review. Direction: bidirectional where both teams update shared fields, one-way where only one side should ever write. Technical Approaches Service Hooks and REST APIs Azure DevOps Service Hooks paired with the ServiceNow REST API give you sync in both directions. A change in Azure DevOps triggers a Service Hook, which calls the ServiceNow API to update the record, and the same flow runs in reverse. This is the most direct route if you're comfortable building and maintaining the webhook logic yourself. Custom Middleware For anything more complex, custom middleware gives you full control over field transformation, routing, and error handling. Azure Functions, Logic Apps, or a small Node.js or Python service usually does the job. The trade-off is maintenance. You own the retry logic, the error handling, and every update when either platform changes its API. Dedicated Integration Platforms Plenty of teams skip building this from scratch and use a dedicated integration platform instead. These typically come with pre-built connectors for both Azure DevOps and ServiceNow, a way to configure field mapping and filters without writing much code, and managed infrastructure so you're not hosting your own sync server. What they usually cover: Pre-configured connectors that already understand both platforms' data structures Visual or scripting configuration for field mapping and filters Managed infrastructure, so nothing runs on your own servers Built-in retry and error handling for API failures Audit logging for tracking what synced and when Support for multi-org routing and conditional logic out of the box The trade-off runs the other way: a subscription cost instead of a one-time build, less control over the exact implementation, and your data passing through a third party's infrastructure. For teams running more than 2 or 3 orgs against one ServiceNow instance, this usually ends up being less overhead than maintaining custom middleware long-term. Every org here has probably solved a version of this differently. Curious what's worked for you, especially with 3 or more Azure DevOps orgs feeding into one ServiceNow instance, and which part of the setup gave you the most trouble.131Views1like0Comments
Azure File copy task v4 and later causes 403 error
I've configured a release pipeline in ADO which copies some files to a Storage Account. Using Azure File copy task version 6 consistently fails with a 403 error. RESPONSE Status: 403 This request is not authorized to perform this operation using this permission. After much wasted time checking IP restrictions, checking access and recreating service connections I tried using an earlier version of the task that some other pipelines which do the same thing were using. I found that using version 4 or later of the file copy task causes the issue. Setting the task version to 3 works. Are there any known issues around this?Solved282Views0likes2Comments
Digital Takeover/Lockdown
My web developer has taken over my M365 & Copilot (along with my domain, google workspace, GitHub, Manus.im account, Stripe, Shopify, my financial accounts, and so on) and made has made himself Super admin and/or created an enterprise hierarchy that then turns myself, THE OWNER, into a USER; if he allows me access at all. I have been in an active digital lockout for going on 5 months now. I am at the local library currently trying to find a solution to regaining control. I have been dealing with redirected and limited browsers, blocked accounts, email accounts forwarded and new emails created, and then, even my calls and texts are being forwarded and/or blocked. From taking over my account's admin, a malicious DNS change, using rootkit malware, harmful scripts, injected code, utilizing my API's and tokens to gain access and then lock me out, to deploying autonomous ai agents onto my desktop...It only gets worse! He is also a third-party service provider and has led this persistent attack on my business by hacking EVERY mobile device I have purchased by using my location, Bluetooth, and sharing apps to hack my network and take control. No, this is not a joke. This is my VERY REAL AND VERY CURRENT NIGHTMARE! PLEASE, HELP ME! -Brittany Hamm Diary of a Momtrepreneur/Cullmanspaces.com/brittanyhamm.base44.app236Views0likes1CommentMultithreading, GIL e paralelismo no Python
Concorrência vs. paralelismo Os dois conceitos são parecidos, mas não são a mesma coisa: Concorrência: lidar com várias tarefas ao mesmo tempo, alternando entre elas. As tarefas progridem de forma intercalada, mas não necessariamente executam no mesmo instante. É ideal para trabalho I/O-bound (rede, disco, banco de dados), onde o programa passa a maior parte do tempo esperando. Paralelismo: executar várias tarefas literalmente ao mesmo tempo, em múltiplos núcleos de CPU. É o que acelera trabalho CPU-bound (cálculo pesado, compressão, hashing). Resumindo: todo paralelismo é concorrência, mas nem toda concorrência é paralelismo. Para concorrência de I/O sem threads, o Python oferece o asyncio , baseado em uma única thread com um event loop e a sintaxe async / await . Como ele não cria threads nem processos, é leve e eficiente para milhares de conexões simultâneas — mas não oferece paralelismo de CPU. Threads e o GIL: por que multithreading não paraleliza CPU O módulo threading permite criar threads reais do sistema operacional, mas o CPython usa o GIL (Global Interpreter Lock): uma trava global que garante que apenas uma thread execute bytecode Python por vez. Por que ele existe? O GIL simplifica o interpretador e torna o modelo de objetos (incluindo tipos como dict ) implicitamente seguro contra acesso concorrente, além de facilitar a integração com bibliotecas C. O preço é abrir mão de boa parte do paralelismo em máquinas multi-core. Na prática: Tarefas I/O-bound se beneficiam de threads, pois o GIL é liberado durante operações de I/O (e por extensões como hashlib / zlib em trechos pesados). Tarefas CPU-bound não escalam com threads: o GIL serializa a execução, e usar mais threads não deixa o programa mais rápido — às vezes até o deixa mais lento pelo overhead de troca de contexto. Desde o Python 3.13 existe um build experimental free-threaded (compilado com --disable-gil , descrito na PEP 703) que permite desligar o GIL. Porém isso exige um interpretador compilado especificamente para isso ( python3.14t ); as compilações padrão não permitem desabilitá-lo. O GIL não dispensa sincronização Mesmo com o GIL, ainda precisamos nos preocupar com sincronização. O GIL garante que uma instrução de bytecode não seja interrompida no meio, mas operações de alto nível (como contador += 1 ) envolvem várias instruções de bytecode e podem sofrer race conditions se uma thread for interrompida no meio delas. Por isso o módulo threading oferece primitivos de sincronização — todos usáveis com with para liberação automática: Lock / RLock — exclusão mútua. Semaphore — limita o número de acessos simultâneos. Condition / Event — coordenação entre threads. Multiprocessing: paralelismo real com processos A saída para aplicações CPU-bound é o módulo multiprocessing (ou o ProcessPoolExecutor do concurrent.futures ). Em vez de threads, ele cria processos separados, e cada processo tem seu próprio interpretador e seu próprio GIL, permitindo paralelismo real em múltiplos núcleos. O custo intrínseco é que criar um novo processo cria também um interpretador Python inteiro, o que é pesado em memória e no tempo de inicialização. Além disso, processos não compartilham memória: os dados precisam ser serializados (via pickle ) e trocados por mecanismos de comunicação entre processos como Queue e Pipe , ou por memória compartilhada. Isso torna a sincronização mais complexa e adiciona overhead de comunicação. Benchmark: medindo o impacto do GIL Para comprovar o conceito, um pequeno script calcula muitos hashes SHA-256 encadeados (uma tarefa puramente CPU-bound) e distribui esse trabalho de três formas, usando concurrent.futures : Sequencial — executa tudo em uma única thread, servindo de baseline. ThreadPoolExecutor — divide o trabalho entre várias threads. ProcessPoolExecutor — divide o trabalho entre vários processos. Cada abordagem é medida em tempo de execução e memória consumida. Rodando no Python 3.14.6 (16 núcleos), o resultado foi: Abordagem Tempo Speedup Memória ------------------------------------------------------------ Sequencial 0.79s 1.00x 0.0 MB ThreadPoolExecutor 0.80s 0.99x 0.2 MB ProcessPoolExecutor 0.31s 2.56x 148.6 MB Interpretando os números: As threads não aceleraram a tarefa (speedup ~1.0x, praticamente igual ao sequencial). O GIL serializou a execução do bytecode: mesmo com várias threads, apenas uma roda por vez, então não há ganho de paralelismo para trabalho de CPU. Os processos foram ~2.5x mais rápidos. Como cada processo tem seu próprio interpretador e seu próprio GIL, o trabalho realmente rodou em paralelo em vários núcleos. Esse paralelismo cobra um custo de memória: os 8 processos consumiram ~148 MB (~18,6 MB por interpretador novo), contra apenas ~0,2 MB das threads, que compartilham o mesmo processo. É o trade-off central entre threading e multiprocessing : velocidade real de CPU ao preço de duplicar o interpretador em memória. Conclusão: I/O-bound ou CPU-bound? O GIL é a razão pela qual multithreading no CPython não entrega paralelismo de CPU. A regra prática é: I/O-bound → use threading ou asyncio (o GIL é liberado durante a espera). CPU-bound → use multiprocessing , aceitando o custo de memória e de comunicação entre processos. No futuro, o build free-threaded (PEP 703) promete paralelismo real com threads e sem o custo de vários interpretadores — mas ainda depende de um interpretador compilado sem o GIL. Escolher a ferramenta certa depende, antes de tudo, de entender se o gargalo é de I/O ou de CPU.177Views1like0CommentsBuilding Production-Ready Pipelines in Azure DevOps: Beyond the Documentation Examples
Hi everyone, When moving from basic Azure DevOps tutorials to enterprise production environments, we all quickly realize that documentation examples don't always cover real-world complexities. Handling multi-stage dependencies, keeping Terraform state secure, and managing secrets across environments requires a highly strategic approach. To help DevOps engineers bridge this gap, I recently put together a deep-dive architecture breakdown detailing how to build a resilient, multi-stage YAML pipeline from scratch. Here is a quick look at the core enterprise architecture I focus on: - Multi-Stage Lifecycle: Safe progression flows through Build, Dev, QA, UAT, and Production stages. - Infrastructure Automation: Clean integration with Terraform, including state and secrets management using Azure Key Vault. - Security Gates: Implementation of SAST scanning, Workload Identity, and automated approval policies. - Team Alignment: Connecting Azure DevOps with project tools like Asana to streamline cross-platform tracking. I wanted to share this pattern here to get some community feedback on the YAML structure. Before I post the full configuration snippets, I would love to hear how your teams handle environment gates and approvals. What are the biggest bottlenecks you run into with multi-stage YAML pipelines? Let's discuss in the comments below! Best regards, Abdullah Shahid114Views0likes0Comments