customer zero
10 TopicsStop restricting the agent. Start restricting its environment.
Human review improves safety but limits autonomy. Standing credentials preserve autonomy but increase risk. With Azure SRE Agent, we found a safer middle by moving control out of the model and into the runtime around it.583Views1like1Comment
Azure SRE Agent: Introducing Live Reports
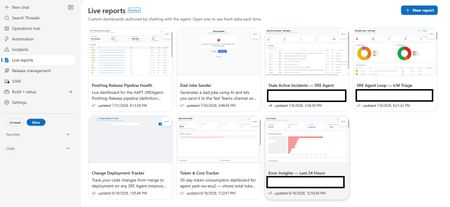
Today we're introducing Live Reports in Azure SRE Agent, now in public preview. You describe a dashboard in chat; the agent builds it, and it refreshes every time you open it. Ops teams ask the same handful of questions every morning: What's burning right now? What landed overnight? Who's on call? The answers usually live across multiple browser tabs, a one-off script only one person can run, or a chat prompt retyped daily and re-read as a fresh wall of text. Live Reports provides the missing piece: somewhere to author a view once and consume it many times. Frozen structure, live data This is the core design decision: the layout is deterministic, and the data is live. The agent authors the page once, then freezes it. Charts, thresholds, column order, and styling stay put. What refreshes on every open are the tool calls embedded in the page, so the shape is identical each morning, and the numbers are up to date. That's what separates a Live Report from a dashboard an LLM regenerates on every view. The chart looks consistent every day, and the page loads like a standard web page rather than a streaming chat response because there's no model in the render path. This leads to a key operational benefit: you only spend tokens when authoring the report. Opening a report built purely on tool calls uses no additional model tokens, no matter how many times you open it. (Reports that opt into AI-powered interpretation are the exception, as explained below.) This makes it practical for your entire team to open the report every morning without incurring ongoing LLM costs. When you want changes, simply ask the agent. It will edit the page in place and save a new version, preserving earlier revisions so you can always reference previous configurations. What you can build Report data sources include the connectors your agent already has access to: any connected MCP server, logs and metrics, source control, work items, and internal services. Charts are real visualizations. Reports pull vetted charting and grid libraries from a CDN, giving you interactive, sortable tables and graphics rather than static markdown tables. Reports can also reason at view time. Alongside tool calls, a report can send a focused prompt to a fast, lightweight model as it renders: classify alerts by severity, group issues by likely root cause, or summarize a discussion thread into a single line. Every reload re-fetches and re-interprets the data, keeping real-time judgment aligned with the latest telemetry. Note: AI-powered interpretation consumes tokens each time the report loads, which is why it is strictly opt-in per report. Reports can also take actions, but only the ones you wired in. A button invokes a write tool from a connector your agent is already connected to: acknowledge an incident, post to a discussion thread, assign an owner, open a work item. It cannot call an arbitrary URL or API of its own. Every button is limited to the exact tool names saved with that version of the report, and any tool that would ask for your approval in chat asks the same way when a button fires it. That's what turns a dashboard into something you operate from, without turning it into an open shell. The security model A model-authored page capable of calling production tools requires strict guardrails. It is constrained across four layers: Sandboxed origin: Reports render in an iframe with sandbox="allow-scripts" and deliberately omit allow-same-origin, ensuring the page runs at an opaque origin with no access to session tokens or cookies. Restricted network access: Report scripts cannot make direct API calls to arbitrary endpoints. All data requests route through the Live Reports runtime, which validates each call against the approved tool manifest for that specific report version. Per-version allowlists: A report can only invoke the exact tools it was configured with. Any unapproved call is rejected server-side at runtime, rather than relying on prompt-level instructions. Explicit human approval: When saving a report with connector access, the agent presents the exact tool descriptions provided by each connector. Nothing executes until you explicitly approve the configuration. Reports remain strictly bound to your agent's existing permission boundary. Exports are sanitized to a static, offline-safe file, which is safe to attach to a postmortem. Getting started Open the Live Reports tab and select New report. Describe your scenario in chat. The agent will inspect your available connectors, ask clarifying questions if needed, and generate the layout. Review and approve the tool permissions to add the report to your gallery. What's next We're continuing to expand connector support, build richer visualization primitives, and tighten the loop between observability and automated remediation. The best reports are often the ones we didn't anticipate. What is the operational view your team finds itself rebuilding by hand? Let us know in the comments. 👉 Try Live Reports in Azure SRE Agent515Views1like0CommentsZero Ops: Agents Operate, Humans Govern
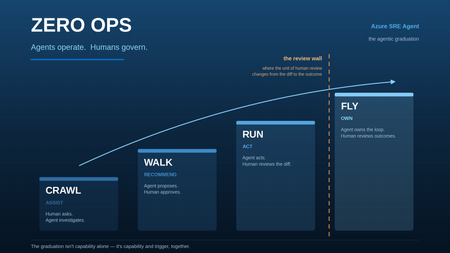
How to design, build, and grow an agentic operations practice — and what becomes possible once you do. A note on scope: the patterns in this guide apply to any agentic operations platform. The specifics — the pricing model, the built-in capabilities, the primitives named throughout — are Azure SRE Agent. Where something is a property of the product rather than a universal truth, it’s called out. Remember when? Remember the 3am page? The one where you sat on the edge of the bed with a laptop balanced on your knees, hunting through six dashboards to work out whether the thing that woke you was even real. Half the time it wasn’t. Remember the cost review? Somebody exports a month of billing to a spreadsheet, three engineers spend a fortnight arguing about which resources are actually orphaned, and by the time you’ve agreed on a plan the next month’s bill has already landed. Remember the zero-day? The all-hands marathon. Two days of people cancelling everything, tracing which services pulled the affected package, hand-patching in an order nobody had time to write down. And remember the CVE backlog — the one everyone knows about, the one that only ever grows, because triaging it properly would take a team you don’t have? None of that was a failure of effort. It was the operating model. For decades it looked like this: humans operated, software assisted. We built dashboards, alerts, runbooks, automation scripts, and eventually copilots — and through every one of those advances, the human was still the operator. That’s the part that’s changing. And it’s genuinely good news. Agents operate. Humans govern. That’s Zero Ops. And the best part is you don’t have to invent it — the path is already well-worn. The five things worth knowing before you start Everything below comes from building and running agentic operations at scale. If you read nothing else, read these. 1. Zero Ops is the destination — and it doesn’t mean zero humans. It means removing operations from humans. People don’t disappear; they move up the stack. They set the intent, govern the system, and validate outcomes. Nobody’s job becomes “watch the dashboard” ever again. 2. The model is not the moat. This was the biggest surprise. The model matters less every year. You can swap models. What you cannot swap is the context and governance wrapped around them. That’s the durable asset you’re building. 3. Context creates intelligence. Agents become genuinely useful the moment they’re grounded in reality — your source code, your live telemetry, your institutional knowledge, your incident history, and the skills and tools to act on all of it. Swap the model and the system still works. Swap the context and it stops being useful. 4. Governance creates trust. Enterprises don’t trust intelligence. Enterprises trust controls. Identity, audit, evals, rollback, evidence. Governance is what earns the right to automate — and it’s liberating rather than restricting, because it’s what lets you say yes. 5. Metrics create permission. Nobody should trust an agent because a demo looked impressive. Trust comes from numbers you can run yourself. If only the vendor can produce the number, it’s marketing. If you can query it, it’s a metric. The climb, and the one thing that changes at each rung Here’s the elegant part. As an agent matures, the thing that changes isn’t how clever it is. It’s what the human reviews. Rung What the agent does What the human reviews Crawl Suggests. A human still does the work. Their own work Walk Does the work one step at a time, asking before each action. Every step Run Completes whole tasks and hands back a change to approve. The diff Fly Fixes, deploys to test, validates the outcome itself, posts the evidence. The outcome And between Run and Fly sits the review wall. When an agent produces hundreds of changes a month, reviewing someone else’s diff is nearly as hard as writing it yourself. That’s where teams plateau — not because the agent isn’t capable, but because the humans became the bottleneck. Fly is how you get past it: you move the unit of human review from the diff to the outcome. Hold that thought — we’ll come back to it, because it’s the most exciting part of the whole journey. Getting there is a design problem before it’s a technology one. Agents that climb were built to climb. So let’s start where every one of them starts — how you scope it, what you teach it, and what you connect it to. Part One — Designing your agent Before you start: what you’ll want in place The good news is that this list is short, and you almost certainly have most of it already. There’s no platform to stand up first. Diagnostic logs turned on for the services you care about. An agent can only reason about what your system actually emits. Telemetry the agent can query. It doesn’t need to live in one place — most estates have it spread across several platforms, and that’s completely fine. What matters is that each of those places is reachable and queryable. This is what turns “something is wrong” into “here’s why.” Read access to the sources that hold the answers — your subscriptions, your repositories, your incident history, your ticketing system. An identity for the agent, with permissions scoped the way you’d scope a new team member’s on day one. A repository for agent artifacts. Skills, custom agents and tool definitions are production code. They deserve version control from the first one. That’s it. Nothing here is agent-specific — it’s the same hygiene that makes a system operable by humans. If your on-call engineer can answer a question at 3am, your agent can too. Step 1: Scope it — how many agents do you actually need? Good news first: fewer than you think. Teams often assume one agent per team, and that’s usually wrong. Five considerations decide it: 1. Fixed cost. Every Azure SRE Agent carries a small baseline charge just for existing — think of it as keeping the lights on so the agent is ready the instant something happens. That means consolidating where you can is genuinely good hygiene: fewer agents, each with a clear job, means every dollar goes toward outcomes rather than idle capacity. 2. Context. This is the big one. An agent is powerful because it holds a complete picture of a system. Split one application’s context across two agents and you’ve halved what each of them knows — usually the half that mattered. Don’t split an app’s context. 3. Data residency at rest. If data legally cannot leave a geography, that’s a boundary, and it’s a real one. Separate agent, separate region. 4. Team and organisational access boundaries. Genuinely different permission sets and genuinely different blast radius deserve genuinely different agents — each with its own identity, so least-privilege actually means something. 5. At least one dev agent. Always keep a non-production agent to test changes before they touch prod. Same reason you have a staging environment. That’s the whole list. Everything else, consolidate. Ideally, this is what it looks like. A single agent per application or product module — never splitting one across two. Explicit production and test agents. A regional agent wherever residency genuinely demands one. Every split maps to one of the five considerations above. The one thing to protect in every split decision is context. When two agents need to reason about the same problem, each one only has half the picture. If you absolutely must split context — say your org structure or access boundaries require it — plan for those agents to talk to each other so the full context is still reachable. Multiple patterns work. A dedicated infrastructure team that manages AKS clusters and only cares about the upkeep of that infrastructure? A single agent scoped to those resources makes perfect sense — they have a clear domain, a clear boundary, and a clear job. An application team whose service depends on a database? Give that application’s agent access to the database rather than standing up a second agent and splitting the problem’s context across two. There’s no single right layout — the principle is: keep the context of the problems you’re trying to solve together. Step 2: Teach it — context is king This is where the magic actually comes from, and it’s the step most worth over-investing in. Your agent needs five kinds of context: Source code — what the system actually does Production telemetry — what it’s doing right now Institutional knowledge — how your team really operates Previous incidents — what broke before, and why Skills and tools — how to act on any of it Connect the first two and you have a competent log reader. Add the middle two and it starts sounding like someone who’s worked on your team for a year. How you actually bring context in: Connect the real sources — subscriptions and their telemetry, your repositories, your incident history, your ticketing system. Knowledge as markdown in a repo. This is the pattern that works best. LLMs are exceptionally good with markdown files, and putting your knowledge in a connected repository means it’s version-controlled, reviewable, and — critically — updatable by the agent itself. Your scheduled tasks can automatically improve these files as the agent learns, closing the loop between insight and artifact. Connect external knowledge via MCP. If your team’s knowledge lives in Confluence, SharePoint, or another platform, connect it as an MCP server rather than migrating it. The agent queries it at runtime. Upload documents. Architecture diagrams, architecture decision records, design docs, onboarding guides. It reads all of it. Just talk to it. This is the underrated one. Tell it how your system works. Explain that “the blue cluster” means the EU stamp, that Tuesday deploys are riskier, that this alert is always noise before 8am. Ask it to summarise your architecture back to you — where it’s wrong, you’ve found a context gap, and you can fill it on the spot. One thing to be deliberate about: don’t dump everything. If you’ve accumulated years of documentation, runbooks, and tribal knowledge, resist the urge to pour all of it in on day one. Garbage in, garbage out. The agent will work with whatever you give it, and outdated or contradictory knowledge makes it worse, not better. Curate intentionally. Start with the knowledge that matters for the scenarios you’re tackling first, make sure it’s current, and grow from there. Teaching an agent feels remarkably like onboarding a sharp new hire. The difference is it reads everything you give it, overnight, and never forgets. And you don’t have to teach it everything at once. This is the part worth saying plainly, because the size of an estate can feel paralysing. You are not trying to pour your entire organisation into an agent before it becomes useful. You teach it the parts that matter, and you do it organically — one solution at a time. Start from your toil. Write down the things that actually wake your engineers up, the tasks your team does over and over, the investigation everyone dreads because it takes four hours and always ends the same way. Pick the top one. Coach the agent through that single scenario the way you’d coach a new engineer through their first on-call shift — the context it needs, the sources it should check, the judgement calls that aren’t written down anywhere. Then do the next one. Each scenario you teach is narrow, which means it’s cheap and fast to get right. And each one compounds: the context you gave it for scenario one is already there when you start scenario three. Six weeks in, you’ll notice it knows your system well enough to help with things you never explicitly taught it. Don’t boil the ocean. Boil the thing that’s burning you. Step 3: Create the artifacts — understand the primitives, then build Before you build anything, it helps to understand the three primitives you’re building with — because the difference between them is what gives you consistency. The meta agent is your agent out of the box. It has the LLM’s world knowledge plus all the context you’ve connected — your code, your telemetry, your documents, your memory. It’s versatile: it can investigate, reason, plan, and act. But it’s non-deterministic. Ask it the same question twice and it might take different steps, in a different order, and format its findings differently. That’s fine for exploration. It’s not fine for the 3am incident that needs to run the same way every time. Custom agents give you that consistency. A custom agent is a specialist with its own instructions, its own tools, and its own scope. Think of it as the what — the plan. The Zava learning lab’s learning-ops agent is a good example: it tells the agent exactly how to handle an incident — what to check, in what order, what to post, how to format the report. Every run follows that plan. Custom agents are scoped — they’re only invoked when you specifically ask for them (via /agent in chat, or via a response plan or scheduled task). That scoping is itself a governance lever, which we’ll come back to in Step 5. Skills are the how. They’re reusable procedures that teach the agent how to do a specific thing — query your Kusto cluster, restart a container app, read an IcM incident, run a particular diagnostic sequence. Skills are universal: both the meta agent and any custom agent can use them. A single skill written once is available everywhere. The key insight: the meta agent alone will get you far, but it won’t do the same ten steps next time, or in the same order, or produce the same kind of report. Custom agents and skills give you that repeatability — and repeatability is what you need for automation you trust. Now — how you actually create them. There are exactly two on-ramps, and which one you take depends on whether you already know the answer. Path A — you have a runbook (a known problem). Throw the runbook at the agent and ask it to build the artifacts: the skill, the custom agent, the tool definitions. Review what it produces, refine it, and have it cut a pull request into your repository. A procedure you’d have hand-written over a week arrives in an afternoon. Path B — you don’t (a complex or unknown problem). Work it interactively. Hand the agent the live problem and investigate together. Let it dig, watch it waver, correct its wrong turns, point it at the source it didn’t know about. When you finally crack it — that’s the moment. Ask it to turn what just happened into a custom agent, a skill, a tool. The next time that problem appears, it’s automatic. Path B is the one people don’t expect, and it’s the more valuable of the two. Your best artifacts aren’t written at a desk. They’re precipitated out of real investigations that worked. Every hard incident you solve together becomes an incident you never have to solve again. This isn’t unusual, either — teams everywhere now run skill-creating skills, agent-building skills, and MCP-server-building skills. Using the agent to build more of the agent is simply how this works now. Step 4: Test it — playground first, then non-prod Treat agent artifacts like code, because they are. Start in the playground — a safe space to exercise a skill against realistic inputs without touching anything. Then promote to a non-production system where the agent can act for real against resources that don’t matter. You won’t get everything right before production, and you don’t need to. Get the critical parts right — the core logic, the safety boundaries, the happy path — and then put it on real work. That’s where you find out what it’s actually like. From there, use evals to improve continuously. Every real run produces one, and reading them is how you find out whether the artifact holds up outside the playground. Part Two covers what to do with that signal — including how to wire it back into the artifacts automatically. And because these are production artifacts, they belong in source control from the beginning — with review, diffs, and rollback. Step 5: Govern it — earn the right to automate Remember principle four: governance creates trust. This is where you make it concrete. Before anything touches production, you decide who the agent is, what it’s allowed to do, what rules gate its actions, and what checks run in context. These controls layer on top of each other, and together they’re what lets you say yes to autonomy with confidence. Identity and access Your agent authenticates as a managed identity — system-assigned or user-assigned — and you scope it with normal Azure RBAC at the subscription, resource group, or management group level. Out of the box, Azure SRE Agent offers two access tiers: Reader — read-only access to your resources. This is all your agent needs for investigation, root-cause analysis, and reporting. It’s the right starting point. Privileged — adds resource-type-specific contributor roles (like Container App Contributor) based on what’s detected in your environment. This is what the agent needs for actions: restart, scale, rollback, configuration changes. Most teams start with Reader and add Privileged only on the resource groups where they want the agent to act. If neither tier fits — maybe you want the agent to restart App Services but never touch network rules — create a custom RBAC role with exactly the permissions you need and assign it to the agent’s managed identity. The agent’s identity is its security boundary; treat it the way you’d treat any other service principal. Run mode This is the single biggest lever. In Review mode, the agent proposes actions and waits for a human to approve each one. In Autonomous mode, it acts on its own within the bounds you’ve set. Most teams start every scenario in Review, watch it work for a few weeks, and then selectively move well-understood scenarios to Autonomous. That graduation is the Crawl-to-Run climb in practice. There’s a third thing worth understanding: what happens when the agent doesn’t have the privileges to act. If the agent’s managed identity lacks the RBAC permission for an action, it doesn’t fail silently — it asks. An Administrator can grant temporary elevation via on-behalf-of (OBO), which lets the action execute using the human’s credentials rather than the agent’s identity. This is the human-in-the-loop pattern at its most precise: the agent does the investigation, proposes the action, and a human with the right privileges authorises it in context. The agent never accumulates permissions it doesn’t need permanently, and the audit trail shows exactly who approved what. Tool controls Every tool the agent has access to can be set to one of three states: Allow — the tool executes without asking. Good for safe read operations you’re confident about. Ask — the tool pauses for human approval before running. Good for actions you trust but want to see before they happen. Off — the tool is completely disabled. The agent can’t use it at all. This is the first governance layer — simple, per-tool toggles. Need the agent to query your Kusto cluster but never write to it? Allow the read tool, turn the write tool off. Need it to restart an App Service but never delete one? Allow the restart, turn delete off. This is how you define the agent’s basic operational envelope. Some actions — like restarting a healthy service or scaling up a container app — may not need any gating at all. Others — like modifying a network security group or changing a database configuration — absolutely do. The right setting depends on how much autonomy you want the agent to have and how much you want a human involved. There’s no single right answer; there’s the answer that fits your comfort level today, and it can change tomorrow. Tool access policies Tool controls are per-tool on/off switches. Tool access policies go deeper: they let you write pattern-based rules that match tool names and even command arguments. Examples: - “Deny any command containing delete “ — bash(az * delete *) matches any az ... delete ... command regardless of which tool executes it. - “Allow all monitoring queries without approval” — so your read-only investigation flow runs uninterrupted. - “Ask before any deployment command” — so deploys always pause for a human. Policies apply at three scopes: Scope Who sets it What it can do Global Admin Allow, Ask, or Deny — across the entire agent Custom agent Admin or author Allow only — widen access within global boundaries for a specific custom agent Thread Any user Allow only — temporary override for one conversation The key principle: a global deny cannot be overridden by a lower scope. A custom agent or thread can widen access but never weaken a global deny. This means an admin can set a floor — “nobody, human or agent, can run a delete command” — and know it holds. Hooks Policies match patterns. Hooks evaluate context. This is the layer that handles the cases patterns can’t express. Four hook events: Event When it fires What you’d use it for Start A new thread begins Seed context, validate the trigger, tag the conversation PreToolUse The agent is about to call a tool Inspect the arguments, allow/deny/ask based on what you see PostToolUse A tool just returned Audit the result, flag sensitive output, trigger follow-up Stop The agent is about to finish Validate that the work is complete, reject and keep the loop running if it’s not Hooks can be prompt-based (an LLM judge evaluates the situation) or command-based (a bash or Python script runs deterministically). They sit at the highest priority in the decision chain — a hook allow overrides everything below it, and a hook deny blocks immediately. Here’s where it gets practical. Say the agent is investigating a performance issue and discovers a corrupt database index. It decides to drop and rebuild the index — exactly what a DBA would do. But you don’t want the agent to ever drop a table. How do you allow one and prevent the other? Three layers, working together: Tool access policy: a global deny on any command matching *DROP TABLE* . Pattern-based, unconditional, always enforced. Custom agent scoping: create a database-maintenance custom agent with instructions that explicitly say “you may drop and rebuild indexes; you may never drop tables.” The custom agent only has the database tools it needs — nothing else. The blast radius is contained by design. PreToolUse hook: a script that inspects the actual SQL command. It allows DROP INDEX , denies DROP TABLE , and can require approval for any DDL command above a risk threshold you define. The policy catches the obvious pattern. The custom agent constrains the scope. The hook handles the edge cases that patterns miss. This is the full stack working together. Scoping automations to a custom agent is one of the most powerful governance levers you have. Instead of giving the meta agent broad database access, you create a specialist with its own tools, its own instructions, its own tool access policies, and its own hooks. The meta agent can investigate and recommend. Actual database changes only happen through the custom agent, with guardrails purpose-built for that domain. Who can configure the agent RBAC extends to the agent itself. Four built-in roles govern who can do what: Role What they can do Administrator Full control — approve actions, manage connectors, configure hooks and policies, change run mode, deploy artifacts Author Create custom agents and tools, upload knowledge, author response plans and incident configurations, manage connectors Standard User Chat, run diagnostics, request actions, create scheduled tasks Reader View conversations and configuration — read-only Separation of duties applies here the same way it applies everywhere else: the person who builds a skill shouldn’t necessarily be the person who promotes it to Autonomous. Only Administrators can approve infrastructure actions — Standard Users and Authors cannot. And only Administrators can create hooks and tool access policies, because those controls govern what every other role can do. How it all fits together These controls layer: identity sets the boundary, run mode sets the default posture, tool controls set the envelope, policies set the rules, and hooks handle the judgement calls. They’re not restrictions — they’re what lets you say yes to progressively more autonomy, with evidence that each step is safe. A useful mental model: governance isn’t a gate you pass through once. It’s the dial you turn up gradually, scenario by scenario, as each one proves itself. The agent that’s fully autonomous for certificate renewals and fully gated for database changes isn’t half-governed — it’s precisely governed. Step 6: Promote to production — your agent configuration is code This is the step that turns your dev agent into a repeatable, auditable production system. Your dev agent is your workshop — the place where you experiment, teach, build artifacts, and iterate until things work. Once they do, the configuration you’ve built there becomes your golden state: the skills, custom agents, tool definitions, knowledge base, response plans, scheduled tasks, and memory that together define how this agent operates. All of it can be declared, versioned, and deployed programmatically: Infrastructure as Code — define agents and their configuration in Bicep or Terraform, same as any other Azure resource. Your agent’s entire shape lives in a template. CLI and REST API — create, update, and configure agents with az commands or direct API calls. Useful for CI/CD pipelines that promote artifacts from dev to prod as part of a normal release. Artifact repositories — skills, custom agents, and tool definitions are files in your repo. Push them to your production agent the same way you push code: through a pipeline, with review, with rollback. This means everything your dev agent learned can flow to production through your existing change process. A new skill gets built and tested in dev, reviewed in a PR, merged, and deployed to the production agent by the pipeline — no portal clicking, no manual replication, no drift. It also means consistency across a fleet. If you run multiple agents — per module, per region, per environment — they can all be powered from the same artifact repository. Update the skill once, deploy it everywhere. The agent-per-module pattern from Step 1 works precisely because IaC makes it cheap to keep them consistent. And when something goes wrong, you roll back the same way you roll back anything else: revert the commit, redeploy the template, and the agent is back to its last known-good state. Step 7: Wire it up — an artifact does nothing until something calls it A skill sitting in your repository doesn’t do anything until it’s bound to a trigger — something in your world that fires it without a human deciding to. It’s an easy step to skip, and worth not skipping. There are three you’ll use constantly: Incident response plans. Attach the artifact to an alert class, so that when that alert fires, that skill runs. This is the single highest-value wiring you can do. Scheduled tasks. For work that should happen on a rhythm rather than in response to a signal — the nightly sweep, the weekly review, the monthly audit. HTTP triggers. For everything else in your ecosystem that wants to start agent work: a pipeline stage, a webhook, a work item transitioning to Ready. Here’s why this matters more than it looks. Remember the climb — Crawl, Walk, Run, Fly. Teams often assume they’ll graduate by making the agent smarter. They won’t. A brilliantly capable agent that only ever runs when someone opens a chat window is still at Walk, permanently, because a human is still initiating every piece of work. Capability doesn’t promote you. Triggers do. Wiring is the actual line between Walk and Run. Cross it deliberately. Step 8: Mimic your production process Here’s the step that turns a clever assistant into an operations teammate: the agent should follow the process your humans already follow. Not a parallel workflow. The workflow. An incident arrives → the agent acknowledges it, so everyone can see it’s owned → it investigates, pulling telemetry, correlating recent deploys, checking dependencies → it posts its findings to the incident, where the on-call already lives → it proposes or applies the mitigation → it updates status → it documents the root cause → it resolves. That’s end-to-end incident investigation and remediation, in the same lifecycle, the same ticket, the same channel your team already watches. No new tool to learn. The on-call engineer just notices the work is already done. And this covers more ground than people expect. Most teams think of incidents in three flavours: outages, where something is down; performance issues, where something is slow or degrading; and manual errors — the config change somebody made by hand at the end of a long day, the setting that got flipped in the portal and never made it back into source control. That third category is the one teams under-count and the one agents are unusually good at, because catching it is mostly a matter of comparing what’s running against what was declared — patient, unglamorous work that nobody wants to do at 2am. A worked example. The Zava learning lab agent runs exactly this loop — incident-triggered investigation and remediation across a live estate. Looking at its real runs: a typical end-to-end run takes about 32 tool calls and lands in a 5-to-12-minute band, with a median around 8.6 minutes from signal to finished work. Roughly five minutes to a mitigation, ten to a full resolution. Compare that with what it replaces: a page, someone waking up, ten minutes to orient, a scramble across dashboards, a colleague pulled in for a second opinion. Ninety minutes and two engineers, on a good night. A second example, from the other end of the lifecycle. A large software vendor running a multi-region estate — dozens of subscriptions, tens of thousands of resources — wired their agents into delivery rather than just incidents. A work item moves to Ready, and that’s the trigger. A custom agent picks it up, writes the code, opens the pull request, deploys the change to a test environment, and runs the validation suite against it — synthetic checks and browser-driven tests, the same ones a human would have run. Then it posts the result on the original work item. The engineer’s first involvement is reading an outcome that already has evidence attached. Same five design considerations from Step 1 govern their fleet: one agent per product module, explicit prod and test agents, and one extra agent in-region purely for data residency. These two examples bookend the same idea. One agent closes incidents; the other closes work items. Both were built the same way — context first, artifacts second, triggers third. Beyond incidents — the agent as a proactive partner It’s easy to think of agents as incident responders, because that’s where the value is most visible. But the best teams use them just as heavily when nothing is broken. Understand your system better. Ask the agent to explain your architecture back to you. Ask it what depends on what. Ask it to map the blast radius of a change you haven’t made yet. Ask it to find every resource in your estate that hasn’t been touched in six months, or every configuration that drifts from what’s declared in code. These aren’t investigations — they’re conversations. And the answers come grounded in your actual telemetry and source code, not a wiki page that was last updated in 2023. Get recommendations you didn’t ask for. Set up a scheduled task that reviews your infrastructure weekly and surfaces opportunities: resources that could be right-sized, SKUs that could be downgraded, replicas that could be consolidated, regions where you’re paying for redundancy you’re not using. The same task can check for reliability gaps: services without health probes configured, storage accounts without soft-delete enabled, deployments running without a rollback path. The agent sees all of it because it already has the context — it just needs a reason to look. Run proactive reliability reviews. Ask the agent to evaluate your service against the Azure Well-Architected Framework, or against your own best practices checklist. Ask it to compare your production configuration against your staging configuration and tell you what’s different — and whether the difference is intentional. Ask it to trace a customer-facing flow end to end and identify the single points of failure. Shift from reactive to preventive. This is the compounding value of the platform. Every incident the agent resolves teaches it something about your system. Over time, the agent that started as an incident responder becomes the thing that prevents incidents — because it’s seen enough of your system to spot the preconditions before they become symptoms. The cost analysis that catches the runaway resource before finance does. The capacity check that raises the quota before the 429s start. The configuration audit that catches the drift before it becomes an outage. The agent that only responds to incidents is useful. The agent that also prevents them is transformative. Part Two — Running it well Two loops, not one queue Once agents are working real incidents, the question stops being can it and becomes which ones. Make that a routing decision rather than a judgement call. Run two loops: an agent loop and a human loop. Every incident class is registered to one of them, so where an incident lands is a property of the class, decided in advance — not something someone works out at 3am. Promotion between loops is deliberate. Moving a class into the agent loop is a reviewable change with a written gate, and a written demotion trigger for when it stops earning its place. The safety net belongs to the incident system, not the agent. Define the conditions your process cares about — not acknowledged within x minutes, not mitigated, not handed off — and let the incident system escalate to the human loop when they’re breached. An agent that has stalled can’t be relied on to report that it has stalled; something outside it has to notice. And escalation should carry the work with it, so the human arrives to evidence already gathered rather than a blank page. Cost: know what an outcome costs One of the quietly wonderful things about agentic operations is that you can finally price an outcome. Agents consume metered units, and every unit maps to work. So instead of “what does our on-call cost?” — a question nobody has ever answered honestly — you get: this incident, end to end, cost this much. For the loop above: an entire incident investigated, mitigated, documented and resolved, in minutes, for under $30. Now price the alternative. Two engineers, ninety minutes, out of hours, plus the context-switch tax on whatever they were doing, plus the meeting the next morning to explain what happened. You’re comparing tens of dollars against hundreds — and that’s before you count the ninety minutes of customer impact that didn’t happen because the fix landed in eight minutes instead of an hour and a half. Multiply by your monthly incident volume and it stops being a cost conversation and starts being a capacity one. The question isn’t “can we afford this?” — it’s “what do we do with the engineering time we just got back?” But be careful not to measure the return only in money and minutes, because the larger part of it never shows up on an invoice. It’s the engineer who slept through the night. It’s the on-call rotation people stop quietly dreading, and the weekend that stayed a weekend. It’s the postmortem that never had to be written — and with it, the whole uncomfortable ritual of working out whose change it was — because the problem was caught and fixed while it was still one degraded instance rather than a customer-visible outage. Teams feel that long before finance notices the bill. Morale has always been a reliability metric; it just never had a dashboard. A few practical habits: - Set a consumption budget deliberately, and know who can raise it and how fast before you need them. - Watch cost per resolved outcome, not total spend. Total spend rising while cost-per-outcome falls is exactly what success looks like. - Use the right trigger for the job. Incident response plans and HTTP triggers bring the work to the agent the instant it matters. Scheduled tasks handle the work that belongs on a rhythm — the nightly sweep, the weekly review. Both have a place; the key is matching each scenario to the trigger that fits it. Live Reports — the UI beyond chat Most people first encounter their agent in a chat window, and chat is genuinely good for investigation and conversation. But it’s not the only surface — and for a lot of operational work, it’s not the best one. Live Reports are interactive HTML applications built by the agent and hosted on the platform. They call the same tools the agent uses — Kusto queries, Azure CLI, incident APIs, connector tools — and render the results as charts, tables, grids, and interactive controls. They’re not screenshots of a past conversation. They’re live applications that re-fetch data every time you open them. Here’s the part worth understanding from a cost perspective: the agent spends tokens when it builds the report — the conversation where you describe what you want. After that, opening the report calls the tools directly. No LLM is involved, so there’s no ongoing token consumption. Build it once, open it a hundred times, share it with your team — the investment is in the creation, and it pays off every time someone opens it. Think of Live Reports as the place where your agent’s intelligence becomes a permanent, shareable surface rather than a conversation that scrolls away. Scenarios where Live Reports shine: Morning triage view. What happened overnight? Which incidents are open, which were resolved autonomously, which need human attention? A single page your on-call opens at the start of every shift — always current, no queries to run. Agent fleet health. Across all your agents: which are healthy, which have degraded tool reliability, which haven’t run in a week? Per-tool success rates, outcome counts, cost-per-resolution trending. The monitoring dashboard you’d otherwise build in Grafana, except it’s already wired to the data. Governance and compliance. NSG audit results, CVE exposure by service, resource compliance against your policy baseline. The report that used to take two engineers a day to compile — now it’s a page that’s always current. Cost analysis. Per-agent spend, per-outcome cost, consumption trending with visual charts. The data that makes the cost conversation in Part Two actually work. On-call handover. A shift handoff report: what happened during this rotation, what’s still pending, what to watch. Built once, regenerated for every handover. Stakeholder status pages. Service health for leadership or customers — uptime, incident summary, SLA adherence — without exposing the underlying tools or conversations. Interactive explorers. Not just viewing data but acting on it. A compliance report where you can drill into a finding and ask the agent to open a remediation PR, right from the report surface. The pattern is the same every time: you tell the agent what you want to see, it builds the report, and from that point forward the report is a zero-cost, always-current application that anyone on your team can open. It’s the agent’s intelligence crystallised into a surface that doesn’t need the agent to be running. Monitor the agent You’ll want a few different lenses, because each sees something the others can’t: Layer What it gives you Live reports Your measurement dashboard — autonomy by scenario, throughput, tool reliability — refreshed from your own connectors every time you open it Scheduled tasks The agent reporting on itself: a weekly health narrative, and the loops that keep artifacts current Your own observability platform Independent health and reliability monitoring outside the agent — the layer that still works when the agent doesn’t Foundry Control Plane Auto-discovers your SRE agents across the subscription: status, error rate, run counts, plus start/stop/block lifecycle control, governed by normal Azure RBAC Agent 365 Organisation-wide registry, governance and security posture across every agent platform you run. Agent 365 is generally available; SRE Agent integration into it is on the roadmap One field-tested tip: track tool failure rate per tool, not in aggregate. The overall success rate in large estates typically sits above 98%, which is reassuring — but it can mask a single connector that needs a configuration fix. Watching each tool individually lets you catch those early, and the fix is usually straightforward: a stale token, a permission gap, a connector that needs reconnecting. Knowledge, evals and learning — insist on these Context isn’t a one-time setup. It’s a living asset, and it’s the thing that compounds — but only if your platform is built to let it. This is the section where what you’re running starts to matter a great deal, so it’s worth being direct about what to demand. Insist on an agent that learns without being told to. The common failure mode of agentic tooling is that all the good material stays in the chat thread. Someone works a hard problem with the agent at midnight, finally cracks it, and the reasoning evaporates when the tab closes. What you want instead is derived learning: the agent distils what it just worked out — the query that got there, the dead end worth avoiding, the service that behaves nothing like its documentation — and files it as durable, structured knowledge on its own, without anyone remembering to write it down. Azure SRE Agent does this automatically. Every investigation deposits something. What still needs your attention is the round trip to the original source of truth. Derived learning lives with the agent. Your runbook, your architecture note, your alert definition lives in your repository — and that’s the copy your humans read. Wire the automation that pushes a learning back into the original artifact as a pull request, so the knowledge doesn’t quietly fork into two versions. This is the single most valuable piece of plumbing most teams haven’t built yet. Insist on evals that run forever, not once. Evals get widely misread as a pre-production gate: test the skill, it passes, it ships, done. That’s the smaller half of the value. The bigger half is relentless — continuously evaluating the agent’s real runs in production. Did it stay in scope? Did it reach the right conclusion? Did it stop and ask when it should have? Did that skill quietly start failing at step four last Tuesday? Real traffic finds things no test suite will, and it finds them on your actual estate rather than on a fixture. Then close the loop, so eval results become work rather than a report nobody opens. Azure SRE Agent ships this as a first-class loop: scheduled tasks that watch the eval signal, notice the degradation, and act on it. Self-improvement — where it gets fun Which is where something rather lovely happens: the agent starts improving itself. It notices a runbook is out of date and updates it. It sees a skill failing at the same step and rewrites that step. It spots a recurring investigation and proposes a new custom agent to own it. It watches its own eval scores and opens a pull request against the artifact that slipped. Teams run learning-loop agents alongside their fleets, and watchdog agents that review other agents’ work. Every completed task should make the next task easier. That’s the flywheel — and it only turns when all three pieces are present: knowledge that accumulates by itself, evals that keep scoring real work, and automation wired to act on both. Put them together and the system stops being something you maintain and starts being something that maintains itself. Part Three — The Zero Ops journey: the art of the possible Now the fun part. Here’s what each rung actually feels like, across the scenarios teams really run. Crawl — the agent suggests, you do the work You’ve connected context and you’re asking questions. It’s already useful: “Which of these 40 alerts overnight actually mattered?” — and it tells you, with reasoning. At this rung the governance sweep produces its first report: here are your idle resources, here are the network rules that don’t match policy, here are the CVEs you’re exposed to. Just a list — but it’s a list nobody had time to produce before, and it took four minutes. The certificate scan tells you what expires in the next 90 days. The cost analysis names your top ten spenders and why they moved. The change reviewer reads an incoming change request and tells you, in plain language, what it actually touches and what depends on it — the blast-radius analysis somebody used to do by hand in a change advisory board meeting. You still do all the work. But for the first time, you can see everything. Walk — the agent does the work, one step at a time Now it acts, asking before each step. This is where investigation and root-cause analysis come alive. An alert fires and the agent has already pulled the telemetry, correlated the recent deployment, checked the dependency, and posted a probable cause on the incident — before the on-call has finished reading the title. The question responder starts answering “is the EU region healthy?” in your team channel, with evidence. The governance sweep grows a spine: it doesn’t just list the orphaned resources, it recommends what to do about each. The CVE report becomes a prioritised remediation plan. The change reviewer stops describing the change and starts drafting it — the implementation plan, the validation steps, and the rollback procedure, written before anyone approves anything. You approve every step. It feels slow. It is also where you discover exactly what your agent is good at — and every gap you find becomes tomorrow’s artifact. Run — the agent completes whole tasks; you review the change Triggers are wired now — incidents, webhooks, schedules — and work starts without you. This is the rung where the 3am page stops arriving. The alert-class handler takes a whole class end to end: fires on arrival, investigates, applies the safe mitigation — restart, scale up, roll back the release — documents it, resolves it. You read about it in the morning. This is the rung where the word self-healing finally earns its place. It’s worth being precise about what it means, because it’s a phrase that gets stretched: self-healing is when the agent detects a known failure class, decides on the response, and acts on it within bounds you pre-approved. Not “the agent does whatever it thinks best.” The class is chosen by you. The safe actions are enumerated by you. The agent’s contribution is that it does the work at 3am, correctly, without waking anyone — and tells you exactly what it did. And notice that this is granted per alert class, never per service. It’s completely normal for one fleet to run some classes at near-total autonomy while other classes sit at a deliberate zero, because nobody’s ready yet. That’s not inconsistency. That’s the control working. The capacity agent sees the quota curve heading for a wall and raises it before anything breaks. The certificate agent opens the renewal PR on schedule. The maintenance agent handles the planned work that used to eat somebody’s weekend — the scheduled patching round, the index rebuild, the node pool rotation — running it in the window, verifying it landed, and reporting on it. The change agent executes the approved change in non-production, validates it, and raises the pull request and the change record together. The governance sweep stops recommending and starts acting — opening pull requests against your infrastructure-as-code to close the findings it used to just report. The CVE backlog that only ever grew? It starts going down, because something is working it every single day. And the work-item loop appears: a backlog item goes in, a custom agent writes the code and opens a pull request. You review the diff. Which is exactly when you meet the review wall. Fly — the agent proves the outcome, and improves the system Fly is not “the agent can execute.” It’s two much better things. Fly, part one: the agent can prove the outcome is correct. It builds the fix. It deploys it to a test environment. It runs the validation itself — synthetic checks, browser tests, the full suite. Then it posts the evidence. You stop reviewing the diff and start reviewing the outcome. That’s how the wall comes down. Now the work-item loop closes completely: backlog item → code → deploy → tested → evidence posted. The release-safety agent doesn’t just roll back after an incident, it gates the deploy beforehand — validating in test and blocking the bad one. The governance sweep pushes its own fix to production, having proven in test that it works. And your standard changes — the well-understood, pre-approved, thousand-times-executed ones — get carried out in production end to end, validated, and the change record closed with the evidence attached. The change advisory board stops reviewing procedure and starts reviewing outcomes, which is what it always wanted to be doing. Fly, part two: the agent improves the system. It learns from every incident. It improves knowledge, artifacts, runbooks, skills — and its own custom agents. The alert-quality loop turns inward: it notices which of your alerts are chronic false positives and opens PRs to fix the alert rules themselves. Your monitoring gets better while you sleep. The system gets better without a human editing it. And back to where we started That 3am page? A whole class of them doesn’t reach a person anymore. The fortnight-long cost review? A standing job that finds the waste and opens the PR. The zero-day marathon? The agent maps exposure across every service in minutes, patches in test, proves it works, and hands you evidence. The CVE backlog that only grew? Something works it every day, and it shrinks. That’s Zero Ops. Not zero humans — zero operations for humans. Your people set intent, govern the system, and validate outcomes. Everything below that line takes care of itself. The proof We run Microsoft this way. Every number here is queryable — these aren’t product metrics, they’re trust metrics. Today: - 2,500+ Microsoft engineering teams - 5,400+ agents running in production - Median time from alert to mitigation: 4 minutes To date: - 1.47M incidents processed - 221K mitigated autonomously - 1.25M enriched for the on-call engineer - ~1M developer hours saved* In the last month alone: - 480K incidents handled - 91K mitigated autonomously - 32M agent actions executed - 60K deploy-and-validate runs - 97.9% of agent work ran autonomously That last number is the one worth sitting with. Ninety-eight percent of the work happens with no human in the conversation — and the two percent that does reach a person is the two percent that genuinely needs judgement. In closing It isn’t about building a better agent. It’s about building a system that deserves autonomy. Context makes it intelligent. Governance makes it trustworthy. Metrics make it provable. When those three come together — agents operate, and humans govern. And the best news: you don’t have to build this from the ground up. Azure SRE Agent already carries these learnings — the context, the governance, the evidence, and the metrics — so your team can start today. Pick one scenario. Give it context. Teach it your system. Work a real problem with it, and turn what you learn into something that persists. Then do it again next week. Start your Zero Ops journey: aka.ms/sreagent · Resources and community: aka.ms/sreagent/links *AI-calculated estimate, based on a conservative earlier baseline.1.4KViews6likes0Comments
How Microsoft 365 built a platform engineering layer on AKS to ship faster at global scale
This Customer Zero story explains how Microsoft 365 built COSMIC, a platform engineering layer on top of Azure Kubernetes Service (AKS), to standardize how cloud services are deployed and operated at global scale. The goal was to eliminate repetitive infrastructure work for service teams, embed security and compliance by default, and enable developers to focus on delivering customer value instead of managing platform complexity.4.5KViews4likes0CommentsThe Agent that investigates itself
Azure SRE Agent handles tens of thousands of incident investigations each week for internal Microsoft services and external teams running it for their own systems. Last month, one of those incidents was about the agent itself. Our KV cache hit rate alert started firing. Cached token percentage was dropping across the fleet. We didn't open dashboards. We simply asked the agent. It spawned parallel subagents, searched logs, read through its own source code, and produced the analysis. First finding: Claude Haiku at 0% cache hits. The agent checked the input distribution and found that the average call was ~180 tokens, well below Anthropic’s 4,096-token minimum for Haiku prompt caching. Structurally, these requests could never be cached. They were false positives. The real regression was in Claude Opus: cache hit rate fell from ~70% to ~48% over a week. The agent correlated the drop against the deployment history and traced it to a single PR that restructured prompt ordering, breaking the common prefix that caching relies on. It submitted two fixes: one to exclude all uncacheable requests from the alert, and the other to restore prefix stability in the prompt pipeline. That investigation is how we develop now. We rarely start with dashboards or manual log queries. We start by asking the agent. Three months earlier, it could not have done any of this. The breakthrough was not building better playbooks. It was harness engineering: enabling the agent to discover context as the investigation unfolded. This post is about the architecture decisions that made it possible. Where we started In our last post, Context Engineering for Reliable AI Agents: Lessons from Building Azure SRE Agent, we described how moving to a single generalist agent unlocked more complex investigations. The resolution rates were climbing, and for many internal teams, the agent could now autonomously investigate and mitigate roughly 50% of incidents. We were moving in the right direction. But the scores weren't uniform, and when we dug into why, the pattern was uncomfortable. The high-performing scenarios shared a trait: they'd been built with heavy human scaffolding. They relied on custom response plans for specific incident types, hand-built subagents for known failure modes, and pre-written log queries exposed as opaque tools. We weren’t measuring the agent’s reasoning – we were measuring how much engineering had gone into the scenario beforehand. On anything new, the agent had nowhere to start. We found these gaps through manual review. Every week, engineers read through lower-scored investigation threads and pushed fixes: tighten a prompt, fix a tool schema, add a guardrail. Each fix was real. But we could only review fifty threads a week. The agent was handling ten thousand. We were debugging at human speed. The gap between those two numbers was where our blind spots lived. We needed an agent powerful enough to take this toil off us. An agent which could investigate itself. Dogfooding wasn't a philosophy - it was the only way to scale. The Inversion: Three bets The problem we faced was structural - and the KV cache investigation shows it clearly. The cache rate drop was visible in telemetry, but the cause was not. The agent had to correlate telemetry with deployment history, inspect the relevant code, and reason over the diff that broke prefix stability. We kept hitting the same gap in different forms: logs pointing in multiple directions, failure modes in uninstrumented paths, regressions that only made sense at the commit level. Telemetry showed symptoms, but not what actually changed. We'd been building the agent to reason over telemetry. We needed it to reason over the system itself. The instinct when agents fail is to restrict them: pre-write the queries, pre-fetch the context, pre-curate the tools. It feels like control. In practice, it creates a ceiling. The agent can only handle what engineers anticipated in advance. The answer is an agent that can discover what it needs as the investigation unfolds. In the KV cache incident, each step, from metric anomaly to deployment history to a specific diff, followed from what the previous step revealed. It was not a pre-scripted path. Navigating towards the right context with progressive discovery is key to creating deep agents which can handle novel scenarios. Three architectural decisions made this possible – and each one compounded on the last. Bet 1: The Filesystem as the Agent's World Our first bet was to give the agent a filesystem as its workspace instead of a custom API layer. Everything it reasons over – source code, runbooks, query schemas, past investigation notes – is exposed as files. It interacts with that world using read_file, grep, find, and shell. No SearchCodebase API. No RetrieveMemory endpoint. This is an old Unix idea: reduce heterogeneous resources to a single interface. Coding agents already work this way. It turns out the same pattern works for an SRE agent. Frontier models are trained on developer workflows: navigating repositories, grepping logs, patching files, running commands. The filesystem is not an abstraction layered on top of that prior. It matches it. When we materialized the agent’s world as a repo-like workspace, our human "Intent Met" score - whether the agent's investigation addressed the actual root cause as judged by the on-call engineer - rose from 45% to 75% on novel incidents. But interface design is only half the story. The other half is what you put inside it. Code Repositories: the highest-leverage context Teams had prewritten log queries because they did not trust the agent to generate correct ones. That distrust was justified. Models hallucinate table names, guess column schemas, and write queries against the wrong cluster. But the answer was not tighter restriction. It was better grounding. The repo is the schema. Everything else is derived from it. When the agent reads the code that produces the logs, query construction stops being guesswork. It knows the exact exceptions thrown, and the conditions under which each path executes. Stack traces start making sense, and logs become legible. But beyond query grounding, code access unlocked three new capabilities that telemetry alone could not provide: Ground truth over documentation. Docs drift and dashboards show symptoms. The code is what the service actually does. In practice, most investigations only made sense when logs were read alongside implementation. Point-in-time investigation. The agent checks out the exact commit at incident time, not current HEAD, so it can correlate the failure against the actual diffs. That's what cracked the KV cache investigation: a PR broke prefix stability, and the diff was the only place this was visible. Without commit history, you can't distinguish a code regression from external factors. Reasoning even where telemetry is absent. Some code paths are not well instrumented. The agent can still trace logic through source and explain behavior even when logs do not exist. This is especially valuable in novel failure modes – the ones most likely to be missed precisely because no one thought to instrument them. Memory as a filesystem, not a vector store Our first memory system used RAG over past session learnings. It had a circular dependency: a limited agent learned from limited sessions and produced limited knowledge. Garbage in, garbage out. But the deeper problem was retrieval. In SRE Context, embedding similarity is a weak proxy for relevance. “KV cache regression” and “prompt prefix instability” may be distant in embedding space yet still describe the same causal chain. We tried re-ranking, query expansion, and hybrid search. None fixed the core mismatch between semantic similarity and diagnostic relevance. We replaced RAG with structured Markdown files that the agent reads and writes through its standard tool interface. The model names each file semantically: overview.md for a service summary, team.md for ownership and escalation paths, logs.md for cluster access and query patterns, debugging.md for failure modes and prior learnings. Each carry just enough context to orient the agent, with links to deeper files when needed. The key design choice was to let the model navigate memory, not retrieve it through query matching. The agent starts from a structured entry point and follows the evidence toward what matters. RAG assumes you know the right query before you know what you need. File traversal lets relevance emerge as context accumulates. This removed chunking, overlap tuning, and re-ranking entirely. It also proved more accurate, because frontier models are better at following context than embeddings are at guessing relevance. As a side benefit, memory state can be snapshotted periodically. One problem remains unsolved: staleness. When two sessions write conflicting patterns to debugging.md, the model must reconcile them. When a service changes behavior, old entries can become misleading. We rely on timestamps and explicit deprecation notes, but we do not have a systemic solution yet. This is an active area of work, and anyone building memory at scale will run into it. The sandbox as epistemic boundary The filesystem also defines what the agent can see. If something is not in the sandbox, the agent cannot reason about it. We treat that as a feature, not a limitation. Security boundaries and epistemic boundaries are enforced by the same mechanism. Inside that boundary, the agent has full execution: arbitrary bash, python, jq, and package installs through pip or apt. That scope unlocks capabilities we never would have built as custom tools. It opens PRs with gh cli, like the prompt-ordering fix from KV cache incident. It pushes Grafana dashboards, like a cache-hit-rate dashboard we now track by model. It installs domain-specific CLI tools mid-investigation when needed. No bespoke integration required, just a shell. The recurring lesson was simple: a generally capable agent in the right execution environment outperforms a specialized agent with bespoke tooling. Custom tools accumulate maintenance costs. Shell commands compose for free. Bet 2: Context Layering Code access tells the agent what a service does. It does not tell the agent what it can access, which resources its tools are scoped to, or where an investigation should begin. This gap surfaced immediately. Users would ask "which team do you handle incidents for?" and the agent had no answer. Tools alone are not enough. An integration also needs ambient context so the model knows what exists, how it is configured, and when to use it. We fixed this with context hooks: structured context injected at prompt construction time to orient the agent before it takes action. Connectors - what can I access? A manifest of wired systems such as Log Analytics, Outlook, and Grafana, along with their configuration. Repositories - what does this system do? Serialized repo trees, plus files like AGENTS.md, Copilot.md, and CLAUDE.md with team-specific instructions. Knowledge map - what have I learned before? A two-tier memory index with a top-level file linking to deeper scenario-specific files, so the model can drill down only when needed. Azure resource topology - where do things live? A serialized map of relationships across subscriptions, resource groups, and regions, so investigations start in the right scope. Together, these context hooks turn a cold start into an informed one. That matters because a bad early choice does not just waste tokens. It sends the investigation down the wrong trajectory. A capable agent still needs to know what exists, what matters, and where to start. Bet 3: Frugal Context Management Layered context creates a new problem: budget. Serialized repo trees, resource topology, connector manifests, and a memory index fill context fast. Once the agent starts reading source files and logs, complex incidents hit context limits. We needed our context usage to be deliberately frugal. Tool result compression via the filesystem Large tool outputs are expensive because they consume context before the agent has extracted any value from them. In many cases, only a small slice or a derived summary of that output is actually useful. Our framework exposes these results as files to the agent. The agent can then use tools like grep, jq, or python to process them outside the model interface, so that only the final result enters context. The filesystem isn't just a capability abstraction - it's also a budget management primitive. Context Pruning and Auto Compact Long investigations accumulate dead weight. As hypotheses narrow, earlier context becomes noise. We handle this with two compaction strategies. Context Pruning runs mid-session. When context usage crosses a threshold, we trim or drop stale tool calls and outputs - keeping the window focused on what still matters. Auto-Compact kicks in when a session approaches its context limit. The framework summarizes findings and working hypotheses, then resumes from that summary. From the user's perspective, there's no visible limit. Long investigations just work. Parallel subagents The KV cache investigation required reasoning along two independent hypotheses: whether the alert definition was sound, and whether cache behavior had actually regressed. The agent spawned parallel subagents for each task, each operating in its own context window. Once both finished, it merged their conclusions. This pattern generalizes to any task with independent components. It speeds up the search, keeps intermediate work from consuming the main context window, and prevents one hypothesis from biasing another. The Feedback loop These architectural bets have enabled us to close the original scaling gap. Instead of debugging the agent at human speed, we could finally start using it to fix itself. As an example, we were hitting various LLM errors: timeouts, 429s (too many requests), failures in the middle of response streaming, 400s from code bugs that produced malformed payloads. These paper cuts would cause investigations to stall midway and some conversations broke entirely. So, we set up a daily monitoring task for these failures. The agent searches for the last 24 hours of errors, clusters the top hitters, traces each to its root cause in the codebase, and submits a PR. We review it manually before merging. Over two weeks, the errors were reduced by more than 80%. Over the last month, we have successfully used our agent across a wide range of scenarios: Analyzed our user churn rate and built dashboards we now review weekly. Correlated which builds needed the most hotfixes, surfacing flaky areas of the codebase. Ran security analysis and found vulnerabilities in the read path. Helped fill out parts of its own Responsible AI review, with strict human review. Handles customer-reported issues and LiveSite alerts end to end. Whenever it gets stuck, we talk to it and teach it, ask it to update its memory, and it doesn't fail that class of problem again. The title of this post is literal. The agent investigating itself is not a metaphor. It is a real workflow, driven by scheduled tasks, incident triggers, and direct conversations with users. What We Learned We spent months building scaffolding to compensate for what the agent could not do. The breakthrough was removing it. Every prewritten query was a place we told the model not to think. Every curated tool was a decision made on its behalf. Every pre-fetched context was a guess about what would matter before we understood the problem. The inversion was simple but hard to accept: stop pre-computing the answer space. Give the model a structured starting point, a filesystem it knows how to navigate, context hooks that tell it what it can access, and budget management that keeps it sharp through long investigations. The agent that investigates itself is both the proof and the product of this approach. It finds its own bugs, traces them to root causes in its own code, and submits its own fixes. Not because we designed it to. Because we designed it to reason over systems, and it happens to be one. We are still learning. Staleness is unsolved, budget tuning remains largely empirical, and we regularly discover assumptions baked into context that quietly constrain the agent. But we have crossed a new threshold: from an agent that follows your playbook to one that writes the next one. Thanks to visagarwal for co-authoring this post.14KViews7likes0CommentsFrom Coding Agents to Cloud Automation: AI-Assisted Customer Related Incidents in Azure Functions
On the Azure Functions team, we have been exploring how AI can help with investigating customer-reported incidents, root-cause analysis, and incident mitigation. This post shares our journey from early RCA agents to coding-agent-assisted investigations and cloud-hosted automation, and the lessons we learned along the way. Microsoft Engineering teams like Azure Functions work on production live site issues alongside customer reported issues, and these are one of the most important and rewarding parts of the job. On the Azure Functions team, complex customer incidents often require deep investigation. Engineers review Azure Data Explorer (Kusto) query results, source code, GitHub issues, previous incidents, public documentation, internal troubleshooting guides, and service-specific operational knowledge. The goal is always to mitigate customer impact quickly, identify the root cause, and feed what we learn back into the platform, and log improvement work items where needed. This work is valuable, but it is also time-consuming. As AI capabilities improved, we started asking a practical question: could AI help us reduce the operational burden of incident investigation while preserving the learning and engineering judgment that make those investigations useful? This is the story of how our approach evolved—from early RCA agents, to coding-agent-based workflows, and finally to cloud-hosted automation. Starting with AI-Assisted RCA Around May 2024, we began experimenting with an internal RCA agent together with a colleague from Microsoft Research. The first version was an informal approach towards the development of a formal service. It was a personal tool to help with our own investigations. The early experiments were very useful. We could give the agent an incident, let it run for several minutes, and then review the analysis. It did not always produce a perfect root cause, but it could run multiple queries, explore different hypotheses, and narrow the solution space enough to save time. Later, Azure SRE Agent emerged as a formal internal service. We contributed to it based on what We had learned from our earlier experiments. At that point, using AI to help resolve customer-reported incidents became a major focus for our team. What We Learned from Agentic Workflows The first generation of AI-assisted incident workflows were highly structured. The early experiments with the available models required careful design—especially for generating complex Kusto—we often needed to expose fixed Kusto queries as tools and let the model call them through well-defined parameters. Fig. 1 kusto query tool This made execution more predictable and reproducible, but it also revealed limitations. Detailed agentic workflows could work well when the incident matched the predefined path. Outside those paths, they were less flexible. Engineers also found it expensive to define and maintain those workflows, especially when the output felt only modestly better than a dashboard. Fig2. Agentic Workflow That experience taught us an important lesson: for complex operational investigations, flexibility matters as much as structure. The Shift to Coding Agents Near the end of 2025, we started using an internal tool using GitHub Copilot and skills, which made it possible to define and share VS Code workspaces. A workspace could include agent definitions, instructions, prompts, skills, MCP configuration, and repositories. Fig 3. GitHub Copilot internal tool The quality difference was significant. Combined with newer models, coding agents could investigate incidents much more flexibly. They could run Kusto queries, inspect code, use CLI and MCP tools, and iterate quickly by trying different paths. The team quickly adopted this model. With earlier workflow-based systems, engineers were reluctant to onboard because defining detailed workflows took effort, and the payoff was limited. With this internal tool, engineers started contributing agent definitions and skills because the system was easy to extend. Over time, the Azure Functions team accumulated a growing set of AI-ready materials which consisted of agent definitions, skills, MCP tools, instructions and repositories A number of lessons stood out. Lessons from Building AI-Ready Materials Prefer guidance over over-specification Modern coding agents are capable enough that they do not need every step spelled out. In fact, too many instructions can make the system brittle or stale. We found it better to provide concise guidance and point the agent to maintained sources of truth rather than embedding large amounts of detail directly into prompts. Manage context deliberately Instructions, tool definitions, conversation history, and tool outputs all compete for model context. Irrelevant or contradictory information can reduce quality. Tool design matters too: if a tool returns a large payload directly to the model, it can consume many tokens and confuse the agent. For large outputs, writing results to files and returning concise pointers often works better. Use files as durable memory Long-running investigations benefit from a simple pattern: create a plan and checklist file, update it as work progresses, and let the agent re-read it when needed. This helps the agent recover from context compaction and gives the investigation a durable state inside the workspace. Prefer references over inline knowledge Agent Definition and skills includes domain knowledge. Internal troubleshooting guides, product behavior, operational history, and expert judgment. Instead of placing all that information directly in prompts, we found it more effective to provide references to where the knowledge lives and guidance on when to use it. Make the right repositories visible Coding agents are strong at reading code. For our scenarios, multi-repository workspaces were especially powerful. When the agent could see related repositories together, it could trace behavior across components, understand dependencies, and produce better analysis. Domain knowledge matters most The best agent assets were often created by engineers with deep product and operational experience, not necessarily by AI specialists. The key skill was turning expert knowledge into instructions, references, and repository layouts that an agent could use. Facilitate and streamline domain knowledge updates Every incident not fully handled by an agent is a learning opportunity. Feed the context engineering flywheel: investigate, find gaps, update agent guidance, then re-test. It's important to keep this cycle quick and easy. Why We Moved Toward Cloud Automation Coding agents were extremely helpful, but they were still interactive tools. An engineer had to start the investigation and often guide it. For incident response, we wanted to go further. If an incident entered a specific feature area, the system should be able to start the investigation automatically, run the relevant analysis, and post useful results back to the incident. Even if the analysis was not perfect, narrowing the problem space early could reduce mitigation time. Some scenarios could eventually support automatic mitigation or automatic transfer to the right team. A local coding-agent workflow has advantages, especially because it can authenticate as the user. But as a foundation for reliable automation, it also had important limitations. First, it still depended on human involvement. AI dramatically improved individual productivity, but in incident response the bottleneck is often human attention and time. Even when starting an agent is simple, requiring an engineer to initiate the run introduces a context switch and consumes a scarce resource. Second, it depended on user credentials. Coding agents run with the user’s permissions, which can be overly broad for automation, and they inherit human-oriented flows such as browser-based reauthentication. For durable automation, we wanted an identity model better suited to unattended execution, such as managed identity. Third, there were execution-environment and security concerns. A local environment is powerful, but it does not naturally provide the sandboxing we wanted for safe automation. Because it runs with user access, it may also reach a much wider set of files and resources than is desirable for an automated incident workflow. Local and dev-box environments also have operational drawbacks. They can require restarts, contend with other workloads, and are not ideal for durable execution, failure recovery, or failover. For automation, we wanted a dedicated execution environment rather than something tied to an engineer’s machine. Finally, token management became an operational concern. User-linked token consumption can create instability when limits are reached, and automation can skew usage patterns so that one user appears to consume a disproportionate share of AI capacity. That adds noise to operational analysis and makes governance harder. For all of these reasons, cloud execution looked like the right direction. We wanted managed identity, a secure sandbox, durable execution, and a system that would not depend on someone’s local machine. Requirements for Cloud Automation Many of us had become strong supporters of coding agents and wanted to keep using them. Just as importantly, we had already accumulated assets that had been proven to work well: agent definitions, instructions, prompts, skills, MCP configuration, and repository layouts that the team had gradually built up and refined. That meant our move toward cloud automation was not about replacing coding agents with something entirely different. We wanted to preserve and reuse the assets that had made coding agents successful, while moving to an execution model that was better suited to automation. At the same time, coding agents had set a high quality bar. Because they worked so well in practice, we were not willing to assume that a cloud service would automatically deliver the same level of quality. So we defined two concrete goals for the cloud path. Achieve the same level of quality we were seeing from our existing coding-agent workflows when run in a focused, one-shot investigation. Ensure the assets we had already built could continue to be used and improved. In other words, we were not looking for just another cloud AI system. We were looking for a cloud automation path that could inherit the strengths of coding agents while providing the operational properties automation required. Comparing Headless coding-agent execution service and Azure SRE Agent To evaluate which approach could meet those requirements, we ran a side-by-side comparison. One path was a prototype headless coding agent execution service. It reused the same the internal tool’s workspace definitions that engineers used locally, but ran them without a human in the loop. When an incident entered a target loop, the system created an agent workspace, prepared repositories, started GitHub Copilot CLI with an initial prompt, collected the analysis, and posted the result back to the incident. It also preserved session artifacts so that an engineer could later review or resume the investigation. Fig 4. Agent Helped Trend – It shows people use Coding Agent, the introduction of headless coding agent execution service and SRE Agent increases the percentage of usefulness. The other path used Azure SRE Agent, which had improved with preview customer feedback and was nearing general availability, since our earlier experiments. It now supported newer models, stronger custom-agent behavior, MCP and built-in tools, repository access, and incident-triggered execution. We’ve performed a one-time migration from the Coding Agent asset to the Azure SRE Agent asset. This was achieved in one day using GitHub Copilot CLI and our existing coding agents. The comparison was deliberately practical. We already knew that our internal coding-agent environment produced results engineers trusted and liked. That became our quality bar. If Azure SRE Agent could meet or exceed that bar while also satisfying the operational requirements of cloud automation, it would be the stronger long-term path. Results and Feedback Loop The first Headless coding-agent execution service results were very encouraging. In its first set of incidents, the RCA matched the SME conclusion in cases where the agent could safely process the incident. That showed that the assets we had built for local coding agents could transfer effectively into a headless scenario. Azure SRE Agent also performed strongly from the beginning. Headless coding-agent execution service initially had slightly better analysis in some areas, but Azure SRE Agent was already good enough to be operationally useful. We then built an evaluation framework that compared: Each agent’s RCA, confidence score, and mitigation steps The RCA and mitigation reason later provided by a human Auto-mitigation recommendations Path to auto-mitigation Auto-transfer recommendations Session-level execution issues This evaluation became a feedback loop. Engineers reviewed interesting incidents, identified weaknesses, improved agent definitions and skills, and submitted pull requests. We also used agent assistance to generate improvement PRs from comparison reports. Fig 5. LLM as Judge side-by-side eval for headless coding-agent execution service (blue) vs Azure SRE Agent (green) Within a few weeks, Azure SRE Agent’s quality consistently exceeded the headless coding-agent execution service baseline. At that point, we stopped posting headless results back to incidents and focused on improving the Azure SRE Agent path instead. We also automated synchronization from the internal coding-agent assets so improvements could continue to flow through pull requests. That shift was important. It meant Azure SRE Agent was no longer just an interesting alternative—it had become the cloud path that could inherit what worked in coding agents while providing a better foundation for automation. Why Cloud AI Started to Work Better A common reaction to coding agents is that they feel much improved than the previous cloud AI experiences. Our experience suggests two main reasons: stronger models and improved access to the right context. A coding agent sees a workspace. It can use instructions, skills, tools, repositories, and files. Traditional cloud AI systems often did not have access to the same set of resources. Once Azure SRE Agent could see similar assets - the right repositories, the right tools, and the right domain-specific knowledge - it could reach comparable or better quality. The details of context compaction, tool execution, and orchestration matter. But the core principle is simpler: the agent needs to reach the right knowledge at the right time without carrying unnecessary context all the time. That means the most important work is not only choosing a model or building a tool. It creates high-quality AI-ready assets: concise instructions, useful skills, accurate references, well-structured repository access, and domain knowledge that was previously locked in people’s heads. The cloud hosted automation path instantly provided an exciting benefit, which is that the issue analysis is stored in the cloud and not only on the developer's machine. This means that the conclusions and investigations are stored for perusal and human interaction is possible via the chat interface. Fig 6. An Example of the Chat Interface for Azure SRE Agent Conclusion Our journey started with a personal RCA assistant, moved through structured agentic workflows, accelerated with coding agents, and eventually led us back to a cloud-hosted automation path. The lesson is not that coding agents or cloud agents are universally better. The lesson is that agent quality depends heavily on what the agent can see, how much irrelevant context it avoids, and whether domain experts have translated their knowledge into usable assets. For us, the key was not abandoning coding agents. It was carrying their strengths forward into Azure SRE Agent and a cloud execution model that was better suited to automation. Modern agents are now capable enough to make that work worthwhile. For incident response, that opens the door to faster investigation, safer automation, and ultimately lower incident mitigation time for customers. The Azure Functions team hope this experience is useful to other teams exploring how to apply AI to complex engineering operations. In the next post, we plan to go deeper into the evaluation framework and how we automated the feedback loop behind these improvements.2.8KViews2likes1CommentRunning Foundry Agent Service on Azure Container Apps
Microsoft’s Customer Zero blog series gives an insider view of how Microsoft builds and operates Microsoft using our trusted, enterprise-grade agentic platform. Learn best practices from our engineering teams with real-world lessons, architectural patterns, and operational strategies for pressure-tested solutions in building, operating, and scaling AI apps and agent fleets across the organization. Challenge: Scaling agents to production changes the requirements As teams move from experimenting with AI agents to running them in production, the questions they ask begin to change. Early prototypes often focus on whether an agent can reason to generate useful output. But once agents are placed into real systems where they continuously need to serve users and respond to events, new concerns quickly take center stage: reliability, scale, observability, security, and long‑running operations. A common misconception at this stage is to think of an agent as a simple chatbot wrapped around an API. In practice, an AI agent is something very different. It is a service that listens, thinks, and acts, ingesting unstructured inputs, reasoning over context, and producing outputs that may span multiple phases. Treating agents as services means teams often need more than they initially expect: dependable compute, strong security, and real-time visibility to run agents safely and effectively at scale. When we kick off an agent loop, we provide input that informs the context it recalls for the task, the data it connects to, the tools it calls, and the reasoning steps it outlines for itself to generate an output. Agent needs are different from traditional services in hosting, scaling, identity, security, and observability; it’s a product with a probabilistic nature that requires secure, auditable access to many resources at the same lightspeed performance that users expect from any software. This isn’t the first time that the software industry needed to evolve its thinking around infrastructure. When modern application architectures began shifting from monolithic apps toward microservices, existing infrastructure wasn’t built with that model in mind. As systems were reconstructed into independent services, teams quickly discovered they needed new runtime architecture that properly accommodated microservice needs. The modern app era brought new levels of performance, reliability, and scalability of apps, but it also warranted that we rebuild app infrastructure with container orchestration and new operational patterns in mind. AI agents represent a similar inflection. Infrastructure designed for request‑response applications or stateless workloads wasn’t built with long‑running, tool‑calling, AI‑driven workflows in mind. As the builders of Foundry Agent Service, we were very aware that traditional architectures wouldn’t hold up to the bursty agentic workflows that needed to aggregate data across sources, connect to several simultaneous tools, and reason through execution plans for the output that we needed. Rather than building new infrastructure from scratch, the choice for building on Azure Container Apps was clear. With over a million Apps hosted on Azure Container Apps, it was the tried-and-true solution we needed to keep our team focused on building agent intelligence and behavior instead of the plumbing underneath. Solution: Building Foundry Agent Service on a resilient agent runtime foundation Foundry Agent Service is Microsoft’s fully managed platform for building, deploying, and scaling AI agents as production services. Builders start by choosing their preferred framework or immediately building an agent inside Foundry, while Foundry Agent Service handles the operational complexity required to run agents at scale. Let’s use the example of a sales agent in Foundry Agent Service. You might have a salesperson who prompts a sales agent with “Help me prepare for my upcoming meeting with customer Contoso.” The agent is going to kick off several processes across data and tools to generate the best answer: Work IQ to understand Teams conversations with Contoso, Fabric IQ for current product usage and forecast trends, Foundry IQ to do an AI search over internal sales materials, and even GitHub Copilot SDK to generate and execute code that can draft PowerPoint and Word artifacts for the meeting. And this is just one agent; more than 20,000 customers rely on Foundry Agent Service. At the core of Foundry Agent Service is a dedicated agent runtime through Azure Container Apps that explicitly meets our demands for production agents. Agent runtime through flexible cloud infrastructure allows builders to focus on making powerful agent experiences without worrying about under-the-hood compute and configurations. This runtime is built around five foundational pillars: Fast startup and resume. Agents are event‑driven and often bursty. Responsiveness depends on the ability to start or resume execution quickly when events arrive. Built‑in agent tool execution. Agents must securely execute tool calls like APIs, workflows, and services as part of their reasoning process, without fragile glue code or ad‑hoc orchestration. State persistence and restore. Many agent workflows are long‑running and multi‑phase. The runtime must allow agents to reason, pause, and resume with safely preserved state. Strong isolation per agent task. As agents execute code and tools dynamically, isolation is critical to prevent data leakage and contain blast radius. Secure by default. Identity, access, and execution controls are enforced at the runtime layer rather than bolted on after the fact. Together, these pillars define what it means to run AI agents as first‑class production services. Impact: How Azure Container Apps powers agent runtime Building and operating agent infrastructure from scratch introduces unnecessary complexity and risk. Azure Container Apps has been pressure‑tested at Microsoft scale, proving to be a powerful, serverless foundation for running AI workloads and aligns naturally with the needs of agent runtime. It provides serverless, event‑driven scaling with fast startup and scale‑to‑zero, which is critical for agents with unpredictable execution patterns. Execution is secure by default, with built‑in identity, isolation, and security boundaries enforced at the platform layer. Azure Container Apps natively supports running MCP servers and executing full agent workflows, while Container Apps jobs enable on‑demand tool execution for discrete units of work without custom orchestration. For scenarios involving AI‑generated or untrusted code, dynamic sessions allow execution in isolated sandboxes, keeping blast radius contained. Azure Container Apps also supports running model inference directly within the container boundary, helping preserve data residency and reduce unnecessary data movement. Learnings for your agent runtime foundation Make infrastructure flexible with serverless architecture. AI systems move too fast to create infrastructure from scratch. With bursty, unpredictable agent workloads, sub‑second startup times and serverless scaling are critical. Simplify heavy lifting. Developers should focus on agent behavior, tool invocation, and workflow design instead of infrastructure plumbing. Using trusted cloud infrastructure, pain points like making sure agents run in isolated sandboxes, properly applying security policy to agent IDs, and ensuring secure connections to virtual networks are already solved. When you simplify the operational overhead, you make it easier for developers to focus on meaningful innovation. Invest in visibility and monitoring. Strong observability enables faster iteration, safer evolution, and continuous self‑correction for both humans and agents as systems adapt over time. Want to learn more? Learn about building and hosting agents with Foundry Agent Service Discover agent runtime through Azure Container Apps Read about best practices for managing agents535Views1like0CommentsHow we build and use Azure SRE Agent with agentic workflows
The Challenge: Ops is critical but takes time from innovation Microsoft operates always-on, mission-critical production systems at extraordinary scale. Thousands of services, millions of deployments, and constant change are the reality of modern cloud engineering. These are titan systems that power organizations around the globe—including our own—with extremely low risk tolerance for downtime. While operations work like incident investigation, response and recovery, and remediation is essential, it’s also disruptive to innovation. For engineers, operational toil often means being pulled away from feature work to diagnose alerts, sift through logs, correlate metrics across systems, or respond to incidents at any hour. On-call rotations and manual investigations slow teams down and introduce burnout. What's more, in the era of AI, demand for operational excellence has spiked to new heights. It became clear that traditional human-only processes couldn't meet the scale and complexity needs for system maintenance especially in the AI world where code shipping velocity has increased exponentially. At the same time, we needed to integrate with the AI landscape which continues to evolve at a breakneck pace. New models, new tooling, and new best practices released constantly, fragmenting ecosystems between different platforms for observability, DevOps, incident management, and security. Beyond simply automating tasks, we needed to build an adaptable approach that could integrate with existing systems and improve over time. Microsoft needed a fundamentally different way to perform operations—one that reduced toil, accelerated response, and gave engineers the time to focus on building great products. The Solution: How we build Azure SRE Agent using agentic workflows To address these challenges, Microsoft built Azure SRE Agent, an AI-powered operations agent that serves as an always-on SRE partner for engineers. In practice, Azure SRE Agent continuously observes production environments to detect and investigate incidents. It reasons across signals like logs, metrics, code changes, and other deployment records to perform root cause analysis. It supports engineers from triage to resolution and it’s used in a variety of autonomy levels from assistive investigation to automating remediation proposals. Everything occurs within governance guardrails and human approval checks grounded in role‑based access controls and clear escalation paths. What’s more, Azure SRE Agent learns from past incidents, outcomes, and human feedback to improve over time. But just as important as what was built is how it was built. Azure SRE Agent was created using the agentic workflow approach—building agents with agents. Rather than treating AI as a bolt-on tool, Microsoft embedded specialized agents across the entire software development lifecycle (SDLC) to collaborate with developers, from planning through operations. The diagram above outlines the agents used at each stage of development. They come together to form a full lifecycle: Plan & Code: Agents support spec‑driven development to unlock faster inner loop cycles for developers and even product managers. With AI, we can not only draft spec documentation that defines feature requirements for UX and software development agents but also create prototypes and check in code to staging which now enables PMs/UX/Engineering to rapidly iterate, generate and improve code even for early-stage merges. Verify, Test & Deploy: Agents for code quality review, security, evaluation, and deployment agents work together to shift left on quality and security issues. They also continuously assess reliability, ensure performance, and enforce consistent release best practices. Operate & Optimize: Azure SRE Agent handles ongoing operational work from investigating alerts, to assisting with remediation, and even resolving some issues autonomously. Moreover, it learns continuously over time and we provide Azure SRE Agent with its own specialized instance of Azure SRE Agent to maintain itself and catalyze feedback loops. While agents surface insights, propose actions, mitigate issues and suggest long term code or IaC fixes autonomously, humans remain in the loop for oversight, approval, and decision-making when required. This combination of autonomy and governance proved critical for safe operations at scale. We also designed Azure SRE agent to integrate across existing systems. Our team uses custom agents, Model Context Protocol (MCP) and Python tools, telemetry connections, incident management platforms, code repositories, knowledge sources, business process and operational tools to add intelligence on top of established workflows rather than replacing them. Built this way, Azure SRE Agent was not just a new tool but a new operational system. And at Microsoft’s scale, transformative systems lead to transformative outcomes. The Impact: Reducing toil at enterprise scale The impact of Azure SRE Agent is felt most clearly in day-to-day operations. By automating investigations and assisting with remediation, the agent reduces burden for on-call engineers and accelerates time to resolution. Internally at Microsoft in the last nine months, we've seen: 35,000+ incidents have been handled autonomously by Azure SRE Agent. 50,000+ developer hours have been saved by reducing manual investigation and response work. Teams experienced a reduced on-call burden and faster time-to-mitigation during incidents. To share a couple of specific cases, the Azure Container Apps and Azure App Service product group teams have had tremendous success with Azure SRE Agent. Engineers for Azure Container Apps had overwhelmingly positive (89%) responses to the root cause analysis (RCA) results from Azure SRE agent, covering over 90% of incidents. Meanwhile, Azure App Service has brought their time-to-mitigation for live-site incidents (LSIs) down to 3 minutes, a drastic improvement from the 40.5-hour average with human-only activity. And this impact is felt within the developer experience. When asked developers about how the agent has changed ops work, one of our engineers had this to say: “[It’s] been a massive help in dealing with quota requests which were being done manually at first. I can also say with high confidence that there have been quite a few CRIs that the agent was spot on/ gave the right RCA / provided useful clues that helped navigate my initial investigation in the right direction RATHER than me having to spend time exploring all different possibilities before arriving at the correct one. Since the Agent/AI has already explored all different combinations and narrowed it down to the right one, I can pick the investigation up from there and save me countless hours of logs checking.” - Software Engineer II, Microsoft Engineering Beyond the impact of the agent itself, the agentic workflow process has also completely redefined how we build. Key learnings: Agentic workflow process and impact It's very easy to think of agents as another form of advanced automation, but it's important to understand that Azure SRE agent is also a collaborative tool. Engineers can prompt the agent in their investigations to surface relevant context (logs, metrics, and related code changes) to propose actions far faster and easier than traditional troubleshooting. What’s more, they can also extend it for data analysis and dashboarding. Now engineers can focus on the agent’s findings to approve actions or intervene when necessary. The result is a human-AI partnership that scales operations expertise without sacrificing control. While the process took time and experimentation to refine, the payoff has been extraordinary; our team is building high-quality features faster than ever since we introduced specialized agents for each stage of the SDLC. While these results were achieved inside Microsoft, the underlying patterns are broadly applicable. First, building agents with agents is essential to scaling, as manual development quickly became a bottleneck; agents dramatically accelerated inner loop iteration through code generation, review, debugging, security fixes, etc. In practice, we found that a generic agent—guided by rich context and powered by memory and learning—can continuously adapt, becoming faster and more effective over time as it builds experience. This allows the agent to apply prior knowledge, avoid relearning, and reduce the effort required to resolve similar problems repeatedly. In parallel, specialized agents help bring consistency and repeatability to well‑defined categories of incidents, encoding proven patterns, workflows, and safeguards. Together, these approaches enable systems that both adapt to new situations and respond reliably at scale. Microsoft also learned to integrate deeply with existing systems, embedding agents into established telemetry, workflows, and platforms rather than attempting to replace them. Throughout this process, maintaining tight human‑in‑the‑loop governance proved critical. Autonomy had to be balanced with clear approval boundaries, role‑based access, and safety checks to build trust. Finally, teams learned to invest in continuous feedback and evaluation, using ongoing measurement to improve agents over time and understand where automation added value versus where human judgment should remain central. Want to learn more? Azure SRE Agent is one example of how agentic workflows can transform both product development and operations at scale. Teams at Microsoft are on a mission of leading the industry by example, not just sharing results. We invite you to take the practical learnings from this blog and apply the same principles in your own environments. Discover more about Azure SRE Agent Learn about agents in DevOps tools and processes Read best practices on agent management with Azure10KViews4likes1CommentContext Engineering Lessons from Building Azure SRE Agent
We started with 100+ tools and 50+ specialized agents. We ended with 5 core tools and a handful of generalists. The agent got more reliable, not less. Every context decision is a tradeoff: latency vs autonomy, evidence-building vs speed, oversight - and the cost of being wrong. This post is a practical map of those knobs and how we adjusted them for SRE Agent.15KViews22likes2Comments