copilot
1316 TopicsSyksyn 2026 Tekniset ja myynnin Kumppanitunnit
Microsoftin tekniset ja myynnille suunnatut Kumppanitunnit järjestetään nykyään Microsoftin globaalilla Skilling Hub -sivustolla, josta ne ovat kätevästi saatavilla myöhemmin tallenteina materiaaleineen. Rekisteröidy Skilling Hub -portaaliin, josta löydät kaikki Microsoftin kumppanikoulutukset yhdessä paikassa eri kielillä tai tekstitettyinä. Rekisteröityessäsi voi valita ne kielet, kuten suomi, jollaista sisältöä haluat ensisijaisesti nähdä englannin kielisen koulutussisällön lisäksi. Kumppanitunti on joka toinen perjantai klo 10–11 järjestettävä Microsoftin kumppaniwebinaari, joka on tarkoitettu kaikille Microsoftin kumppaneille. Tekniset ja kaupalliset aiheet vuorottelevat ja olet tervetullut molempiin webinaareihin. Webinaareissa keskitymme Microsoftin ratkaisualueiden teknologioiden mielenkiintoisiin uutuuksiin, MAICPP-kumppaniohjelmaan, kumppanietuihin ja ratkaisumyyntiin. Microsoftin suomalaiset arkkitehdit, tuotepäälliköt, ratkaisumyyjät ja kumppanivastaavat ovat poimineet kiinnostavia ja hyödyllisiä aiheita, joita he vuorollaan esittelevät. Syksyn 2026 ohjelma Alla ovat suunnitellut päivät ja teemat Syksylle 2026, joiden tarkka aihe päivitetään aina lähempänä esityspäivää tälle sivulle. 18.9. Kaupallinen Kumppanitunti: Partner START FY27 - webinaari Katso tallenne tästä linkistä: Etkö päässyt mukaan START FY27 Kickoff -tapahtumaan? Webinaarissa saat kattavan katsauksen tapahtumassa käsiteltyihin FY27: n liiketoimintamahdollisuuksiin, strategisiin painopisteisiin sekä Microsoftin kumppaneille suunnattuihin ohjelmiin ja resursseihin. Puhujat: Kalle Saarikannas, Liiketoimintajohtaja, AI Business Solutions Teemu Lainiola, Liiketoimintajohtaja, Cloud & AI Platforms Mereta Laukkanen, Sr Partner Development Manager Jonna Kaarlenkaski, Partner Development Manager Intern Jonna Fred-Jokela, Sr Solution Engineer Manager 2.10. Tekninen Kumppanitunti: Copilot Cowork: Copilot Credits ja kustannusten hallinta Katso tallenne tästä linkistä! Tässä teknisessä kumppanitunnissa käymme läpi Copilot Coworkin toimintamallin, kulutuksen seurannan sekä kustannusten hallinnan. Lisäksi tarkastelemme, millaisia mahdollisuuksia kulutuspohjainen AI luo kumppaneiden palveluliiketoiminnalle. Puhujat: Henri Nevalainen, Microsoft Niko Hiltunen, IAMCP 9.10. Kaupallinen Kumppanitunti: Onko julkisen pilven suvereniteetti riittävä huomioiden sen kaikki hyödyt? Rekisteröidy mukaan tästä linkistä! Euroopan unioni valmistelee uusia pilvi- ja tekoälyinfrastruktuuria koskevia linjauksia. Samanaikaisesti organisaatiot pohtivat, miten digitaalinen suvereniteetti, tekoälyn käyttöönotto, kyberturvallisuus ja sääntelyvaatimukset voidaan sovittaa yhteen käytännössä. Tervetuloa ajankohtaiseen webinaariin, jossa tarkastelemme Euroopan muuttuvaa pilviympäristöä ja mitä digitaalinen suvereniteetti tarkoittaa suomalaisille organisaatioille käytännössä. Lisäksi kerromme viimeisimmät tilannetiedot pilvipalveluiden kvanttiturvallisuuden ja Suomen datakeskushankkeiden osalta. Puhujat: Juha Karppinen, National Technology Officer, Microsoft Timo Salminen, Partner Solution Architect, Microsoft Niko Hiltunen, IAMCP 22.10. Kaupallinen Kumppanitunti: Frontier Transformation - Next level IQ & Uusi näkökulma kumppanin rooliin AI-aikakaudella Rekisteröidy mukaan tästä linkistä! AI-transformaatio on siirtymässä yksittäisten työkalujen käyttöönotosta kohti laajempaa työn ja toimintamallien uudistamista. Kumppanitunnilla havainnollistamme käytännön esimerkin avulla, kuinka organisaation toimintaa voidaan tarkastella digitaalisen genomin kautta, organisaatiosta ja tiedosta aina työhön, mikrotehtäviin ja agentteihin asti. Samalla tarkastelemme, mitä muutos tarkoittaa kumppaneille: miten tunnistaa uusia asiakasarvon mahdollisuuksia, rakentaa vaikuttavampia AI-keskusteluja ja auttaa asiakkaita etenemään kohti agenttipohjaista toimintamallia. Tule mukaan katsomaan demo ja pohtimaan, mitä seuraavan vaiheen AI-transformaatio mahdollistaa sinun asiakkaillesi. Puhujat: Hans Dolk, Asiakkuusjohtaja / Defence & Intelligence, Public Safety and National Security Juha Liljeblom,Teknologia Strategisti / Defence & Intelligence, Public Safety and National Security 23.10. Kaupallinen Kumppanitunti: Uudistunut Microsoft Copilot: ominaisuudet, käyttötavat ja kustannusten hallinta Rekisteröidy mukaan tästä linkistä! Microsoft Copilot uudistuu merkittävästi. Copilotista rakentuu paikka, jossa käyttäjä voi kysyä, delegoida, rakentaa ja automatisoida työtä. Uudet Home-, Code- ja Autopilot-kokemukset laajentavat Copilotin käyttöä päivittäisestä AI-avustamisesta kohti pidempikestoista agenttityötä ja käyttäjien itse rakentamia ratkaisuja. Webinaarin tavoitteena on antaa kumppaneille selkeä kokonaiskuva siitä, miten uudistunut Copilot muuttaa asiakkaiden AI:n käyttötapoja, lisensointi- ja kulutuskeskustelua sekä kumppaneille avautuvia mahdollisuuksia. Puhujat: Harri Mikkanen, Microsoft Tuulia Piehl, Microsoft Henri Nevalainen, Microsoft Eetu Hämäläinen, IAMCP 30.10. Tekninen Kumppanitunti: Villi vai hallittu? Tekoälyagentit hallintaan Microsoft Agent 365:llä Rekisteröitymislinkki päivittyy tähän Agentteja syntyy organisaatioihin nopeammin kuin kukaan ehtii niitä seurata. Niitä rakentavat työntekijät, niitä hankitaan kumppaneilta ja niitä kytketään liiketoiminnan dataan ja työkaluihin. Kenellä on oikeudet mihinkin, kuka agentin omistaa, kun tekijä lähtee talosta, ja mihin luottamuksellinen data päätyy? Tässä teknisessä kumppanitunnissa käymme läpi, miten Microsoft Agent 365:llä saadaan agentit näkyviin, hallintaan ja suojattua työkaluilla, jotka ovat asiakkailla todennäköisesti jo käytössä: Microsoft 365 -admin-portaalilla, Entralla, Purviewilla ja Defenderillä. Tarkastelemme eroa "villin" ja "hallitun" agentin välillä. Villi agentti julkaistaan suoraan kaikille ilman tarkistusta, ja sillä on tekijänsä kaikki oikeudet. Hallittu agentti kulkee hyväksyntäprosessin kautta, sillä on nimetty omistaja ja sen pääsy on rajattu Entran, Purviewin ja Defenderin käytännöillä. Puhujat: Heta Kuosa, Microsoft Christine Dienel, Microsoft 6.11. Tekninen Kumppanitunti: Rekisteröitymislinkki päivittyy tähän Puhujat: 20.11. Kaupallinen Kumppanitunti: Rekisteröitymislinkki päivittyy tähän Puhujat: 4.12. Kaupallinen Kumppanitunti: Rekisteröitymislinkki päivittyy tähän Puhujat: 18.12. Tekninen Kumppanitunti: Agentit Azuressa Rekisteröitymislinkki päivittyy tähän Azure Copilot pitää sisällään uusia palveluiden elinkaarenhallintaan liittyviä agentteja. Tule kuulemaan, miten voit hyödyntää näitä omissa palveluissasi! Puhujat: Timo Salminen, Partner Solution Architect, Microsoft635Views0likes0CommentsTeams Premium + Bookings : Automatic recording and transcription for Bookings meetings ?
Hello, I have a Teams Premium license, recording and transcription policies are enabled on the admin side, and Video Recap works correctly when both are active simultaneously in the same meeting. My use case : my clients book time slots via Microsoft Bookings. Teams meetings are therefore created automatically by Bookings and I have no control over their scheduling. According to Microsoft Learn documentation (Manage the Virtual appointment meeting template and Microsoft Bookings), there is no documented mechanism to automatically apply a Teams meeting template, and therefore automatic recording and transcription, to meetings generated by Bookings. My question: has anyone found a workaround for this limitation (Power Automate, Graph API, or anything else)? And does Microsoft have a documented roadmap on this topic? This gap directly prevents Teams Premium users from accessing Video Recap on their client meetings, which is one of the core use cases Teams Premium is designed for. Thank you for your help268Views2likes2CommentsWhat's new in Microsoft Planner | September 2026
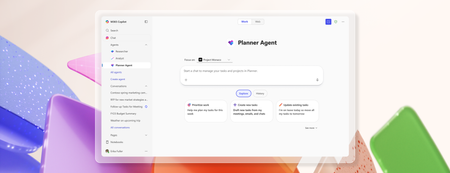
Fall is officially here, and with it comes our first quarterly edition of What's New in Microsoft Planner! Each quarter, we'll bring the latest Planner updates together in one place. We're continuing to invest in Planner to help people work alongside AI to plan and get work done, whether you're tracking your own tasks or coordinating a shared plan across your team. This quarter's updates give you a clearer view of your work, new ways to save time keeping plans current, and more places to manage tasks where work already happens. Planner Agent is now built directly into basic plans, so you can ask questions about your plan, create and update tasks, and focus on your top priorities without leaving Planner. We're also making Planner Agent in Copilot more capable, with fuller answers on large, complex plans and faster, more reliable responses. You'll also find updates that bring Planner closer to where your team collaborates, from adding Planner as a tab in private and shared Teams channels to bringing your tasks and plans into Outlook. And the new Task Details Side Pane lets you update assignments, dates, and checklists without losing sight of the bigger picture. Read on to see everything that's new in Planner this quarter and share your feedback through the Planner Feedback Portal. Keep the details and bigger picture in view Task Details Side Pane Planner now offers a new way to view and edit task details without losing sight of the plan or task list. The Task Details Side Pane opens alongside Board, Grid, and My Tasks views. Assignees, dates, notes, and checklists can be updated without leaving that view. Seeing task details alongside the plan makes it easier to review assignments and dates without losing context. Planner now also remembers the preferred task details layout when the app is reopened. On smaller screens, task details automatically open in a dialog for a better fit. Save time planning and getting work done Chat with Planner Agent in Planner Planner Agent chat is available directly in basic plans. It allows teams to ask questions about the plan, create and update tasks, and filter the view to focus on the top priorities. With chat built into the plan, teams can now review tasks and make updates without leaving Planner to start a separate conversation in Copilot. Planner Agent in Microsoft Copilot More context for large plans: Planner Agent can now use more information from large and complex plans when answering questions. It leverages the latest frontier models for more in-depth reasoning and draws more effectively on work content. These improvements help find relevant tasks and include more supporting plan details in responses, giving teams a fuller picture of the work being reviewed. Create larger plans in Copilot: The previous 30-task limit when creating a plan has been removed, allowing Planner Agent to generate larger initial task lists without a limit. Teams can review the proposed tasks in Copilot before saving them to the plan. Improvements also extend beyond plan creation, with faster responses and fewer interruptions across the Planner Agent experience in Copilot. Assign tasks to team members: Users can set task owners by asking Planner Agent or using task cards in the agent's responses, without leaving the conversation in Copilot. Choose how Planner Agent responds: A new model selector offers Quick response, Think deeper, and Auto modes. Users can choose a quicker response, request more in-depth reasoning, or let Planner Agent select the mode automatically. Planner capabilities in Copilot Users can keep tasks current while handling other work in one conversation, without opening Planner or a separate Planner Agent chat. In Copilot Chat, users can now search for tasks and plans, get answers about their work, create or update tasks, and take action on plans. The same chat includes capabilities from Outlook, Excel, PowerPoint, and other apps. Users can access these alongside Planner capabilities without switching between agents. Manage work where it happens Planner in Outlook Planner is now available in Outlook, bringing tasks and plans, along with Planner Agent, into the inbox. This experience supports both personal task tracking and collaborative planning, so individual commitments and shared work can be managed in one place. With Planner in Outlook, people can track progress, coordinate responsibilities, and take action without leaving their inbox. To get started in Outlook on the web or the new Outlook for Windows, select Apps, search for Planner, then add and pin it for quick access. Planner tabs in Teams channels Planner can now be added as a tab in private and shared Team channels. Team members can create a new basic plan or select an existing plan shared with the group associated with the channel. Once added, the plan is easy to find in the channel where the team collaborates. Members can return to that dedicated space to review tasks and manage projects together.4.7KViews5likes6CommentsCopilot, Microsoft 365 & Power Platform Community call
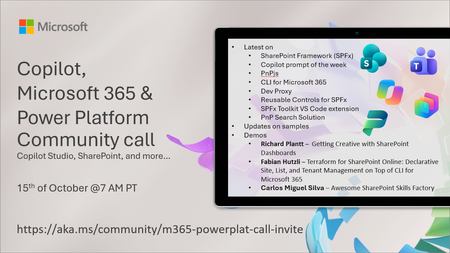
💡 Copilot, Microsoft 365 & Power Platform weekly community call focuses on different use cases and features within the Microsoft 365 and Power Platform - across Microsoft 365 Copilot, Copilot Studio, SharePoint, Power Apps and more. Demos in this call are presented by the community members. 👏 Looking to catch up on the latest news and updates, including cool community demos, this call is for you! 📅 On 15th of October we'll have following agenda: Latest on SharePoint Framework (SPFx) Latest on Copilot prompt of the week PnPjs CLI for Microsoft 365 Dev Proxy Reusable Controls for SPFx SPFx Toolkit VS Code extension PnP Search Solution Demos this time Richard Plantt – Getting Creative with SharePoint Dashboards Fabian Hutzli – Terraform for SharePoint Online: Declarative Site, List, and Tenant Management on Top of CLI for Microsoft 365 Carlos Miguel Silva – Awesome SharePoint Skills Factory 📅 Download recurrent invite from https://aka.ms/community/m365-powerplat-dev-call-invite 📞 & 📺 Join the Microsoft Teams meeting live at https://aka.ms/community/m365-powerplat-dev-call-join 💡 Building something cool for Microsoft 365 or Power Platform (Copilot, SharePoint, Power Apps, etc)? We are always looking for presenters - Volunteer for a community call demo at https://aka.ms/community/request/demo 👋 See you in the call! 📖 Resources: Previous community call recordings and demos from the Microsoft Community Learning YouTube channel at https://aka.ms/community/youtube Microsoft 365 & Power Platform samples from Microsoft and community - https://aka.ms/community/samples Microsoft 365 & Power Platform community details - https://aka.ms/community/home 🧡 Sharing is caring!69Views0likes0CommentsCopilot Extensibility community call - October 2026
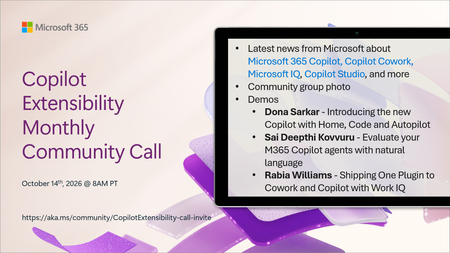
🚀 The Copilot Extensibility Monthly Community Call is a recurring virtual gathering designed to keep the global developer and maker community consistently connected, informed, and engaged with the latest advancements in Microsoft 365 Copilot, Copilot Cowork, Microsoft Scout, GitHub Copilot, Microsoft IQ, etc. and their extensibility ecosystem. 👏 Monthly Wednesday call is for all community members to see Microsoft PMs, engineering and Cloud Advocates showcasing the art of possible with the Microsoft AI technologies. 📅 On the 14th of October we'll have following agenda: News and updates from Microsoft Community group photo Dona Sarkar – Introducing the new Copilot with Home, Code and Autopilot Sai Deepthi Kovvuru - Evaluate your M365 Copilot agents with natural language Rabia Williams - Shipping One Plugin to Cowork and Copilot with Work IQ 📞 & 📺 Join the Microsoft Teams meeting live at https://aka.ms/community/CopilotExtensibility-call-join 🗓️ Download recurrent invite for this weekly call from https://aka.ms/community/CopilotExtensibility-call-invite 👋 See you in the call! 💡 Building something cool with Microsoft AI technologies (Copilot, Cowork, Copilot Studio, Microsoft IQ, etc)? We are always looking for presenters - Volunteer for a community call demo at https://aka.ms/community/request/demo 📖 Resources: Previous community call recordings and demos from the Microsoft Community Learning YouTube channel at https://aka.ms/community/youtube Labs and training material about Microsoft 365 Copilot Extensibility - https://aka.ms/copilotdevcamp Microsoft 365 & Power Platform samples from Microsoft and community - https://aka.ms/community/samples Microsoft 365 & Power Platform community details - https://aka.ms/community/home 🧡 Sharing is caring!87Views0likes0CommentsCopilot, Microsoft 365 & Power Platform product updates call
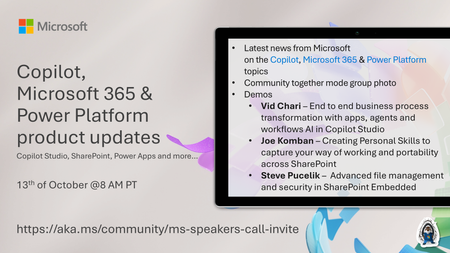
💡Copilot, Microsoft 365 & Power Platform product updates call concentrates on the different use cases and features within the Microsoft 365 and in Power Platform. Call includes topics like Microsoft 365 Copilot, Copilot Studio, Microsoft Teams, Power Platform, Microsoft Graph, Microsoft Viva, Microsoft Search, Microsoft Lists, SharePoint, Power Automate, Power Apps and more. 👏 Weekly Tuesday call is for all community members to see Microsoft PMs, engineering and Cloud Advocates showcasing the art of possible with Microsoft 365 and Power Platform. 📅 On the 13th of October we'll have following agenda: News and updates from Microsoft Together mode group photo Vid Chari – End to end business process transformation with apps, agents and workflows AI in Copilot Studio Joe Komban – Creating Personal Skills to capture your way of working and portability across SharePoint Steve Pucelik – Advanced file management and security in SharePoint Embedded 📞 & 📺 Join the Microsoft Teams meeting live at https://aka.ms/community/ms-speakers-call-join 🗓️ Download recurrent invite for this weekly call from https://aka.ms/community/ms-speakers-call-invite 👋 See you in the call! 💡 Building something cool for Microsoft 365 or Power Platform (Copilot, SharePoint, Power Apps, etc)? We are always looking for presenters - Volunteer for a community call demo at https://aka.ms/community/request/demo 📖 Resources: Previous community call recordings and demos from the Microsoft Community Learning YouTube channel at https://aka.ms/community/youtube Microsoft 365 & Power Platform samples from Microsoft and community - https://aka.ms/community/samples Microsoft 365 & Power Platform community details - https://aka.ms/community/home 🧡 Sharing is caring!94Views0likes0CommentsESPC Microsoft 365 and AI 2026 Event Guide
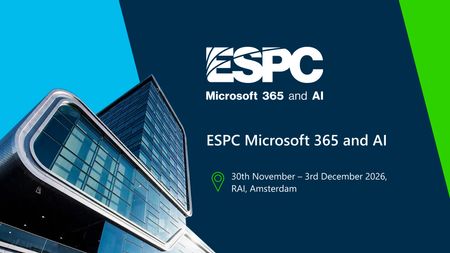
Event at a Glance ESPC is Europe's premier Microsoft 365 and AI conference. It brings together IT professionals, business leaders, developers, architects, partners, MVPs, community leaders, and Microsoft experts to learn, connect, and explore the latest innovations across Microsoft 365, Copilot, Teams, SharePoint, and more. Microsoft is a lead partner and headline sponsor, using ESPC as a key opportunity to engage with customers, partners, and the Microsoft community. Dates: November 30 - December 3, 2026 Location: RAI Amsterdam, Netherlands Venue: RAI Amsterdam, Europaplein 24, 1078 GZ Amsterdam, Netherlands (Entrance C) Hashtag: #ESPC26 Microsoft Role: Headline Sponsor Sessions: 35+ Microsoft-led Speakers: 100+ (MVPs, RDs, Microsoft and community members) Why Attend ESPC 2026? ESPC is where the Microsoft community comes together to learn, connect, and shape what’s next. From Microsoft keynotes and product-maker sessions to hands-on demos, community meetups, and networking opportunities, attendees gain direct access to the people building the technologies they use every day. ESPC is known for its welcoming community atmosphere, making it easy to learn from peers, share ideas, and build meaningful professional relationships. Learn from Microsoft - Hear directly from Microsoft leaders, engineers, product makers, and customer experience experts as they share the latest developments across Microsoft 365, Copilot, Teams, SharePoint, Power Platform, Security, Fabric, Azure, and AI. Explore What's New in AI and Copilot - Discover how organizations are adopting AI, deploying Copilot, building agents, and transforming productivity. Gain practical guidance, real-world insights, and technical knowledge you can take back to your team. Get Hands-On with Innovation - Visit the Microsoft Innovation Hub to experience live demos, engage with product experts, explore new capabilities, and participate in interactive experiences designed to help you learn by doing. Connect with the Community - Meet MVPs, partners, customers, developers, architects, IT professionals, and community leaders from around the world. Whether in a session, the Community Lounge, a meetup, or a networking event, ESPC creates opportunities to build lasting connections. Return with Actionable Ideas - Beyond inspiration, ESPC focuses on practical learning. Attendees leave with new skills, proven approaches, and fresh perspectives they can immediately apply to modernize collaboration, accelerate adoption, strengthen governance, and drive AI-powered transformation within their organizations Microsoft Presence Microsoft will have a significant presence throughout the conference, including: Microsoft keynotes and product announcements Product makers, engineers, and customer experience leaders Microsoft-led breakout sessions Innovation Hub experience on the expo floor Innovation Stage lightning talks Ask the Expert opportunities Executive engagement activities Women in Tech & Allies programming Community meetups and networking experiences Meet the Microsoft Keynote speakers Jeff Teper, Executive Vice President, Microsoft Apps & Agents Karuana Gatimu, Director, Microsoft SCALE Experience Group, AI & Collaboration Vesa Juvonen, Principal Product Manager Keynotes Microsoft Opening Keynote | Tuesday, December 1 | 9:00 AM The AI-Powered Enterprise Speaker: Jeff Teper, Executive Vice President, Microsoft Apps & Agents Microsoft's opening keynote will explore how the biggest AI value gains extend beyond individual applications and personal productivity gains. They emerge when organizations connect people, knowledge, business processes, data, workflows, and agents into a unified operating model. You can expect valuable insights into business transformation trends, product innovation, and demos to show how everyday work is evolving. Whether you're a decision maker, business leader, or technology professional, this session will offer practical perspectives on navigating the next wave of digital transformation. Demonstrations Miceile Barrett, Principal Group Product Manager, Michel Bouman, Senior Program Manager, Kendra Springer, Principal Group PM Manager Microsoft Product Keynote | Wednesday, December 2 | 9:00 AM Leading Through Change: Fireside Conversations on AI, Productivity, and Business Transformation Speaker: Karuana Gatimu, Director of the Microsoft SCALE Experience Group, AI & Collaboration A product-focused keynote highlighting customer adoption, community innovation, and practical approaches for leveraging Microsoft 365 Copilot, agents, and modern workplace technologies. Known for translating complex technology into actionable guidance, Karuana will share practical insights, real-world examples, and best practices that you can take back to your teams. From collaboration and productivity to AI-powered innovation, this keynote will provide valuable inspiration for organizations looking to maximize their Microsoft investments. Closing Keynote | Thursday, December 3 | 9:00 AM Crafting the Next Era of Work with AI and Empathy Speaker: Vesa Juvonen, Principal Product Manager, Microsoft As organizations continue to embrace AI, one question becomes increasingly important: how do we balance technological advancement with human connection? In this keynote, Vesa Juvonen will explore how innovation and empathy can work together to shape the future workplace. Through practical examples and relatable insights, Vesa will share ideas for embracing new technologies while keeping people at the center of transformation efforts. Whether you're leading organizational change, building solutions, supporting users, or exploring ways to work smarter, this session will provide actionable ideas to help you navigate the evolving world of work. Microsoft sessions Tuesday: 10:15-11:15 - Frontier transformation with Microsoft Copilot and Work IQ with John Mighell, Microsoft / Shanna Bosmans, Microsoft 10:15-11:15 - Microsoft Teams: Harnessing agents where work gets done with Matt Slomka, Microsoft 11:45-12:45 - Agent 365: Securing, Governing, and Managing the Agentic Enterprise with Sesha Mani, Microsoft / Vinod Kurpad, Microsoft 11:45-12:45 - Extending Microsoft Copilot: Understanding Your Options with Vesa Juvonen, Microsoft / Paolo Pialorsi, Microsoft 11:45-12:45 - OneDrive: Your Hub for Productivity and Collaboration Excellence (Product Team Overview) with Arjun Tomar, Microsoft / Lincoln DeMaris, Microsoft 14:00-15:00 - Harnessing Connectors to Power Intelligent Agents in Microsoft 365 with Manas Biswas, Microsoft 15:15-16:15 - Modernize Legacy Systems for the Copilot Era with SharePoint Embedded with Marc Windle, Microsoft / James Eccles, Microsoft 15:15-16:15 - Copilot Cowork in Action: What It Is, How to Get It & What You Can Do With It with Melissa Hale, Kerv / Daniel Laskewitz, Microsoft 16:45-17:45 - Giving your office eyes, ears and a brain with Michel Bouman, Microsoft / Matt Slomka, Microsoft 16:45-17:45 - Build Once, Ground Everywhere: Developing Agents with the WorkIQ API with Shyam Narayan, Microsoft / Yogesh Ratnaparkhi, Microsoft Wednesday: 10:15-11:15 - SharePoint: The Knowledge Platform for Copilot & Agents (Product Team Overview) with Zach Rosenfield, Microsoft / Miceile Barrett, Microsoft 11:45-12:45 - OneDrive: Your Hub for Productivity and Collaboration Excellence (Product Team Overview) with Arjun Tomar, Microsoft / Lincoln DeMaris, Microsoft 14:00-15:00 - Secure your Copilot Era: 3Rs you should care: Readiness-Relevancy-Resiliency with Brad Gussin, Microsoft / Kartik Pullabhotla, Microsoft 15:15-16:15 - Unlocking Business Value with Copilot, Agents, and Content Automation with Bryan Wofford, Microsoft / Karuana Gatimu, Microsoft 16:45-17:45 - Digital Me: Meet Your Microsoft Scout with TBA, Microsoft 16:45-17:45 - M365 Content Governing Agent powered by SAM. Governing Content at the Speed of AI with Sanjoyan Mustafi, Microsoft / Jill McClenahan, Microsoft Thursday: 11:45-12:45 - How to avoid “(fin)Ooops” in AI: practical tokenomics for Copilot agents with Hanna Engel, Microsoft 11:45-12:45 - MCP in Power Platform: One Year Later – Building Custom MCP Servers with Low Code with Daniel Laskewitz, Microsoft / Mats Necker, MVP, dhino 15:15-16:15 - From Conversation to Action: Building Copilot Apps That Transform Work with Vesa Juvonen, Microsoft / Bert Jansen, Microsoft Community Sessions There are over 100 sessions presented by the Microsoft Community – Microsoft Most Valuable Professionals (MVPs), Regional Directors, Microsoft Global Community Initiative Board Members and Regional Leads, Microsoft Partners and more. ESPC also has a Programme Team that curates all of the content for the event. Thank you Luise Freese, Maarten Eekels, Rik Hepworth, and Chris O’Brien for your curation, partnership and working so hard to architect a fabulous programme for 2026. Learn more about the team here: European SharePoint Conference 2026 | ESPC 2026 Microsoft Innovation Hub The Innovation Hub serves as Microsoft's home on the ESPC expo floor and gives attendees opportunities to interact directly with product teams through demos, conversations, and hands-on experiences. We are excited to announce that Dona Sarkar, Principal CX Program Manager, Microsoft will be leading a learning promptahon workshop in the Ideation Lab. More info and a few other activations with names you know to be announced. Innovation Hub Zones Innovation Stage Lightning talks Live demos Product-maker presentations Demo Stations Microsoft Copilot Copilot Studio and Agents OneDrive & SharePoint AI Adoption Surface + AI Skilling Bar Surface devices with AI integration AI skilling experiences Practical learning scenarios Ideation Lab Interactive workshops Community collaboration Future-of-work discussions Planned Hours Tuesday: 10:00 AM - 7:00 PM Wednesday: 10:15 AM - 6:00 PM Thursday: 10:00 AM - 3:00 PM Community Activities Microsoft is partnering closely with the broader Microsoft community to deliver: Community Lounge meetups Ask the Expert activities Microsoft Most Valuable Professional (MVP) engagement Microsoft Global Community Initiative (MGCI) engagement Innovation Stage presentations Community networking opportunities Community activities are integrated directly into the Innovation Hub and Community Lounge experience, creating opportunities for attendees to engage with Microsoft leaders, MVPs, partners, and community organizers. Women in Tech & Allies Activities WIT Community Lounge Meetup Calling all Women in Tech and Allies! Join us during lunch on the first day of ESPC to say hello, make new connections, and perhaps find an ESPC show buddy. This is a casual meetup with no formal agenda. Simply pick up your lunch and join us at the tables marked with WITA signs. Date: Tuesday, December 1 Time: 12:45 –2:00 PM CET Location: Community Lounge Inspire Stage breakout Leading with Allyship: Building Inclusive Communities in the Age of AI Date: Wednesday, December 2 Time: 10:15–11:15 AM CET Location: Inspire Stage Hosts: Heather Cook, Principal Customer Experience Manager, Microsoft and Femke Cornelissen, Chief AI Transformation Officer, Wortell Panelists: Jayshree Ostwal, MVP, Manager, AI Solution Architect, Avanade, Lindsay Shelton, MVP, Digital Workplace Advisor, Epiq, Merethe Stave, MVP, Chief Customer Officer and Senior Cloud Architect, CloudWay, Onyinye Madubuko,MVP, Senior M365 Consultant, Ergo, Reshmee Auckloo, MVP, Modern Workplace Associate Manager, Avanade Women in Tech & Allies Lunch Shaping the Future Together: Women in Tech and Allies Driving Change Date: Wednesday, December 2 Time: 12:45-2:00 PM CET Location: Elicium 1 Host: Heather Cook, Principal Customer Experience Manager, Microsoft Panelists: Danielle Moon, Sr. Specialist – AI Business Process, Women in Power Platform, Microsoft, Karuana Gatimu, Director of the Microsoft SCALE Experience Group, AI & Collaboration, Microsoft, Jessie Hwang, Customer Experience Product Manager, Microsoft, Hanna Engel, Cloud Solution Architect | Azure & AI, Microsoft, Dona Sarkar, Chief Troublemaker | Enterprise AI Advocacy, Microsoft, Ioana-Cristina Sbiera, Field Integrated Marketing Manager, Microsoft Microsoft Event Team Executive Producer - Heather Cook, Principal Customer Experience Manager, Microsoft Content Narrative Lead – Bryan Wofford, Principal Customer Experience Manager, Microsoft Community & Innovation Hub Lead – Jonathan Jones, Customer Experience Program Manager, Microsoft ESPC Organizers Thank you to our event producers: Bridgette Robertson, Partnership Development & Programme Executive, Ella Murphy, Marketing Manager, Joanne Mangan, Product & Partner Manager, John Carroll, Business Development Lead, Katie Boland, Events Administrator, Kevin Monahan, General Manager, Sarah Grech, Events Coordinator, Sean Colleran, Marketing Executive Links and Social Event Resources - ESPC Website Social Media Hashtag – #ESPC26 X/Twitter – ESPC Community LinkedIn – ESPC LinkedIn Instagram – ESPC_Community See you there! ESPC 2026 represents an important opportunity to connect product makers, customers, partners, MVPs, and the broader Microsoft community in one of the most engaged Microsoft ecosystems in the world. Across four days of learning, networking, hands-on experiences, and community-led conversations, Microsoft will showcase the latest innovations in Microsoft 365, Copilot, AI, Teams, SharePoint, Power Platform, Fabric, Security, and Azure while creating meaningful opportunities for attendees to learn, connect, and share what’s next. We look forward to welcoming the community to Amsterdam and making ESPC 2026 a memorable, inclusive, and impactful experience for everyone involved. See you at ESPC 2026. #ESPC26119Views0likes0CommentsCan Microsoft 365 Copilot Access Archive Mailboxes?
After writing about the new 100GB mailbox quota for Microsoft 365 Business Tenants, I was asked if Microsoft 365 Copilot supports Exchange Online archive mailboxes. It does. Microsoft Search indexes items in archive mailboxes, so Copilot can find and use items from those mailboxes. Interestingly, the DLP policy to block external email for Copilot didn’t work. That’s definitely something to investigate! https://office365itpros.com/2026/10/08/archive-mailbox-copilot/45Views0likes0CommentsFrom Chaos to Clarity: How Microsoft 365 Copilot Helps SMBs Make Smarter Decisions
In today’s fast-paced business landscape, small and medium-sized businesses (SMBs) face a constant challenge: do more with less and do it faster. The pressure to innovate, respond to market shifts, and keep teams aligned is real. That’s why Microsoft 365 Copilot is more than just another productivity tool—it’s a strategic partner for SMBs looking to turn operational chaos into clarity.1KViews2likes1Comment