cloudsecurity
2 TopicsTurning Azure Policy Signals into Actionable Governance Insights
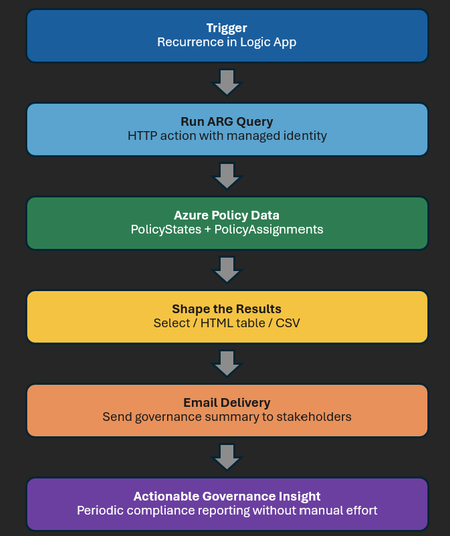
Most Azure Policy reporting stops at compliance status. Useful, yes — but not enough. When a control fails, teams need to know what failed, why it matters, and who should act. That gap becomes obvious at enterprise scale. A failed policy evaluation is only a signal. By itself, it does not tell you whether the issue affects recovery, auditability, telemetry, or another control leaders care about. That is why joining PolicyStates with PolicyAssignments matters. One tells you the outcome. The other tells you which control was applied, where, and in what governance context. Together, they turn Azure Policy from a compliance feed into a control intelligence layer. The problem: PolicyStates alone tells you what is non-compliant, but not always why it matters Microsoft’s sample ARG queries quickly show which resources are non-compliant. Helpful, but still incomplete. They show the result, not the business meaning. At enterprise scale, that distinction matters. A storage account without blob soft delete is a recovery risk. Missing Azure Activity logs creates an audit gap. A virtual machine without Azure Monitor Agent creates a telemetry blind spot. Azure Policy shows the state. The join to PolicyAssignments explains why it matters. There is also a technical reason to care about assignments. The same PolicyDefinitionId can appear in multiple assignments across different scopes. That makes PolicyAssignmentId the operational key. How Azure Policy compliance data flows Azure Policy evaluates resources against JSON-based rules. Those rules are packaged as policy definitions and can be grouped into initiatives. Once assigned to a scope, the policy engine evaluates matching resources during creation, updates, assignment changes, and regular compliance cycles. The results are exposed through PolicyStates and PolicyEvents, and can also be queried through Azure Resource Graph. This is the architecture flow for turning the ARG query into a scheduled governance report through Logic App: The key shift is operational. A Logic App can run the ARG query on a schedule, format the results, and email them to stakeholders. That turns a manual check into a repeatable governance report. The analytical pattern: enrich compliance with assignment context The analytical flow is straightforward: Configure a Recurrence trigger in Logic App so the report runs on the schedule you need. Use an HTTP action with managed identity to run the ARG query against PolicyStates and join it to PolicyAssignments. Filter on the control assignments that matter to your organisation and shape the response into a compact HTML table or CSV. Send the output by email to governance, engineering, or audit stakeholders so the insight reaches people without requiring them to open the portal. In practice, the query starts with non-compliant resources and enriches them with assignment details such as the assignment name and optional metadata like owner. That is the shift from raw signal to governance insight. A simple implementation pattern is: schedule the Logic App, run the ARG query with managed identity, format the output, and send the report. HTML works well for leadership emails; CSV is better for downstream analysis. ARM template for the Logic App If you want to deploy this pattern instead of building it step by step, I have also published an ARM template for the Logic App in my GitHub repository. The template is intended to help you stand up the scheduled policy compliance workflow faster and then customise the query, email recipients, and formatting for your own environment. This makes the architecture in this post directly reusable: schedule the Logic App, run the ARG query, shape the output, and send a control-focused report without having to assemble the workflow from scratch. See the repository for the template and related Microsoft Sentinel automation content. Reference ARG query policyResources | where type =~ 'microsoft.policyinsights/policystates' | where properties.complianceState == 'NonCompliant' | extend ResourceId = tostring(properties.resourceId), PolicyAssignmentId = tolower(trim(@" ", tostring(properties.policyAssignmentId))), SubscriptionId = tostring(subscriptionId), LastEvaluated = todatetime(properties.timestamp) | extend ResourceName = tostring(extract(@"[^/]+$", 0, ResourceId)) | extend ResourceProvider = tostring(extract(@"providers/([^/]+)/", 1, ResourceId)) | extend ResourceCategory = case( ResourceId has "Microsoft.Compute/virtualMachines", "VM", ResourceId has "Microsoft.Storage/storageAccounts", "Storage", ResourceId has "Microsoft.Network/virtualNetworks", "Network", ResourceId has "Microsoft.Sql/servers", "SQL", ResourceId has "Microsoft.KeyVault/vaults", "Key Vault", ResourceProvider =~ "Microsoft.Compute", "Compute", ResourceProvider =~ "Microsoft.Storage", "Storage", ResourceProvider =~ "Microsoft.Network", "Network", ResourceProvider =~ "Microsoft.KeyVault", "Key Vault", "Other" ) | project ResourceId, ResourceName, ResourceCategory, SubscriptionId, PolicyAssignmentId, LastEvaluated | join kind=inner ( policyResources | where type =~ 'microsoft.authorization/policyassignments' | extend AssignmentName = tostring(properties.displayName), AssignmentId = tolower(trim(@" ", tostring(id))), Scope = tostring(properties.scope), PolicyOwner = tostring(properties.metadata.owner) | where AssignmentName has "CSTM--Configure blob soft delete on a storage account" or AssignmentName has "Configure Azure Activity logs to stream to specified Log Analytics workspace" or AssignmentName has "Audit diagnostic setting for selected resource types" | project AssignmentId, AssignmentName, Scope, PolicyOwner ) on $left.PolicyAssignmentId == $right.AssignmentId | project SubscriptionId, ResourceId, ResourceName, ResourceCategory, AssignmentName, AssignmentId, Scope, ['LastEvaluated[UTC]'] = LastEvaluated What this query is doing — in plain English This query finds Azure resources that are currently NonCompliant with Azure Policies by reading data from the PolicyStates table in Azure Resource Graph. It extracts useful details such as Resource ID, Resource Name, Resource Type/Category, Subscription ID, Policy Assignment ID, and the last evaluation timestamp. Resources are categorized into groups like VM, Storage, Network, SQL, and Key Vault based on their resource type/provider. It then joins the non-compliant resources with specific policy assignments (three named policies) to show which policy caused the non-compliance, along with the policy scope, and evaluation time. Why CISOs and governance leaders should care For a CISO, this is not about counting failed evaluations. It is about knowing whether critical controls are drifting, where the risk sits, and who owns the response. Three use cases stand out: Audit readiness: show control-focused evidence instead of a flat list of resource IDs. Ownership: enrich assignments with metadata so findings can be routed to the right team faster. Prioritization: focus on the controls that matter now, not every non-compliant resource in the estate. Operational benefits: scalable, repeatable, and security-friendly From an engineering perspective, this pattern is attractive because it is repeatable, scalable, and aligned to the native Azure Policy data model. It also fits naturally into operational tooling. The enriched output can feed workbooks, dashboards, Sentinel content, and alerting workflows. Closing thought At small scale, Azure Policy can be reviewed in the portal. At enterprise scale, that quickly becomes noise. The better question is not Which resources are non-compliant? It is Which important controls are failing, where, and who should act? That is what makes this pattern powerful: it turns Azure Policy from a compliance dashboard into a control intelligence layer that works for both engineers and executives.When Arc Goes Silent: Turning Visibility Gaps into SOC Action
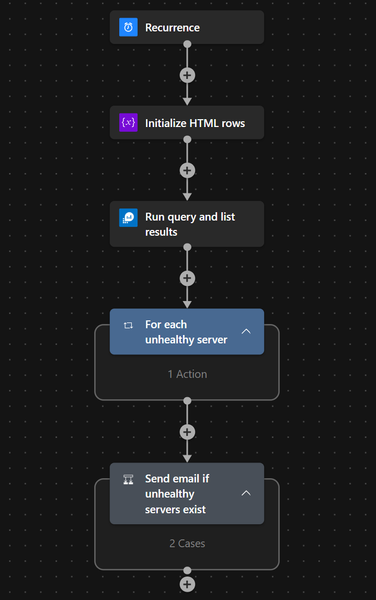
Hybrid blind spots rarely announce themselves. They appear when an Azure Arc-enabled server drops out, health signals go stale, and the SOC loses confidence in monitoring coverage. This playbook uses Microsoft Sentinel and Logic Apps to turn that noise into one clear daily signal the team can act on. The problem: too much noise, not enough assurance One unhealthy server, one alert, one more email—at scale, that does not help the SOC. What leaders need is assurance: where visibility is weakening, which systems matter, and when action is needed. The use case: daily assurance for hybrid monitoring coverage The use case is simple: identify Arc-enabled servers that stay unhealthy beyond a set threshold, such as 30 minutes, and send one consolidated summary each day. For a CISO, this improves assurance. For a SOC Manager, it cuts noise and helps teams prioritize faster. Solution overview: simple automation, stronger operational signal The workflow runs on a schedule, queries Log Analytics, filters Arc health issues, formats the results into a clean HTML report, and sends a single email through Office 365 Outlook. The outcome is not more telemetry—it is a better operational signal. Prerequisites One or more Azure Arc-enabled servers connected to Azure. Azure Monitor Agent installed and sending heartbeat data to a Log Analytics workspace. Microsoft Sentinel enabled on the target workspace if the playbook is being used as part of SOC operations. A Logic App with permissions to run the query and send email through Office 365 Outlook. A reviewed threshold, recipient list, and notification cadence aligned to your operating model. How the workflow creates decision-ready visibility In practice, this becomes a daily control: check Arc health, isolate persistent issues, and route one concise summary to the right teams. That gives the SOC a cleaner way to review monitoring gaps before they become bigger operational problems. Why this matters to a CISO and SOC Manager For security leadership, this is about confidence. If Arc health degrades on systems tied to monitoring, policy, or data collection, the risk is not just technical—it is a visibility gap. This playbook helps surface that gap early and in a form teams can act on quickly. Three practical scenarios where this playbook delivers value Reduce SOC noise.Replace scattered alerts with one daily summary. Strengthen executive assurance.Highlight persistent blind spots before they turn into escalations. Improve team coordination.Give security and infrastructure teams one shared view of the issue. Sample KQL to identify persistent Arc monitoring gaps This sample query uses the Heartbeat table to identify Azure Arc-connected machines whose latest heartbeat is older than the defined threshold. It is a practical starting point and can be tuned further based on the environment and data collection design. let ThresholdTime = 30; AzureActivity | where TimeGenerated > ago(1d) | where CategoryValue == "ResourceHealth" | where parse_json(Properties).currentHealthStatus == "Unavailable" | where ActivityStatusValue == "Active" | extend ResourceType = Properties_d.resourceProviderValue | where ResourceType == "MICROSOFT.HYBRIDCOMPUTE" | extend StartTime = TimeGenerated | extend ServerName = Properties_d.resource | join kind=leftouter ( AzureActivity | where ActivityStatusValue == "Resolved" | extend ResourceType = Properties_d.resourceProviderValue | where ResourceType == "MICROSOFT.HYBRIDCOMPUTE" | extend EndTime = TimeGenerated ) on CorrelationId | extend Minutes_OfflineTillResolve = datetime_diff('minute', EndTime, StartTime) | project ServerName, StartTime, EndTime, CorrelationId, Minutes_OfflineTillResolve, Level, ActivityStatusValue1, ResourceGroup, OperationNameValue, SubscriptionId, ResourceProvider, Type, CategoryValue, ActivityStatusValue | extend TotalMinutes_Offline = datetime_diff('minute', now(), StartTime) | where TotalMinutes_Offline >= ThresholdTime and ActivityStatusValue1 !has "Resolved" | order by TotalMinutes_Offline desc Operational flow ARM Template: microsoft-security-operations-toolkit/Microsoft Sentinel/Automation/Playbooks/AzureArcServerMonitoring.playbook.json at 1e3aeff329e0d9b1d7caf2e4bfbc8476dfdb2ff2 · Abhishek-Sharan/microsoft-security-operations-toolkit Customization Ideas: Adjust the heartbeat threshold based on server criticality or business hours. Route summaries to different teams based on subscription, resource group, or server tags. Send notifications to Microsoft Teams in addition to, or instead of, email. Enrich the output with owner, business service, or environment metadata. Trigger incident creation only for high-priority or repeated visibility gaps. Closing perspective The best SOC automations do not just collect signals—they create clarity. This playbook helps security teams spot Arc-related monitoring gaps early, reduce noise, and act with more confidence.