cloud native
158 TopicsAzure Container Apps Sandboxes, Now Generally Available
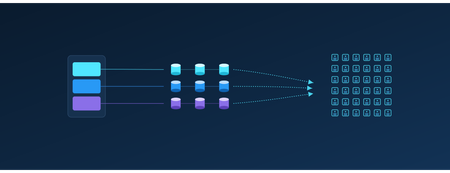
Agents Act. You Set the Limits. Your platform needs to run untrusted code. Agents choose actions at runtime, from installing packages to calling APIs. In a multi-tenant service, you have to support both without letting one customer's code reach another customer's data. That requires an execution environment you control for each tenant, session, or task. Azure Container Apps Sandboxes is that execution environment, as a service. Each sandbox is a hardware-isolated microVM with its own Linux kernel. It starts in under a second, and you decide per sandbox what it can reach, how large it is, and how long it lives. For each user, controlling which credentials their agent can use and what it can reach is key. Untrusted code must stay isolated from other workloads and the host kernel. Preserving a session state without giving up scale to zero or instant startup is important, as is visibility into what each agent did. Let's unpack these one at a time. Control What Your Agents Can Reach The first question about an agent is not what it can do, but what it can reach. Per-sandbox egress policies answer that: an external proxy evaluates every outbound request against rules you set - by host, domain pattern, or CIDR. You can start with a default 'Deny' action and allow only the endpoints the task needs, so a prompt injection or a compromised dependency has nowhere to go. Network Audit shows you what was allowed and what was denied. Approved endpoints usually need credentials, and handing an API key to an agent means the key can be logged, echoed into a response, or carried off somewhere you did not intend. Transform rules can inject authentication headers outside the sandbox. The agent sends a request with no secret in it, the proxy adds the credential outside the sandbox, and the call goes through. The agent gets access to the service without ever getting the API key. When a static allowlist cannot express the rule you need, an egress webhook hands each request to your own service before it leaves. You can build a service that reviews all outbound calls, approves some and rejects others. Good results depend on the agent reaching the right data, and the data that matters usually sits on your private network. Outbound, VNet integration places the sandbox group on a dedicated subnet, so agents can reach internal APIs, databases, and services behind private endpoints. Egress rules are still enforced: routing is chosen per rule, so a call to an internal database is filtered, transformed, and recorded in Network Audit exactly like a call to the open internet. Inbound, a Private Endpoint brings the sandbox service into your VNet, so your own applications reach into your sandboxes without crossing the public internet. Run Untrusted Code Without Sharing a Kernel Each sandbox runs in a hardware-isolated microVM with its own Linux kernel and virtual hardware, with memory separation enforced through CPU virtualization. In contrast, typical container runtimes isolate processes while sharing the host kernel. In a sandbox, code calls into its own guest kernel, so the blast radius of a kernel exploit is one sandbox. You get that boundary with ACA Sandboxes. Inside that boundary, the filesystem is yours to choose. The quickest way to start is by creating a sandbox based on a platform-provided disk image: Public image Ready for ubuntu General-purpose Linux execution and development tools nginx Running a web server copilot, claude GitHub Copilot CLI or Claude Code workflows azure-dev Azure development with CLI tools and multiple language runtimes python-3.12-code-interpreter Isolated Python execution through REST and MCP python-3.11 to python-3.14 Python workloads node-22, node-24 Node.js workloads dotnet-8 to dotnet-10 .NET workloads php-8.3, php-8.4 PHP-FPM workloads Availability and versions change over time, please check the portal's catalog for the current list. Images are provided as is. For a custom environment with your own code and dependencies, you can bring a container image from a public or private registry. The platform converts it into an optimized, bootable disk image containing your application, agent harness, runtimes, and toolchain. For a private registry, you authenticate with registry credentials or a managed identity for Azure Container Registry. You can also start from a sandbox you already have running. A disk snapshot captures the filesystem as a new disk image, while a memory snapshot captures disk and memory together, so a sandbox created from it resumes where the original left off. Installed dependencies, or a cloned repo, are set up once, and every sandbox created from the snapshot starts with them. Give Every Task Its Own Sandbox A sandbox starts in under a second, and that is why it is practical to give every task its own machine. When a machine takes minutes to come up, everything ends up sharing that same space. When it starts instantly, each task, user, or tool call runs in isolation, and gets deleted when the work is done. Thousands at a time. Sandboxes are sized when created by selecting a resource tier. These range from 0.25 vCPU with 0.5 GB of memory and a 5 GB disk, enough for a short script or a quick evaluation, to 4 vCPU with 8 GB of memory and an 80 GB disk for compilation and heavier analysis, with multiple steps in between. Programmatically you can go up to 16 vCPU with 32 GB of memory and a 320 GB disk for the most demanding work. Sandboxes do not have to be discarded by hand. Lifecycle policies stop a sandbox once it goes idle, capturing the disk and optionally the memory. It can resume on a start command or automatically on arriving network traffic. A policy can also auto-delete a sandbox that has been stopped long enough, so abandoned work does not linger. Keep State and Bring Your Data Most agent tasks are short - run a script, or return a result. That is not the limit. A long-running agent needs state that outlives single runs, and volumes attach persistent storage to a sandbox at a path you choose. Code reads and writes to it through ordinary filesystem calls, and the data stays after the sandbox is deleted. There are three kinds: A Data Disk mounts to one sandbox at a time and gives it a fast, fully POSIX-compatible filesystem on local disk, which suits a working database, a build cache, or an agent's accumulated memory. An Azure Blob volume mounts to many sandboxes at once, for sharing a large read-heavy dataset rather than supporting concurrent writers. Azure Blob BYO volume (bring your own) does the same for blob storage you already own, referenced by resource ID. See What Your Sandboxes Are Doing Observability is how you know what a fleet of short-lived sandboxes did. Telemetry is opt-in and configured per sandbox when you create it, and it streams out while the sandbox runs, so you can go back to a run that finished hours ago. A sandbox emits four categories of data, and you choose which of them to collect: Category What it carries Console logs The stdout and stderr streams from each sandbox Sandbox metrics (platform) Platform-managed CPU usage, memory consumption, and network I/O per sandbox, sampled on an interval you set OpenTelemetry Signals emitted by your own application; the sandbox injects the OTLP endpoint, so an SDK you already use exports with no extra configuration Network egress decisions One record per outbound request, with the allow or deny decision the egress policy made Each category is then pointed at a destination: any OTLP-compatible collector, Log Analytics through the Logs Ingestion API, or Application Insights. They mix freely, so console logs can go to your collector while egress decisions go to Log Analytics. The credential that writes to the destination never enters the sandbox. OTLP resolves their from a sandbox-group secret, Log Analytics authenticates with a managed identity on the group. Separate from what a sandbox exports, the platform publishes cores and memory to Azure Monitor on the sandbox group, and that is what the portal shows for a Sandbox group. Sandbox group totals come by default, and you can opt-in for per sandbox details if you need that level of granularity. Use It From Code, a Shell, or a Browser Every one of these operations is available from code, a shell, a template, or a browser, so the choice comes down to what you are doing at the time. When the sandbox is part of your application, use an SDK. Today available for Python and TypeScript, with .NET on the way. An app or service you build creates sandboxes, writes and reads files, runs commands, mounts volumes, and captures snapshots as native objects in the language you use. When the work is scripted, the ACA CLI covers the same surface from Bash or PowerShell: aca sandbox create --disk ubuntu or aca sandbox snapshot. Commands accept label selectors, so automation and CI act on -l name=build-agent instead of tracking generated IDs. When the group itself is managed in source control, define it as infrastructure as code. Microsoft.App/sandboxGroups is a first-class ARM resource, so a Bicep template attaches a managed identity, links a delegated VNet subnet, and assigns data-plane roles. An ACA Terraform provider (Preview) covers the same group-level controls for teams standardized on Terraform. Sandboxes portal Designing a new resource type from scratch let us rethink the portal experience along with it. The creation flow asks the minimal set of questions - a disk image and resource tier - and you have a running sandbox. The Advanced section allows you to go deeper to ports, volumes, lifecycle policies, egress policies, logging and more. All there when you need it. What you see afterward is tailored the same way. A sandbox group gives you the overview of all sandboxes in that group: how many exist and how many are running, cores and memory in use over time. The most recent sandboxes with their state and size, and the disk images and snapshots the group can build from. A single sandbox gives you the machine: a terminal, live CPU, memory, storage, and network, a log stream, running processes, the files on disk, mounted volumes, and the egress traffic it generated with each request marked allowed or denied. You get that same experience wherever you start. Reach sandboxes from the Azure portal, alongside the rest of your resources and under the same subscriptions, RBAC, and policies, or go straight to the standalone ACA Sandboxes portal. It is the same experience either way, so there is nothing to relearn and nothing you can only do in one of them. How Much Does It Cost? Three types of charges: vCPU, per core-second while the sandbox runs. Memory, per GiB-second while the sandbox runs. Storage, per GB stored, for as long as you keep it. The resource tier of the sandbox determines the amount of vCPU and GiB of memory. These rates are on the Container Apps pricing page. Storage is charged (coming soon) at Premium Azure Blob ZRS rates and covers: Custom Disk Images, including Disk Snapshots. The platform converts your OCI container image into a bootable disk image. You pay to store one copy of that image for as long as you keep it, regardless of how many sandboxes boot from it. The OS disk each of those sandboxes runs on is not billed. Snapshots are the combined memory and disk snapshots of your sandboxes, including those taken automatically when a sandbox stops. Optional Data Disk Volumes and Azure Blob Volumes that can be attached to sandboxes. Thank You and What Comes Next General availability is not the destination, it is where many more of you get to start. During public preview that we announced in June 2026, the usage surpassed quickly a million sandboxes created every day. Our team worked closely with early customers that provided valuable feedback that shaped the product as it's today. From teams running real workloads on sandboxes ranging from cloud-native SaaS companies like Templafy to global organizations like KPMG and Cognite. KPMG built their Cowork AI Agent for their global workforce on ACA Sandboxes. Cognite uses ACA Sandboxes in their industrial Atlas AI system. Lastly, the Department for Education, South Australia - uses ACA sandboxes to power their EdChat - A safe place for every learner. We run the EdChat so students can learn by writing code and exploring data alongside AI, across 60,000 students and more than 40,000 staff. That model only works if every student gets an environment of their own, with clear guardrails, and can come back later to find their work exactly as they left it. Building that in house meant owning the machinery behind it. We estimate that moving to Azure Container Apps Sandboxes lets us retire close to 50,000 lines of code written to manage custom code interpreter and state ourselves. It is the per-user execution model that scales for our school system, and a lower maintenance burden for us. Cody Little, AI Technical Lead, Department for Education, South Australia In addition, many internal customers at Microsoft adopted ACA Sandboxes to build and enhance their products for their customers. Among those Microsoft Foundry built hosted agents, Copilot Studio hosts agents you create - both on ACA Sandboxes and – our very own Azure Container Apps Express built a modern and fast serverless container platform on sandboxes. Their feedback and your feedback set the next priorities, and we are grateful to you for it. Three focus areas of work that follow: Sandbox groups get more control and visibility, so a platform team can observe sandboxes, audit and enforce policies at the sandbox group level. Broad extensibility with more SDKs and tighter integration with VS Code. Lastly, extensive interoperability with Connectors and Triggers (now in preview) that will provide even larger customizability and on-behalf-of authentication (OBO), so agents securely reach the systems needed to do their job. Next Steps Open the ACA Sandboxes portal and create a group with a sandbox. Clone the samples repo and start with the working code. Read the documentation for the quick starts and the reference behind everything above. We appreciate your feedback, please submit it in the ACA Sandboxes portal, or open an issue in the Azure Container Apps repo Issues · microsoft/azure-container-apps.783Views2likes0CommentsAzure Container Apps Express is now Generally Available
For many web apps and APIs, a container image should be enough to get started. Developers should not have to choose and configure an environment before the first deployment. Today, Azure Container Apps Express reaches general availability. It is the fastest way to go from a container image to a production-ready app on Azure, with instant provisioning, startup optimized for sub-second performance, and scale-from-zero. Customers created many thousands of Express apps during public preview and told us, clearly and often, what was missing. That feedback set the priorities for general availability, and it continues to guide what comes next. From container image to running app Express starts with the application. Bring a container image, choose a region, add the configuration your app needs, and deploy. In the Express experience, there is no environment to stand up first. Azure provisions the underlying compute, ingress, and scaling. That shorter path matters when you are shipping a web app or API. It matters even more when the thing doing the shipping is an agent: AI-assisted workflows can create and update apps far faster than anyone can configure infrastructure by hand. Speed continues after deployment. Express apps can scale to zero when idle and are optimized for sub-second startup when traffic returns. For a measured look at that experience, see Express scale from zero. Broad regional availability At general availability, Express is available in more than 40 Azure regions, covering almost every public region where Azure Container Apps is offered. You get the same direct deployment experience while placing applications close to users and data. See the current list in the Express region availability documentation. Built on Azure Container Apps Sandboxes Azure Container Apps Express runs on Azure Container Apps Sandboxes, the isolated compute layer behind its provisioning and startup speed. Developers can also use Sandboxes directly to build agent platforms, secure code-execution services, and other systems that need isolated compute on demand. The Azure Container Apps Sandboxes announcement covers the compute platform underneath Express. Where Express goes next We launched Express in public preview while its focused feature set was still taking shape. That gave customers access sooner and let real usage shape the work that followed. Since preview, we have expanded regional availability, strengthened Express for production workloads, and added capabilities that fit its direct application model. General availability makes Express ready for production use. We will continue adding features while preserving its focus on fast, simple deployment. Express offers a focused subset of Azure Container Apps capabilities. Choose Express when speed and simplicity matter most. Choose a standard Container Apps environment when you need greater control over networking, GPU compute, advanced configuration, or environment-level capabilities such as Dapr. Deploy your first Express app Ready to try it? Create an Azure Container Apps Express app. Then read the Express documentation, see Express scale from zero, or learn about Azure Container Apps Sandboxes.534Views0likes0CommentsIntroducing a Guided Copilot Experience for Building Azure Apps in VS Code
Today we're previewing a new way to build cloud apps with GitHub Copilot in VS Code: a guided Copilot experience that takes you from idea to a deployed Azure app through a structured, predictable workflow instead of a free-form chat session that may or may not land where you need it to. The problem: Copilot is powerful, but unpredictable Ask Copilot to "build me a Node.js API on Azure Functions with a Postgres database" today, and you might get a working project, or you might not. Sometimes Copilot scaffolds the app but skips infrastructure. Sometimes it generates a deployment script that fails halfway through. Sometimes it forgets what you were building three prompts later. The underlying model is capable. The problem is the shape of the experience: an open-ended chat with no checkpoints, no guardrails, and no consistent path from "I have an idea" to "it's running in Azure." How it works The guided Copilot experience adds to that open-ended flow with three clear, explicit stages: 1. Project scaffolding: Describe your app in plain language. Copilot proposes an architecture and asks for anything that is missing (e.g., language, app type, Azure services) through simple forms and pickers, not more back-and-forth chat. You review and approve the plan before any code is written. 2. Local development: Your project is scaffolded then Copilot checks for the runtimes, emulators, and tools you'll need and helps you install what's missing, so the project runs locally from the very first launch. Debug configurations are wired up automatically, so you can test and iterate on your app before it ever touches Azure. 3. Deployment: Copilot shows the tools that will be used for deployment along with a summary of all resources that will be created and a cost estimate so you can be confident in what you're getting. Infrastructure files are created for your app to ensure a consistent and reproducible deployment environment for testing and staging before going to production. Deployment runs through the same reliable tooling used across Azure (az and azd), so if something goes wrong, you get a clear explanation and a concrete next step instead of a wall of CLI output. Once your app is live, the guided experience doesn't disappear, Copilot retains context about your project's architecture, so coming back later to add a service or make a change picks up right where you left off. 🎉 What this means for how you work Determinism over guesswork. The same input reliably produces the same kind of outcome, so no more wondering which "mode" Copilot is going to be in. First try success. Projects are built to run and deploy on the first attempt, not after several rounds of manual repair. Structure over chat walls. Decisions that matter such as architecture choices, missing configuration, and deployment targets are surfaced through real UI, so you're not parsing paragraphs of text to figure out what Copilot needs from you. Stay in VS Code. The entire journey, from planning through deployment, happens without leaving your editor. What's in the initial preview The first version focuses on JavaScript and TypeScript projects, including web apps, Azure Functions, Container Apps, and Static Web Apps, with support for PostgreSQL, Azure Storage, Azure Key Vault, and Azure OpenAI. .NET and Python support are on the roadmap for a future release. Nothing about your existing Copilot workflows changes, the guided experience is an additional, opinionated path alongside the free form chat you already know, for when you want a reliable, structured way to go from zero to deployed. What's next This is an early look at a broader shift in how we think about AI-assisted development on Azure: less "ask and hope," more structured collaboration with clear checkpoints and real UI where it counts. We're continuing to expand language support, refine the deployment experience, and incorporate feedback from developers using it in the wild. Install the Azure Tools extension pack and open an empty folder to try the guided Copilot experience and let us know what you think. File issues or share feedback on the GitHub repo.802Views2likes0CommentsWiring Azure DevOps Pipeline Templates Without the Parameter Sprawl: The Manifest Facade Pattern
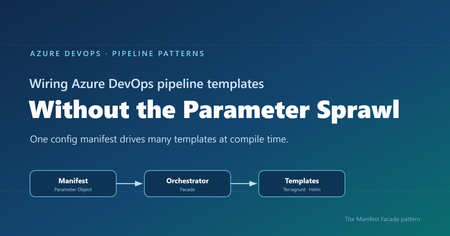
Where reusable pipelines start to hurt Who this is for: Platform and DevOps engineers who build shared Azure DevOps Pipeline Templates and want other teams to adopt them consistently. If you have ever built a set of shared Azure DevOps Pipeline Templates, you probably know how this goes. You write a whole library of clean, well-factored templates: provisioning infrastructure, deploying apps, scanning, promotion, and more. Each one is tidy on its own. Then the first team tries to actually use them together, and things get messy fast. That is exactly what happened to us on a customer engagement, while building a DevOps framework for their engineering teams. The templates themselves were fine. The trouble was wiring them together. Every consumer pipeline had to know how to call each template it used: the right order, which values one template fed another, and the full parameter list for every one of them. As the library grew, those consumer pipelines grew with it, long and repetitive. That friction turned into a real adoption problem. Getting started meant wading through pages of parameters, so teams put it off, copied whatever the team next door had, or quietly built their own thing instead. This post follows that story, from the tangle of parameters to the solution we landed on. Here is how it comes together. Where we started: Good templates, hard to adopt The DevOps framework we built had many templates. To keep this walkthrough concrete, we will follow just two of them: one that provisions infrastructure with Terragrunt (a wrapper around Terraform), and one that deploys an app to Kubernetes with Helm. Both are trimmed down to the essentials here so they are easy to follow. The infrastructure template, templates/infra/terragrunt-deploy.yml : parameters: - name: stack type: string - name: workingDir type: string steps: - script: | cd ${{ parameters.workingDir }} terragrunt plan -out=tfplan terragrunt apply -auto-approve tfplan displayName: "Deploy ${{ parameters.stack }}" The application template, templates/app/helm-deploy.yml : parameters: - name: releaseName type: string - name: chart type: string - name: namespace type: string - name: imageTag type: string steps: - script: | helm upgrade --install ${{ parameters.releaseName }} ${{ parameters.chart }} \ --namespace ${{ parameters.namespace }} \ --set image.tag=${{ parameters.imageTag }} displayName: "Deploy ${{ parameters.releaseName }}" There is nothing wrong with either file. The pain showed up in the pipeline that had to use them, where a team had to stitch the templates together by hand, remember the order, and repeat that boilerplate for every environment. Do that across a dozen services and you get long, copy-pasted pipelines that teams struggle to adopt. And because the wiring is done by hand, it leaves loopholes: a team can skip a step or override a parameter and slip past the guardrails you thought were in place. Challenge 1: Wiring the templates together The obvious move was to hide the wiring behind a single template that owned the order and the plumbing. We called it the orchestrator template: a consumer pipeline called that one template, and it wired up the rest. # templates/deployment-orchestrator.yml (the single orchestrator) parameters: - name: infraStack type: string - name: infraWorkingDir type: string - name: releaseName type: string - name: chart type: string - name: namespace type: string - name: imageTag type: string # ...and this list just kept growing stages: - stage: Infra jobs: - job: infra steps: - template: infra/terragrunt-deploy.yml parameters: stack: ${{ parameters.infraStack }} workingDir: ${{ parameters.infraWorkingDir }} - stage: App dependsOn: Infra jobs: - job: app steps: - template: app/helm-deploy.yml parameters: releaseName: ${{ parameters.releaseName }} chart: ${{ parameters.chart }} namespace: ${{ parameters.namespace }} imageTag: ${{ parameters.imageTag }} A team used it by calling that one template and passing a value for every parameter it exposed: # azure-pipelines.yml (a team's pipeline) parameters: - name: imageTag type: string extends: template: templates/deployment-orchestrator.yml parameters: infraStack: network infraWorkingDir: infra/network releaseName: orders-api chart: charts/orders-api namespace: orders imageTag: ${{ parameters.imageTag }} # ...and a value for every other parameter, too This solved the ordering and the copy-paste, but it handed us a new headache. This one template now had to expose every parameter of every template underneath it, and the list grew each time we added a capability. Worse, a real service usually needed more than one infrastructure stack and more than one Helm release. A flat list of parameters cannot express “two infrastructure stacks and three Helm releases” without silly names like infraStack1 , infraStack2 , and so on. Nobody could learn the thing. We had solved the wiring, only to trade it for a parameter problem. Challenge 2: The orchestrator’s parameter list explodes So how do you shrink that list? Step back and ask what you are really describing: a set of things to deploy. So the input should describe that set, not a long flat list of loose values. That is where the deployment manifest came in: one small config that lists the infrastructure to create and the apps to deploy. It reads about how you would expect: infrastructure: - stack: network workingDir: infra/network applications: - releaseName: orders-api chart: charts/orders-api namespace: orders Now the orchestrator can take that single manifest and loop over it, instead of exposing dozens of separate parameters. Its parameter list collapses to one, and a ${{ each }} loop turns each entry into a stage or job: # templates/deployment-orchestrator.yml (the orchestrator, now manifest-driven) parameters: - name: manifest type: object - name: imageTag type: string stages: - stage: Infra jobs: - ${{ each stack in parameters.manifest.infrastructure }}: - job: infra_${{ stack.stack }} steps: - template: infra/terragrunt-deploy.yml parameters: stack: ${{ stack.stack }} workingDir: ${{ stack.workingDir }} # ...an App stage loops over parameters.manifest.applications the same way And a consumer passes that manifest straight to the orchestrator: # azure-pipelines.yml (a team's pipeline) parameters: - name: imageTag type: string extends: template: templates/deployment-orchestrator.yml parameters: imageTag: ${{ parameters.imageTag }} manifest: infrastructure: - stack: network workingDir: infra/network applications: - releaseName: orders-api chart: charts/orders-api namespace: orders The parameter problem is solved. But hand-writing that whole manifest inside every pipeline is a lot to repeat, so the natural instinct is to pull it out into its own file. That is where things get tricky. Challenge 3: The manifest is read too late to shape the pipeline So we tried exactly that: we moved the manifest into a deployment-manifest.yml file and had the orchestrator read it back and expand it into stages and jobs. It sounded reasonable, but it did not work. To see why, you need to know how Azure DevOps builds a pipeline before it runs anything. An Azure DevOps pipeline actually happens in two phases, and they are further apart than people expect. First comes the build phase, before anything runs. Azure DevOps reads your YAML, pulls in every template, evaluates every ${{ }} expression, and unrolls every ${{ each }} loop. Out of this it produces one final, fully assembled pipeline. At this point no agent has started and no repo has been checked out. Only parameters and template expressions exist yet. Then comes the run phase. The assembled pipeline runs. An agent starts, checks out your code, and only now can a script open a file on disk. Here is the problem. Your deployment-manifest.yml does not exist as far as the pipeline is concerned until an agent checks out the repo, and that checkout happens during the run phase. So if the manifest is supposed to decide how many stages there are, or how many apps each get their own job, that decision has to be made earlier, while the pipeline is still being built. Important: The shape of the pipeline, its stages, jobs, and loops, is locked in while the pipeline is being built. A file you read during the run comes too late to change any of it. That was the wall we hit. The manifest was the right idea, but reading it from a file happened too late for the orchestrator to turn it into stages and jobs. So the manifest could not come from a file read during the run phase. It had to already exist, as an object, before the pipeline was assembled. The Manifest Facade pattern: Build the config while the pipeline is assembled The solution is to stop thinking of the manifest as a file to read, and start thinking of it as an object you build while the pipeline is being assembled. Parameters are available then. Template expressions can build a whole object then. So we added a small template, kept in the team’s own repo, with one job: take a couple of simple inputs, build the full manifest from them, and pass it to the shared orchestrator. We called it the builder, since assembling the manifest is its only job. It stays thin and lives next to the team’s pipeline, while the orchestrator stays in the shared platform repo. This is not a brand-new invention so much as a few familiar ideas working together, applied at pipeline build time. The manifest is a Parameter Object (Martin Fowler’s refactoring for collapsing a long parameter list into one structured value). The orchestrator is a Facade (the Gang of Four pattern for putting one simple, unified interface over a subsystem, here the underlying leaf templates). And the small template in the team’s repo is the piece that assembles that Parameter Object from a couple of inputs. What makes it an Azure DevOps pattern is the timing: the manifest is built as an object while the pipeline is assembled, so it can drive template expansion instead of sitting in a file that only gets read during the run. That is the twist we did not see written down anywhere, so we gave it a name: the Manifest Facade pattern. In practice it comes together in three small pieces: the consumer pipeline references the builder, the builder assembles the manifest and hands it to the shared orchestrator, and the orchestrator expands that manifest into stages and jobs. Here is how the files extend into one another: Here is each piece in turn. Step 1: The consumer references the builder The consumer pipeline extends the builder that lives in its own repo. It also declares the shared platform repo as a resource, so the orchestrator the builder calls is available while the pipeline is built. # azure-pipelines.yml (the team's pipeline) parameters: - name: imageTag displayName: Image tag type: string resources: repositories: - repository: platform type: git name: platform/pipeline-templates ref: refs/tags/v1.0.0 trigger: - main extends: template: config/deployment.yml@self parameters: environment: dev service: orders imageTag: ${{ parameters.imageTag }} Because the image tag is a runtime parameter, it is declared here in the consumer pipeline, which is what makes it appear in the Run pipeline panel for someone to fill in. Beyond that, the team passes only an environment and a service name, and the builder works out the rest. Step 2: The builder assembles the manifest The builder takes those inputs and assembles the whole manifest from them, then hands it to the orchestrator. Every structural value here is a parameter or a template expression, so all of it is ready while the pipeline is being assembled. # config/deployment.yml (builder, in the team's repo) parameters: - name: environment type: string - name: service type: string - name: imageTag type: string extends: template: deployment-orchestrator.yml@platform parameters: imageTag: ${{ parameters.imageTag }} manifest: schemaVersion: v1 infrastructure: - stack: network workingDir: infra/${{ parameters.environment }}/network applications: - releaseName: ${{ parameters.service }} chart: charts/${{ parameters.service }} namespace: ${{ parameters.service }} The builder assembles the manifest inline from the environment and service, then passes it straight to the orchestrator. The image tag is different: it is a runtime parameter the user supplies at queue time, so it is passed through to the orchestrator template and never becomes part of the manifest. The team gets a tiny interface, and the orchestrator still gets the full structure it needs. Step 3: The orchestrator turns the config into stages and jobs The orchestrator takes a single object and loops over it with ${{ each }} . Each stage and job gets generated while the pipeline is assembled. # deployment-orchestrator.yml (shared platform repo) parameters: - name: manifest type: object - name: imageTag type: string stages: # a ValidateManifest stage runs first (covered in the next section) - stage: Infra jobs: - ${{ each stack in parameters.manifest.infrastructure }}: - job: infra_${{ stack.stack }} steps: - template: infra/terragrunt-deploy.yml parameters: stack: ${{ stack.stack }} workingDir: ${{ stack.workingDir }} - stage: App dependsOn: Infra jobs: - ${{ each app in parameters.manifest.applications }}: - job: app_${{ app.releaseName }} steps: - template: app/helm-deploy.yml parameters: releaseName: ${{ app.releaseName }} chart: ${{ app.chart }} namespace: ${{ app.namespace }} imageTag: ${{ parameters.imageTag }} Because the manifest is a real object by the time the loops run, ${{ each }} unrolls it into actual jobs. List two stacks and you get two jobs. List two apps and you get two deploy jobs. And because the team only describes what to deploy, the sensitive wiring like service connections stays inside the platform templates, out of reach. The loophole is gone because the parameter is gone. Why the order of things matters The whole pattern comes down to who does what, and when. The builder turns a simple intent (“deploy orders to dev”) into a full manifest, while the pipeline is being assembled. The orchestrator turns that manifest into real stages and jobs, still while the pipeline is being assembled. Only the leaf templates do the real deployment work during the run: checkout, terragrunt apply , helm upgrade . Nothing about the shape of the pipeline waits for the run, so nothing about it depends on a file that only shows up after checkout. That is the whole trick. If you do have values you genuinely cannot know until the run, like a secret fetched from a vault or an artifact version an earlier stage writes to a variable, those still belong in runtime variables and variable groups. The manifest is for the structure and config you already know when you queue the build, which is almost always the part that was causing the pain. Validating the manifest against a schema Once the manifest became the one interface every team fills in, it needed a contract. We wrote that contract as a JSON Schema and kept it in the shared platform repo under schema/v1/ . The folder name is the version: backward-compatible additions go straight into v1 , and the day we need a breaking change we add a schema/v2/ alongside it, so existing consumers keep working while the schema evolves. Each manifest carries a schemaVersion so the orchestrator knows which contract to hold it to. On top of that, we validate in three layers, each catching a different class of mistake. Layer 1 is build time, for free. Because the orchestrator’s parameters are typed, with manifest declared as an object , Azure DevOps catches a range of structural problems while it expands the templates, before anything runs. For example, if a manifest left out infrastructure or misspelled it, the orchestrator’s ${{ each stack in parameters.manifest.infrastructure }} loop would have nothing valid to iterate over, and the failure would surface during template expansion rather than halfway through a deployment. Layer 2 is a version check that runs at build time. Both the ${{ if }} and parameters.manifest.schemaVersion are resolved while the pipeline is being assembled, so the orchestrator decides right then whether it understands the manifest’s version. If it does not, the only thing it generates is a single failing stage, and the real deployment stages are never built, so nothing runs against a contract the orchestrator does not know: # deployment-orchestrator.yml (shared platform repo) parameters: - name: manifest type: object stages: # Layer 2: reject schema versions this orchestrator does not understand - ${{ if not(containsValue(split('v1', ','), parameters.manifest.schemaVersion)) }}: - stage: UnsupportedSchemaVersion jobs: - job: fail steps: - script: | echo "##vso[task.logissue type=error]Unsupported manifest schemaVersion '${{ parameters.manifest.schemaVersion }}'" exit 1 # the ValidateManifest, Infra, and App stages below are generated only when the version is supported Layer 3 is a run-time check against the full schema. The first stage the orchestrator generates is ValidateManifest . Because the schema lives in the platform repo, the job checks that repo out first. Then it serializes the manifest object to JSON with the convertToJson expression, writes that JSON out to a file, and runs a JSON Schema checker to compare the file against the schema. If the manifest breaks the contract, the pipeline stops here, before any infrastructure or app stage runs: # Layer 3: validate the real manifest object against the JSON Schema - stage: ValidateManifest jobs: - job: validate steps: # the schema lives in the platform repo, so check it out first - checkout: platform - script: | echo '${{ convertToJson(parameters.manifest) }}' > manifest.json pip install check-jsonschema check-jsonschema --schemafile schema/${{ parameters.manifest.schemaVersion }}/deployment.schema.json manifest.json displayName: "Validate manifest against schema" Layer 1 is automatic, Layer 2 rejects an unknown contract at build time so the deployment stages are never generated, and Layer 3 confirms the actual values match the schema before any real work begins. Together they turn “the manifest looked right” into “the manifest is provably valid.” A few trade-offs to keep in mind No pattern comes without trade-offs. A few things worth weighing: The manifest has to be something template expressions can build. You can compose objects, loop, and branch with ${{ if }} , but there is no running arbitrary code while the pipeline is assembled. Anything fancier may need a prep step or a file generated upstream. Every team carries a small builder template. We think that is a fair trade, since it keeps their intent local and readable, but it is one more file per repo. Keep it thin and let the orchestrator hold the real logic. Treat the schema as living documentation. Because the manifest’s JSON Schema spells out every field and what it means, teams can read it to build their own manifest with confidence, instead of reverse-engineering the orchestrator. Pin the shared repo to a tag, like the v1.0.0 above, so a change to the orchestrator does not silently change everyone’s pipeline on the next run. Debugging takes a small shift in habit. When something looks off, use the pipeline’s preview to see the fully assembled YAML before it runs. It shows you exactly what the loops produced. Tip: Use the Azure DevOps pipeline preview to see the fully assembled YAML without running anything. It is the fastest way to confirm your manifest unrolled into the stages and jobs you expected. Wrapping up It is a journey a lot of platform teams will recognize. Clean templates, messy wiring, one orchestrator that fixes the order but drowns in parameters, a config file that brings back sanity, and then the surprise that reading it at the wrong moment means it can never shape the pipeline. The solution is small and it sticks. Put a thin builder template next to each team, let it assemble the manifest from a couple of simple inputs, and let a shared orchestrator turn that manifest into stages and jobs. Teams get an interface they can easily understand and adopt. The platform team keeps the wiring and the guardrails in one place. And the timing gap that trips up so many “just read the config file” attempts stops being a problem, because you are working with it instead of against it. Key takeaways Shared Pipeline Templates stall on adoption when every team has to wire them together by hand. A single orchestrator template fixes the ordering, but a flat parameter list does not scale to real adoption. A config file read during the pipeline run cannot shape the pipeline, because stages and jobs are decided earlier, while the pipeline is assembled. The Manifest Facade pattern builds the config as an object at assembly time, so one small input drives many templates, consistently and with the guardrails baked in. Give the manifest a versioned JSON Schema and validate it in layers, so a broken contract fails fast instead of halfway through a deployment. How are you handling template sprawl in your own pipelines? We would love to hear what has worked for your teams in the comments.555Views1like0CommentsAzure Container Apps Sandboxes (Preview): Giving AI Agents a Safe Place to Work
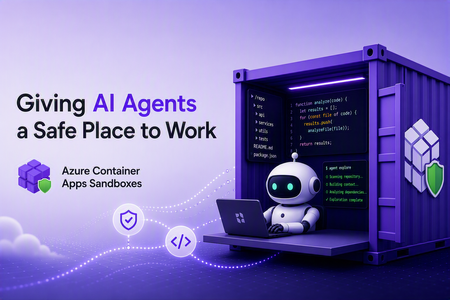
Co-written by Nikoloz Buligini, Front End Developer at Templafy, and Jan Kalis, Azure Container Apps Sandboxes, Core AI, Microsoft Every team building with multi-tenant AI agent platforms hits the same wall. The agent is smart enough to read your code, reason about a bug, and propose a fix. But the moment it needs to take an action - clone a repo, install tooling, run a command, hit an internal endpoint - you have to answer some uncomfortable questions: where does it run, what permissions does it have and what can it access? Run it on your own infrastructure and inherit the blast radius. Give it broad network access and you have handed an autonomous process the keys to your environment. Lock it down too hard and the agent cannot do its job. This is exactly the problem Azure Container Apps Sandboxes was built to solve. And it is exactly the problem the team at Templafy solved in production. This post walks through what Sandboxes are, the features that make them a good fit for agentic workloads and how Templafy put ACA Sandboxes to work. What are Azure Container Apps Sandboxes? Azure Container Apps Sandboxes (Preview) are secure, isolated compute environments that start in seconds, scale to thousands, and do not charge you for compute while stopped. Each sandbox runs inside its own hardware-isolated microVM, fully separated from the host, the platform, and every other sandbox. Bring your own container image or use an included one, and Sandboxes handle provisioning, isolation, and lifecycle. This is the same compute fabric behind products like Cloud sandboxes in GitHub Copilot, Foundry Hosted Agents, and Azure Container Apps Express, and now you can build directly on it. For platform builders, that means enterprise-grade, multi-tenant isolation as a building block you would otherwise spend years creating. For AI agents, a sandbox becomes a self-configurable tool: spin up a fresh environment in seconds, run untrusted code, compile a project, or explore a codebase, then throw it away. On one side you empower humans to build platforms. On the other you empower agents to extend their own capabilities. The features that make Sandboxes fit agentic work A fast microVM is table stakes. What makes Sandboxes practical for real agent workloads is the control around them. Snapshots capture a fully configured environment and resume from it, ideal for long-running tasks or cloning setups. Egress controls declare exactly what a sandbox may reach, so an agent can pull from source control and package registries but nothing you did not approve. Managed identities authenticate to Azure with no secrets in the image. Automatic suspend and resume map cleanly onto how conversational agents behave, warming back up with full context when a conversation continues. Ports give your orchestrator a channel to a long-running agent process inside the sandbox. Two newer capabilities go further: virtual network integration puts an agent workspace inside your own Azure VNet with access to private endpoints, and bring your own storage lets data and artifacts outlive a session under your compliance rules. Together these turn a fast disposable VM into something you can hand to an autonomous agent in production. Which brings us to Templafy. How Templafy uses Sandboxes, in their own words The following section is written by Nikoloz, Front End Developer at Templafy. At Templafy we built an AI agent that helps our teams by doing longer-running source-code exploration on their behalf. Someone asks a question in a Slack thread, and behind the scenes the agent needs a real, isolated workspace where it can clone repositories, run tooling, and dig through code without touching anything it should not. It started as an engineer-facing tool for deep technical questions, but we recently opened it up to our product team for questions about undocumented product behavior. There, the agent first checks our Help Center through Azure AI Search with no sandbox required and only spins up a sandbox to explore the code when the docs come up short. Since these users aren't engineers, we summarize what the exploration finds into something more approachable. Funnily enough, the product team has been using it more than engineering does, and the feedback since launch has been great. We needed strong isolation, fast startup, and tight control over what each workspace could reach. Azure Container Apps Sandboxes gave us exactly that. We were sold on the model early enough that we built our own TypeScript SDK for Sandboxes before there was an official one, so we could drive the whole lifecycle from our Node stack. Here is what happens when the AI decides to start a workflow for a Slack thread: Create a sandbox from the public node-24 image. Install Git and other development tools. Clone our repositories and configure OpenCode. Restrict egress to only the Azure DevOps, package registry, and service endpoints the agent actually needs. Expose a port used to communicate with the agent runtime. Create and reuse snapshots so we do not repeat the bootstrap process on every run. Associate successful sessions with their Slack threads for a short period, so users can make follow-up requests against the same warm workspace. Stop or suspend idle sandboxes and resume them when a conversation continues. Delete failed or expired sessions. To do all of this we lean on the SDK for the full surface area: sandbox lifecycle operations, command execution, files, snapshots, ports, egress policies, public disk-image inspection, and sandbox state. Two features carry most of the weight for us. The first is restricted egress. Our agent is autonomous and works with our source code, so we are not comfortable letting it talk to the open internet. Declaring a narrow allow-list of endpoints means the workspace can do its job and nothing more, and that control is what let us ship this with confidence. The second is snapshots. Cloning repositories and configuring the toolchain is not free and doing it on every Slack message would make the agent feel slow. With snapshots we pay that cost once and resume from a ready-to-work state, so follow-ups in a thread start fast. This is only the first workflow. We are already looking at background investigations using Application Insights and eventually letting the agent open pull requests for quick bug fixes. The same isolated-workspace pattern extends cleanly to all of it. Who this is for If you are building an AI agent that needs to run code, explore a repository, or reach into your systems, and you have been nervous about where that runs, ACA Sandboxes is for you. You do not have to choose between a capable agent and a safe one. Give it a hardware-isolated workspace, declare exactly what it can touch, snapshot the setup, and let it work. Templafy went from "how do we let an agent safely explore our source code" to a production workflow running out of Slack threads, on infrastructure they controlled end to end. The building blocks are the same ones you can pick up today. Next steps Create your first sandbox - https://sandboxes.azure.com/ Explore Azure Container Apps Sandboxes documentation - https://sandboxes.azure.com/docs/sandboxes/ Start with Azure Container Apps Sandboxes samples - https://github.com/azure-samples/azure-container-apps-sandboxes/1.4KViews3likes0CommentsIPv6 Dual-Stack Endpoints for Azure Container Registry (Public Preview)
By Johnson Shi, Aviral Takkar, Bin Du Introduction Two of the most common networking questions we hear from teams running Azure Container Registry (ACR) are: "Can my registry serve clients on IPv6 networks?" — Teams operating IPv6-only or dual-stack networks need their container registry reachable over IPv6. "How do we start moving registry traffic toward IPv6 without breaking anything?" — Organizations guarding against IPv4 address exhaustion, or operating under IPv6 transition mandates, want a migration path that doesn't disrupt existing IPv4 clients. Today, we're announcing the public preview of IPv6 dual-stack endpoints for Azure Container Registry for public endpoints and firewall rules, with IPv6 over private endpoints planned for GA. Set your registry's endpoint protocol to IPv4AndIPv6 , and its endpoints become reachable over both IPv4 and IPv6 — so IPv4-only, dual-stack, and IPv6-capable clients all connect to the same registry, each over whichever protocol their network stack selects. Key Takeaways ACR registries now support an endpointProtocol setting with two values: IPv4 (default) and IPv4AndIPv6 (dual stack, preview). Dual stack is additive — your registry continues serving IPv4 clients exactly as before. There is no IPv6-only mode. Dual stack requires dedicated data endpoints to be enabled ( --data-endpoint-enabled true ), and dedicated data endpoints require the Premium SKU. The service enforces this requirement. You can enable it today with Azure CLI 2.87.0 via az acr update --endpoint-protocol IPv4AndIPv6 . FQDN-based client firewall rules keep working unchanged; IP-based allowlists need to account for IPv6 traffic. Limitation: This public preview covers IPv6 for the registry's public endpoints and firewall rules only. IPv6 over private endpoints is planned for a future release. Limitation: ACR Tasks isn't supported on a registry that has IPv6 dual-stack enabled. Tasks does not work when the endpoint protocol isIPv6 dual-stack, including quick builds (with az acr build) and quick task runs (with az acr run). Support is planned for a future release. How to enable it On an existing registry (Azure CLI 2.87.0 or later) Dual stack requires dedicated data endpoints, so enable both in a single update: az acr update --name <your-registry> --data-endpoint-enabled true --endpoint-protocol IPv4AndIPv6 If dedicated data endpoints are already enabled, set the endpoint protocol on its own: az acr update --name <your-registry> --endpoint-protocol IPv4AndIPv6 Verify the configuration: az acr show --name <your-registry> --query "{endpointProtocol:endpointProtocol, dataEndpointEnabled:dataEndpointEnabled}" { "dataEndpointEnabled": true, "endpointProtocol": "IPv4AndIPv6" } Note: If your clients sit behind a firewall and you're enabling dedicated data endpoints for the first time, add firewall rules for <your-registry>.<region>.data.azurecr.io before enabling — switching from *.blob.core.windows.net to dedicated data endpoints changes where layer blobs are downloaded from. See Dedicated data endpoints for details. Reverting to IPv4 Dual stack is reversible at any time: az acr update --name <your-registry> --endpoint-protocol IPv4 Reverting the endpoint protocol leaves dedicated data endpoints enabled; disable them separately if desired. Scope of this preview This public preview enables IPv6 for the registry's public endpoints — the login server, dedicated data endpoints, and regional endpoints (if enabled). IPv6 over private endpoints isn't part of this preview. Support is planned for a future release. Until then, registries reached through a private endpoint continue to use IPv4. Additionally, IPv6 dual-stack support for ACR Tasks, including support for `az acr build` and `az acr run`, are not supported in the public preview. Support is planned for a future release. Requirements and how features compose Requirement Why Premium SKU Dedicated data endpoints are a Premium feature. Dedicated data endpoints enabled IPv4AndIPv6 requires dataEndpointEnabled: true ; the service rejects the setting otherwise. Azure CLI 2.87.0+ Adds --endpoint-protocol to az acr update . For geo-replicated registries, the endpoint protocol is a registry-level setting, and dedicated data endpoints exist in every replica region. Firewall guidance: rules based on registry FQDNs — the login server, dedicated data endpoints, and regional endpoints (if enabled) — continue to work unchanged for dual-stack registries; only IP-address-based allowlists need updating for IPv6. To learn more, see IPv6 dual-stack endpoints in Azure Container Registry (preview) and the ACR endpoint reference. If you have further questions about IPv6 dual-stack endpoints or dedicated data endpoints, reach out to us on the Azure Container Registry GitHub repository or file feedback through the Azure portal.292Views1like0Comments
How Many Copies of Each Layer Does Your Container Registry Actually Need?
Authors: Payal Mahesh and Vicky Lin Azure Container Registry team: Jeanine Burke and Johnson Shi Introduction It's Monday morning. You spin up a fresh 1,000-node AKS cluster for a big training run or a fleet-wide rollout. Every node reaches for the same large container image at the same instant. What actually happens in the next ten minutes - and whether your pods reach Ready in 9 minutes or 14 - turns out to depend on a single number you've probably never thought about: how many copies of each image layer exist behind your registry. At the surface, you see a single capacity number for your registry size - but behind that abstraction, Azure Container Registry maintains copies of your layer data to optimize pull performance. That number of copies directly determines the read throughput available per layer. Each copy can serve requests independently, so distributing the layer across storage allows it to be read in parallel. More copies mean more independent readers - and higher aggregate throughput when thousands of nodes pull at once. The intuitive answer is that more is better: add copies, get faster pulls. When we actually tested it at 1,000-node scale, the truth turned out to be more interesting: A few extra copies helped a little. A moderate number helped a lot, and eliminated storage throttling entirely. A large number helped no more than the moderate one. A huge number actually made pulls slower again. Think of it like opening checkout lanes at a grocery store. Opening a few more lanes when the store is slammed cuts the line dramatically. Past a certain point, though, extra lanes barely help, because by then it's the customers, not the cashiers, who are the bottleneck. And open too many? Now the staff is spread thin and tripping over each other, and the line moves worse than it did at the sweet spot. This post walks through what we measured, why the curve bends where it does, and what we're building next so finding that sweet spot isn't something anyone has to do by hand. Key Takeaways There's a sweet spot, not a slope. Adding copies per layer cut pod-startup P99 by 27% and raised P50 per-node egress throughput by 244%, but only up to a point. Past that, the returns vanish, and far past it, latency actually regresses. Storage throttling is the real enemy. The win comes from spreading load across enough storage backends that no single backend gets pinned at its egress ceiling. Once throttling is gone, more copies stop helping. Storage scale alone has a ceiling. Even at the sweet spot, the per-backend egress limit caps total throughput. The next jump in performance has to come from somewhere else, which is exactly what we're building (see What's Next). This isn't something customers should need to manage. We're building a proactive, on-demand storage scaling capability that automatically grows the footprint before throttling happens and shrinks it back when the burst is over. A quick bit of background Within a region, the layer data behind your container images is backed by Azure storage. The number of copies ACR maintains per layer determines how many independent storage backends a concurrent-pull workload can spread its reads across. That's what matters, because each backend has a finite egress ceiling. Once concurrent reads against one backend get close to that ceiling, requests start getting throttled, and your pulls slow down in proportion. The principle is simple: more copies per layer means more backends serving the same data, which means more total egress headroom and fewer throttled requests. What we wanted data on was how many, and where it stops helping. How we tested We ran a controlled series of large-scale pull tests against ACR Premium on a roughly 1,000-node cluster, with every node pulling the same large image cold at the same time (no local cache on any node). The only thing we changed between runs was the number of per-layer copies behind a single registry endpoint. Everything else, including rate limits, the image, node count, and concurrency, stayed constant. For each run we measured pod-startup latency (P50/P90/P99), end-to-end storage read latency, egress throughput distributions (P50-P99.9), and storage throttling events. Pod-startup latency is our headline metric, because it's the one number that reflects the actual customer experience no matter where the bottleneck happens to be. Per-node egress throughput matters too, though. It tells you directly how much pull bandwidth ACR delivers to your fleet, and it's usually what customers have in mind when they ask how much faster extra copies will make their pulls. We report egress as a distribution rather than a single average, since per-request and per-time-window views can tell very different stories about the same set of pulls. These are observations from a single controlled environment, not a service guarantee. Absolute numbers will move with image size, node count, layer composition, network topology, and concurrency. What we found We tested five configurations, sweeping from a low baseline number of per-layer copies up to a very high one. We name them by relative copy count rather than exact instance counts: Baseline: the lowest level, our reference point. Low: a modest step up from Baseline. Mid: a meaningful step up from Low. Higher: a further step up from Mid. Very high: the largest configuration we tested, well above Higher. Here are the numbers. All percent changes are relative to Baseline. Configuration Pod startup P50 Pod startup P90 Pod startup P99 Storage throttling events Peak per-backend egress Baseline (fewest copies) 9m 36s 11m 0s 14m 16s Many; all top backends above the egress ceiling Highest Low 9m 27s (−2%) 10m 14s (−7%) 12m 59s (−9%) Some; one backend still above the ceiling High Mid 9m 25s (−2%) 9m 45s (−11%) 10m 22s (−27%) Zero Below the ceiling Higher 9m 20s (−3%) 9m 37s (−13%) 10m 22s (−27%) Zero Well below the ceiling Very high 9m 28s (−1%) 10m 31s (−4%) 13m 48s (−3%) Zero Lowest Look at the P99 pod-startup column from top to bottom: 14m 16s, 12m 59s, 10m 22s, 10m 22s, 13m 48s. It improves, flattens out, then climbs back up. Three things explain that shape: 1. The win: Throttling falls off a cliff at the Mid configuration As we added copies per layer, per-backend egress fell and storage-side throttling decreased. At the Mid configuration, throttling errors hit zero, and they stayed at zero for every configuration above it. The upside isn't just that the errors went away, though. It's raw pull bandwidth. At the Mid sweet spot, the typical node saw its P50 egress throughput jump 244% over Baseline. With load spread across enough copies, each node pulled its layers off storage much faster, not just without stalling. For a workload owner, that's the difference between watching pods come up in a steady stream and watching them stall for tens of seconds at a time while throttling clears. Same image, same node count, same registry, very different experience. To put it in concrete terms: if your team runs a daily AI training kickoff that needs all 1,000 nodes pulling before the job can start, this is the difference between starting on time and starting four minutes late every day. Over a quarter of training runs, that adds up. 2. The surprise: more copies made pulls slower This is the finding that genuinely surprised us. Going from Higher to Very high, the largest configuration we tested, cost us 3 minutes and 26 seconds at P99: 10m 22s climbing back up to 13m 48s. That gave back almost the entire benefit we'd built up over the previous four configurations. Tail storage-read latency at Very high actually came out worse than Baseline. The Very high run is where the wheels came off, and the reason is the trade-off underneath. Once storage throttling is gone, more copies stop buying you anything, and the cost of fanning reads across that many backends starts to take over. The throughput distribution shows it clearly. P50 and P75 throughput had been climbing steadily and getting smoother through Mid and Higher, then dropped sharply at Very high while the peak P99/P99.9 spikes came back. Spread the same load across too many backends and it fragments into smaller, less consistent bursts. The takeaway is that "more is better" stops being true past the sweet spot, and the failure mode is quiet. You won't see throttling errors. You'll just see your pulls get slower. 3. What we didn't expect: at few copies, the hottest backend is what hurts you At the lowest copy counts, pull traffic wasn't spread evenly across the underlying storage footprint. Some backends absorbed far more traffic than others. As we added copies, that distribution evened out and the hottest backends cooled down. The implication is sharp. You can saturate the busiest backend, and trigger throttling, even when the total headroom across all your backends is large in aggregate. What matters is the load on the hottest backend, not the average. That's exactly the failure mode that demand-driven, proactive scaling (described below) is meant to head off before it happens. So how should you think about this? You don't size copies yourself; ACR manages the storage footprint behind your registry. Still, it helps to understand what moves the sweet spot, because the shape of your own workload is what decides where it lands. The bigger your worst-case concurrent burst (more nodes, larger images, higher concurrency), the more copies per layer it takes to keep pulls off the throttling ceiling, and the further out the sweet spot sits. Smaller workloads may already be sitting on the flat part of the curve. One thing is worth saying plainly. The storage footprint underneath is managed by ACR and shared across many registries, so there's no fixed, private storage budget that maps one-to-one to your workload. The sweet spot isn't a number you compute and provision; it's a behavior the platform has to land on for you, which is exactly why we're moving toward demand-driven scaling that handles it automatically. That's what brings us to what we're building next. What's next: proactive, on-demand storage scaling and a caching layer The fixed-copy tests above answer the question "how many should the ACR system provision?" but they assume a single, static answer. Real workloads aren't static. A 1,000-node burst happens at deploy time, not at 3 a.m. on a Tuesday. And no matter how many copies are provisioned, the per-backend storage ceiling still bounds peak deliverable throughput. So we're investing along two complementary directions. 1. Proactive, demand-driven storage scaling We're building a capability that adjusts the number of per-layer copies automatically based on real-time pull demand: Proactive, not reactive. The system scales the storage footprint before concurrent pull pressure pushes any single backend near the throttling threshold, so throttling is prevented before it forms rather than cleaned up after the fact. On-demand scale-out. The footprint expands automatically as sustained pull demand grows. Scale-in when demand subsides. The footprint contracts so you're not paying for steady-state capacity you only needed during a burst. Tiering for cold content. Long-tail, rarely-pulled content can sit on colder storage, so the redundant footprint of frequently-pulled content doesn't pay full hot-storage cost everywhere. The benefit to customers is straightforward: smoother pulls under burst, higher delivered throughput on average, no permanent over-provisioning, and no manual re-tuning as workloads grow. 2. A caching layer to absorb burst beyond the storage ceiling Even a perfectly scaled storage footprint runs into the per-backend egress ceiling at extreme scale. To push past it, we're investing in a caching layer in the registry service that absorbs burst traffic before it ever reaches storage. A pull surge that hits the same set of layers, which is the common case for fleet-wide deployments, can be served largely from cache. That takes a lot of load off any single storage backend and complements the storage scaling above. We'll share results from this work in follow-up posts. If you have questions about scaling ACR for your workload, or about how we measure storage performance, reach out on the Azure Container Registry GitHub repository. Note: All results in this post are based on controlled internal testing configurations and are intended to illustrate general scaling behavior rather than prescribe exact configurations.334Views0likes0Comments